Chilat Doina
October 15, 2026
Paid traffic is climbing, your dashboards show healthy reach, and yet revenue barely moves. On Amazon, Sponsored Products generate clicks without enough detail-page purchases. On your DTC site, shoppers add products to carts, reach checkout, then disappear. The instinct is usually to buy more traffic, but that can amplify the leak instead of fixing it.
An ecommerce sales funnel gives you a more useful diagnosis. It separates demand from execution, shows where buyer intent weakens, and forces you to read Amazon and DTC as different operating systems rather than interchangeable storefronts. A brand with substantial traffic can lose more revenue through checkout friction than a smaller brand loses through limited awareness.

The operator's job is to answer three questions at every stage: what action should the shopper take, which metric proves it happened, and what failure mode explains the drop-off? That framework is more useful than a single blended conversion rate or a channel-level ROAS number.
If your acquisition engine is becoming difficult to forecast, the same discipline used to build a predictable pipeline applies here: define the stages, assign ownership, and identify the constraint before adding volume. Pair that funnel view with a clear unit economics analysis, because a conversion lift that destroys contribution margin isn't a win.
Traffic reports can make a weak business look busy. A campaign reaches more people, clicks increase, and attributed sessions rise, but the owner still can't explain why contribution margin remains flat. That pattern usually means the business is measuring arrival instead of progression.
A funnel turns the same journey into a sequence of accountable events. A shopper discovers a product, evaluates it, adds it to a cart, starts checkout, pays, receives the order, and decides whether to return. Each event has a different failure mode, and each deserves its own denominator.
Practical rule: Never ask whether traffic is “good” until you know how that traffic behaves after the click.
A high-intent shopper who abandons at payment isn't equivalent to a casual visitor who leaves from a landing page. Treating both exits as one “conversion problem” leads teams toward the wrong fix. The first may need clearer delivery terms or a trusted payment method. The second may need better audience targeting or stronger product education.
Baymard's 14-year tracking places average global cart abandonment at approximately 70.19%, so roughly seven out of ten shoppers who add products to a cart don't complete the purchase (Baymard Institute checkout research). That gap explains why a business can generate plenty of product interest while still missing its revenue plan. A small improvement in a late-stage rate can matter more than a large increase in unqualified visits.
Start with a weekly funnel view that separates:
Amazon and DTC make this diagnosis harder because the same shopper behavior appears through different reporting systems. Amazon compresses much of the journey into marketplace signals such as search visibility, detail-page sessions, and ordered product sales. DTC gives you more direct control, but it also makes you responsible for the complete path from landing page to payment confirmation.
The useful question isn't “How do we get more visitors?” It's “Which stage is currently limiting profitable orders?” Once that answer is visible, traffic becomes an input to manage, not a substitute for operating discipline.
A practical funnel follows the shopper's changing commitment. The stage names matter less than the action behind each one and the metric that proves the action occurred.
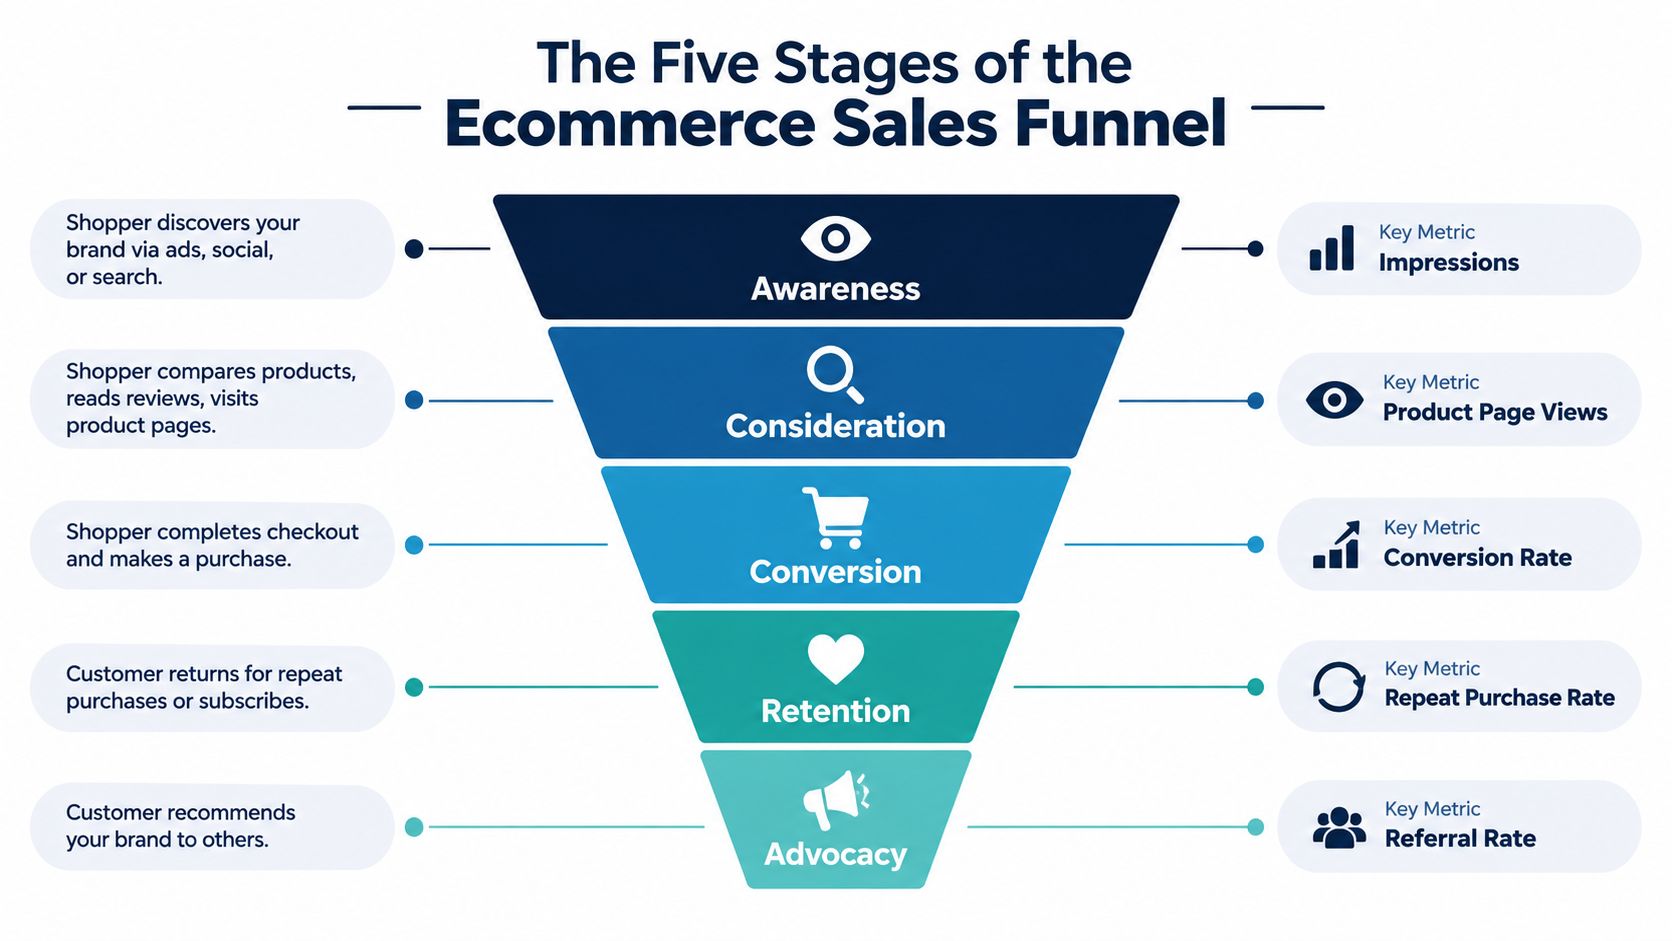
Awareness is the point at which a potential buyer encounters the brand through Amazon search, paid social, organic search, creators, email, or an AI assistant. Track impressions, qualified reach, click-through behavior, and downstream assisted actions. A large audience isn't automatically useful if it never produces product-page engagement or branded demand.
For Amazon, awareness includes search placement, Sponsored Products exposure, and branded storefront visibility. For DTC, it may begin with an ad impression or a creator mention and continue through a landing-page visit. The operating decision is whether the source is introducing the right product to the right audience.
Consideration starts when a shopper evaluates the offer. Product-detail-page views, time spent with buying information, review engagement, comparison behavior, and add-to-cart rate reveal whether the page resolves uncertainty.
The page needs to answer practical objections: Is this suitable for the shopper's use case? What arrives in the box? When will it arrive? What happens if it doesn't work? Amazon sellers communicate through images, bullets, A+ Content, reviews, and pricing. DTC brands can add comparison tools, quizzes, education, email capture, and richer merchandising.
For more ideas on reducing hesitation, use these ecommerce funnel optimization tips as a testing resource, not as a replacement for channel-specific diagnosis.
Conversion is the movement from meaningful product intent to a paid order. Track add-to-cart rate, checkout starts, order conversion, payment success, and contribution margin. Keep cart-to-checkout and checkout-completion rates separate, because they diagnose different problems.
Retention is visible in repeat purchase rate, cohort revenue, subscription continuation, replenishment behavior, and customer-service outcomes. The right follow-up depends on the product. Consumables need replenishment timing. Durable goods may need accessories, education, warranties, or setup support.
Advocacy includes reviews, referrals, user-generated content, organic recommendations, and branded search behavior. Review velocity and referral share are useful indicators, but quality matters more than raw volume. A customer who recommends the product to a specific friend can be more valuable than a passive social impression.
The funnel therefore answers five operator questions: Are we being seen? Are we being chosen? Are we being paid? Are we being remembered? Are we being amplified? Those answers should sit beside margin and inventory data, not in a separate marketing dashboard.
Amazon and DTC share the same buyer psychology, but they expose different controls. Amazon owns much of the environment around discovery, comparison, checkout, payment, and delivery. A DTC brand controls more of the experience, but it must earn every click, explain every objection, and maintain the checkout infrastructure.
On Amazon, the funnel is heavily discovery-led. Search placement, Sponsored Products, retail-readiness, review strength, price, availability, and detail-page conversion influence how often the marketplace presents an offer. Brand Metrics and Amazon attribution can help, but they don't provide the same complete behavioral path as a first-party DTC analytics setup.
On DTC, the operator can connect paid social, landing pages, email, SMS, onsite search, checkout events, and post-purchase messaging. That visibility brings responsibility. A DTC team can identify a shipping-page exit and change the experience, while an Amazon team may need to improve promise dates, listing clarity, inventory position, or offer competitiveness within marketplace constraints.
| Funnel Stage | Amazon Signal | DTC Signal | Primary Optimization Lever |
|---|---|---|---|
| Awareness | Search visibility, Sponsored Products exposure, branded discovery | Reach, landing-page sessions, engaged source traffic | Audience quality and discoverability |
| Consideration | Detail-page sessions, image and content engagement, review interaction | Product-page depth, comparison behavior, add-to-cart rate | Merchandising and objection handling |
| Conversion | Unit session behavior, Buy Box access, ordered product sales | Cart-to-checkout and checkout completion | Offer clarity, payment, and delivery confidence |
| Retention | Repeat buying behavior, Brand Analytics signals, customer messaging within policy | Cohort revenue, email and SMS engagement, subscription or replenishment behavior | Post-purchase experience and relevance |
| Advocacy | Reviews, ratings, organic brand demand | Reviews, referrals, user-generated content, branded search | Customer experience and referral mechanics |
The same conversion rate also means different things. On Amazon, it reflects an offer competing in a standardized marketplace context, often alongside substitute products. On DTC, it reflects the combined effect of acquisition quality, brand trust, page experience, pricing, shipping, checkout, and measurement accuracy.
Margin follows a different path too. Amazon fees, fulfillment economics, advertising costs, returns, and inventory placement shape the contribution calculation. DTC replaces some marketplace costs with media spend, payment fees, fulfillment decisions, customer support, and technology overhead.
A common mistake is copying a DTC landing-page playbook into an Amazon listing or treating Amazon's search data like a paid-social audience report. Use one customer journey model, then translate each stage into the signals and levers that the channel exposes.
A shopper may now ask an AI assistant to recommend a product, explain which option fits a use case, compare alternatives, or produce a shortlist with trade-offs. The assistant can shape the decision before the shopper visits an Amazon listing or DTC product page. That changes the top of the funnel from a search-results battle into a product-information and recommendation problem.
Adobe reported in February 2025 that 39% of surveyed U.S. consumers were already using generative AI for online shopping, while 14% expected to adopt it soon. Adobe also found that AI-referred visits had a 9% lower conversion rate than other traffic, narrowing from a 43% gap in July 2024 (Adobe's analysis of generative AI referral traffic).
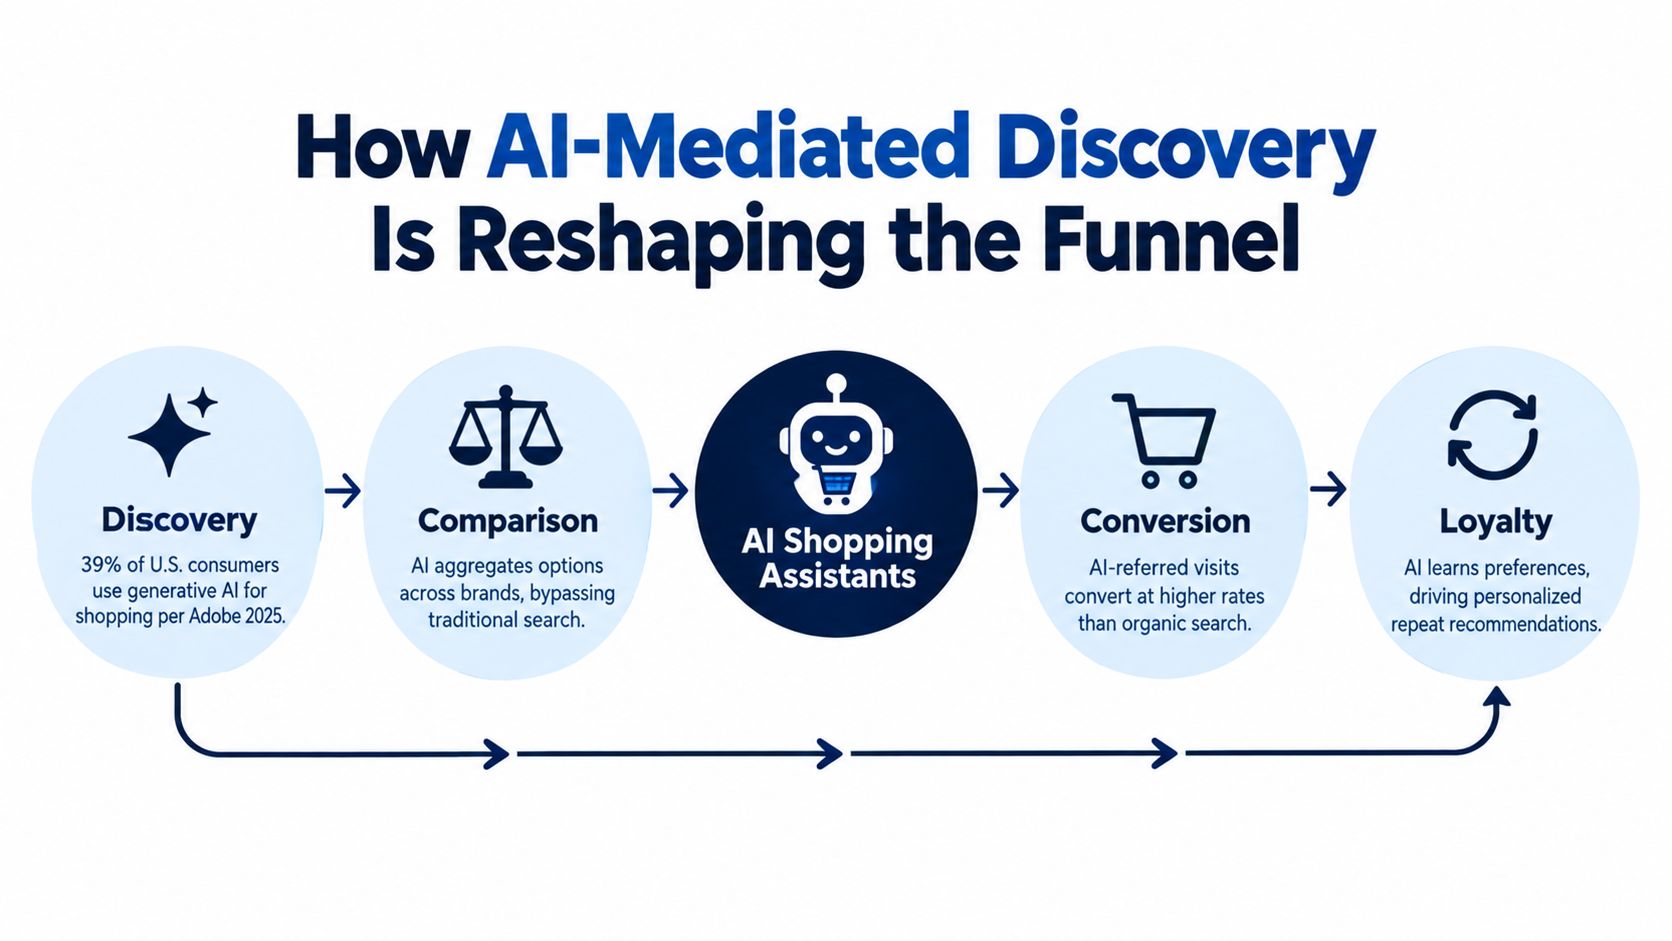
A lower immediate conversion rate does not prove that AI traffic is weak. These shoppers may be researching, comparing products, or validating a shortlist before purchasing later through direct, branded, Amazon, or another tracked channel. Last-click reporting can therefore miss the interaction that created demand.
Separate AI-assisted discovery, consideration, and transaction traffic where your analytics support that distinction. Track:
The performance gap is changing quickly, so avoid judging the channel from one early conversion snapshot. Compare cohorts and assisted behavior over time, then assess Amazon and DTC results separately because each channel exposes different conversion signals.
Product information must work for both machines and people. Keep product names, variants, dimensions, materials, compatibility, ingredients, pricing context, delivery expectations, return terms, and use cases consistent. Structured product data helps systems interpret the offer. Clear copy still matters because shoppers must verify the recommendation once they arrive.
For a wider operating perspective, review this AI for ecommerce guide alongside your referral and cohort data. The practical goal is accurate recommendation and confident purchase, not copy written for an algorithm while the offer remains unclear to the buyer.
Checkout is where high intent becomes either revenue or leakage. A shopper who has selected a product has already completed work that a cold visitor hasn't, so an unexplained exit deserves a more precise diagnosis than “the ad traffic was poor.”
Baymard attributes abandonment to several distinct frictions: 40% cite extra costs, 20% cite slow delivery, 19% cite payment distrust, 18% object to forced account creation, and 17% find checkout too long or complicated (Baymard's cart abandonment findings). These causes overlap operationally, but they require different fixes.
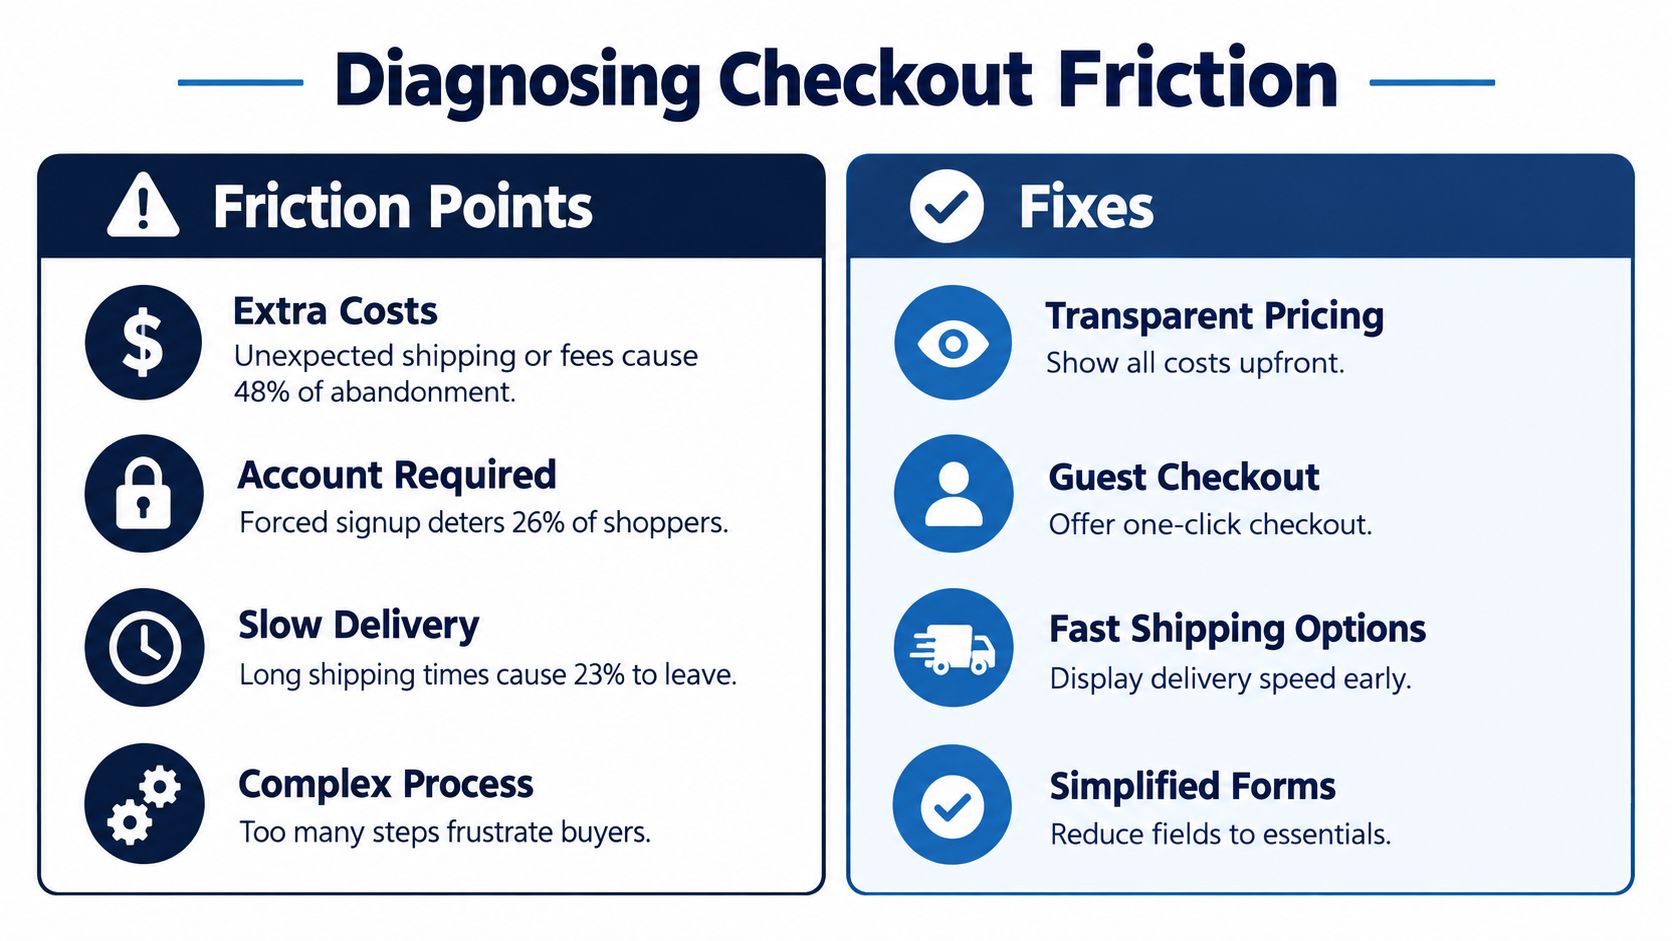
Start with the event sequence. Does the shopper leave after shipping costs appear, after selecting a delivery method, at the payment field, or when an account prompt blocks progress? Then segment the result by device, country, new versus returning customer, product type, and payment method.
Baymard reports that the average U.S. checkout displays 23.48 form elements by default, while optimized flows can reach 12 to 14 elements. Its research estimates that large ecommerce sites could achieve an average 35% conversion-rate increase through checkout design improvements alone (Baymard's current checkout UX research).
The point isn't to delete every field blindly. Fraud controls, tax requirements, subscriptions, international payments, and marketplace identity rules can justify complexity. The operator's job is to prove which field earns its cost.
Diagnostic rule: If mobile abandonment rises while desktop remains stable, don't rewrite the offer first. Inspect form behavior, keyboard handling, payment errors, loading time, and delivery selection on mobile.
Use event instrumentation that preserves the distinction between a shopper who never intended to buy and one blocked by a broken interaction. A review of Product Metrics on tracking options can help teams compare measurement approaches, but no tracking architecture compensates for an unsegmented funnel.
For implementation priorities, start with the conversion rate optimization best practices that match the dominant friction, then test one material change at a time. Judge the result using checkout completion, payment error rate, average order value, and contribution margin, not conversion rate alone.
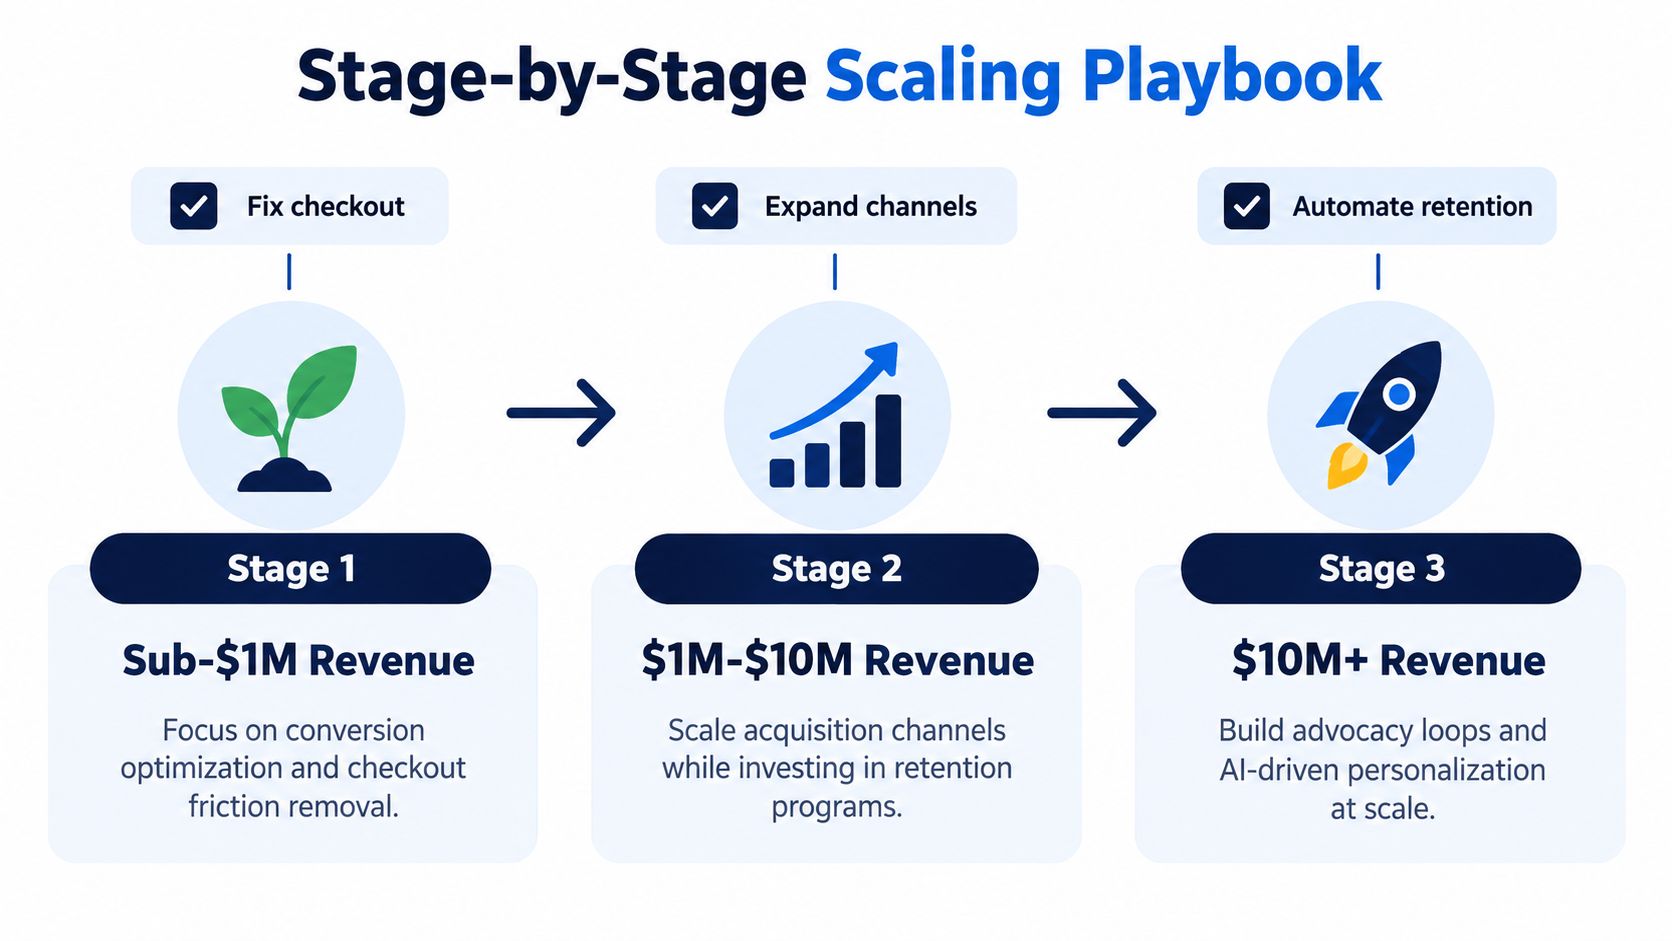
Scaling isn't a request to optimize everything simultaneously. It is a sequencing problem. The right investment depends on the size of the operating system, the quality of measurement, and the stage where profitable intent is currently being lost.
For a sub-$1M brand, fix measurement and conversion foundations before expanding spend. Confirm that product views, add-to-cart events, checkout starts, payment failures, orders, refunds, and contribution margin reconcile across the storefront and advertising platforms.
The first work usually belongs at the bottom of the funnel. Make delivery costs visible, remove unnecessary fields, test guest checkout, and verify mobile payment behavior. If the checkout is leaking, more acquisition creates a larger pool of disappointed shoppers.
A $1M to $10M brand needs more than a working acquisition loop. It needs to understand which first-order cohorts return, which products create a second purchase, and which post-purchase messages reduce support friction or generate useful reviews.
Build cohort reporting by acquisition source, product, geography, device, and first-order economics. Then connect replenishment reminders, education, cross-sells, warranty offers, and review requests to the actual product experience. For eligible brands, Million Dollar Sellers' Elite Seller software suite is one option for post-purchase funnels involving offers such as warranties, PDF manuals, gift cards, QR-code packaging links, and magic links.
At $10M and above, blended reporting hides too much. Test whether paid media creates incremental demand, distinguish marketplace growth from branded demand, and instrument AI-assisted discovery before it becomes impossible to separate from direct and organic traffic.
A useful weekly dashboard should show stage rates, not only totals:
Pause acquisition when the next unit of traffic produces more operational pressure than profitable orders. Resume expansion when the bottleneck has a named owner, a measurable hypothesis, and a result that survives segmentation.
A campaign can drive qualified shoppers to an Amazon detail page or DTC product page and still lose the sale at checkout. Extra traffic will not fix hidden shipping costs, unanswered objections, mobile payment failures, or an offer that is unavailable. It can expose those weaknesses faster while raising media spend and customer-service volume.
Myth one: more traffic fixes a revenue problem. Baymard's cart-abandonment research separates extra costs, delivery expectations, payment trust, account requirements, and checkout complexity. Diagnose the stage where intent disappears before buying more reach. The remedy may be a clearer offer, a faster checkout, or a payment fix.
Myth two: one blended conversion rate shows whether the funnel works. A blended figure can hide strong returning-customer performance, a weak new-customer landing page, or a payment error on one device. Report conversion by source, device, geography, product category, customer status, and checkout step.
Higher conversion can still produce weaker economics. Discounting, absorbed delivery costs, fraud, and returns can erase the gain. Track order contribution, payment errors, average order value, and returns beside the conversion result.
Myth three: Amazon and DTC need the same optimization playbook. Amazon performance depends on marketplace relevance, offer competitiveness, availability, detail-page clarity, and compliant review generation. DTC gives you more control over acquisition creative, landing-page continuity, first-party measurement, checkout design, and owned retention. The trade-off is responsibility for more of the customer journey and its operating costs.
Myth four: AI-referred traffic belongs in the same reporting bucket as every other visit. Adobe found that AI-referred visits converted differently from other traffic, with the gap changing sharply between July 2024 and February 2025 (Adobe's referral traffic analysis). Measure research intent, assisted revenue, and later cohort quality separately instead of judging the channel through a single ROAS column. That separation matters across both Amazon discovery and DTC acquisition.
Run this audit before approving the next acquisition increase:
Fix leakage before increasing spend. Measure each stage before trusting the blended rate. Instrument AI-assisted discovery before attribution makes it invisible.
Million Dollar Sellers offers an invite-only peer environment where ecommerce founders share operating lessons across Amazon, DTC, and omnichannel businesses. If you want experienced feedback on your funnel diagnosis, channel trade-offs, and scaling priorities, visit Million Dollar Sellers to learn more.
Join the Ecom Entrepreneur Community for Vetted 7-9 Figure Ecommerce Founders
Learn MoreYou may also like:
Learn more about our special events!
Check Events