
Chilat Doina
October 17, 2025
Let's get right to it. Contribution margin is the money each sale leaves behind to pay for your fixed business costs—things like rent and salaries—and, most importantly, to generate profit.
Think of it as the revenue you make from a single product after subtracting only the variable costs directly tied to producing and selling that specific item.

Imagine you run an online coffee subscription box. For every single box you sell, you have costs that pop up with each order: the coffee beans, the box itself, and the shipping label. These are your variable costs—they go up and down with your sales volume.
The cash left over after you subtract these specific costs from your sales price? That's your contribution margin. This is the money that "contributes" to paying for all your other business expenses that don't change with each sale, which we call fixed costs.
Chasing top-line revenue alone can be a trap. A business can look impressive with huge sales figures but still be bleeding money if its variable costs are out of control. Contribution margin cuts through that noise and shows you the true profitability of every single unit you sell.
It’s a foundational metric for making smarter, more strategic decisions, like:
Contribution margin isn't just some boring accounting term; it's a powerful lens for seeing which products truly fuel your business. It shifts the focus from "how much did we sell?" to "how much did we keep from each sale?"
Before we dive into the formula, it helps to have a quick cheat sheet for the key terms involved.
This table breaks down the core building blocks you'll need to know.
TermSimple DefinitionExampleRevenueThe total amount of money you generate from sales.Selling 100 shirts at $25 each gives you $2,500 in revenue.Variable CostsCosts that change in direct proportion to how many units you sell.The cost of fabric, printing, and shipping for each individual shirt.Fixed CostsExpenses that stay the same regardless of your sales volume.Your monthly warehouse rent, employee salaries, and software subscriptions.Contribution MarginThe revenue left over from a sale after covering variable costs.The portion of that $25 shirt price that's left after you pay for the shirt itself.
With these concepts in mind, you can start to see how everything fits together to paint a picture of your business's financial health.
It’s a common point of confusion, but contribution margin is different from another key financial figure. If you want to get the full picture, you can learn more about the differences when you explore what is gross margin in our related guide. Honestly, understanding both gives you a much clearer view of your company's profitability and how efficiently you operate.

Figuring out your contribution margin doesn't require an accounting degree or some fancy software. It really just boils down to a couple of straightforward formulas that pull back the curtain on your product's true profitability. The first step is getting a handle on your variable costs.
These are the expenses that go up or down directly with your sales. Think of things like raw materials, packaging, payment processing fees, and the cost to ship each unit. They’re different from your fixed costs—like rent or salaries—which stay the same whether you sell one widget or a thousand.
To really nail this down, it’s worth taking a closer look at your cost of goods sold. Understanding what goes into that number is a must for any e-commerce seller.
The most granular, ground-level way to look at profitability is on a per-product basis. This little calculation tells you exactly how much cash each sale kicks back into your business before you even think about fixed overhead. It’s the perfect tool for spotting your rockstar products (and the ones that are dead weight).
Formula: Contribution Margin Per Unit = Price Per Unit - Variable Cost Per Unit
Let’s say you run an online store selling custom-printed t-shirts. Here’s how the numbers might shake out:
Plugging those numbers into the formula: $30 (Price) - $14 (Variable Costs) = $16 (Contribution Margin Per Unit).
Simple as that. Every single t-shirt you sell adds $16 to the pot that will eventually cover your fixed costs and, hopefully, become pure profit.
While the per-unit number is fantastic for analyzing specific products, the total contribution margin gives you the 10,000-foot view of your business performance over a certain period. It shows you the grand total of money generated to cover all those fixed expenses.
Formula: Total Contribution Margin = Total Sales Revenue - Total Variable Costs
Let’s stick with our t-shirt shop. Say in one month, you sold 500 shirts.
Now, apply the formula: $15,000 (Revenue) - $7,000 (Variable Costs) = $8,000 (Total Contribution Margin).
That $8,000 is what your business has left over to pay for things like rent, salaries, and software subscriptions before a single dollar is counted as profit. To get an even fuller financial picture, it's also smart to learn how to calculate profit margins, which gives you a different but equally important perspective.
Let's move beyond the calculator. What is contribution margin, really? Think of it as a powerful, forward-looking tool for making smarter business decisions. This isn't just about tracking past performance; it’s about creating a clear roadmap for future growth.
By isolating the actual profit you make from each individual sale, you gain the kind of clarity you need to steer your company with real precision.
One of the most immediate ways to use it is for break-even analysis. This is a crucial calculation that shows you the exact sales volume you need to hit to cover all your costs—the point where you officially become profitable. It answers that fundamental question: "How many units do we have to sell to finally stop losing money?"
Knowing this number empowers you to set realistic sales targets and manage your budget way more effectively. If you want to dive deeper into this, check out our guide on how to calculate your break-even point.
Contribution margin is hands-down your best tool for looking at your product portfolio. It helps you pinpoint which products are your true profit powerhouses and which ones might be dragging down your numbers, even if they sell in huge volumes.
Some products might have a pretty low margin but sell so often that their total contribution is massive. Others might boast a high per-unit margin but sell so rarely they barely make a dent. This kind of analysis is gold—it tells you exactly where to focus your marketing spend, which products to promote, and which ones might need to be repriced or even retired.
This bar chart gives you a quick visual of how different products can have wildly different margins, which completely changes their strategic value.
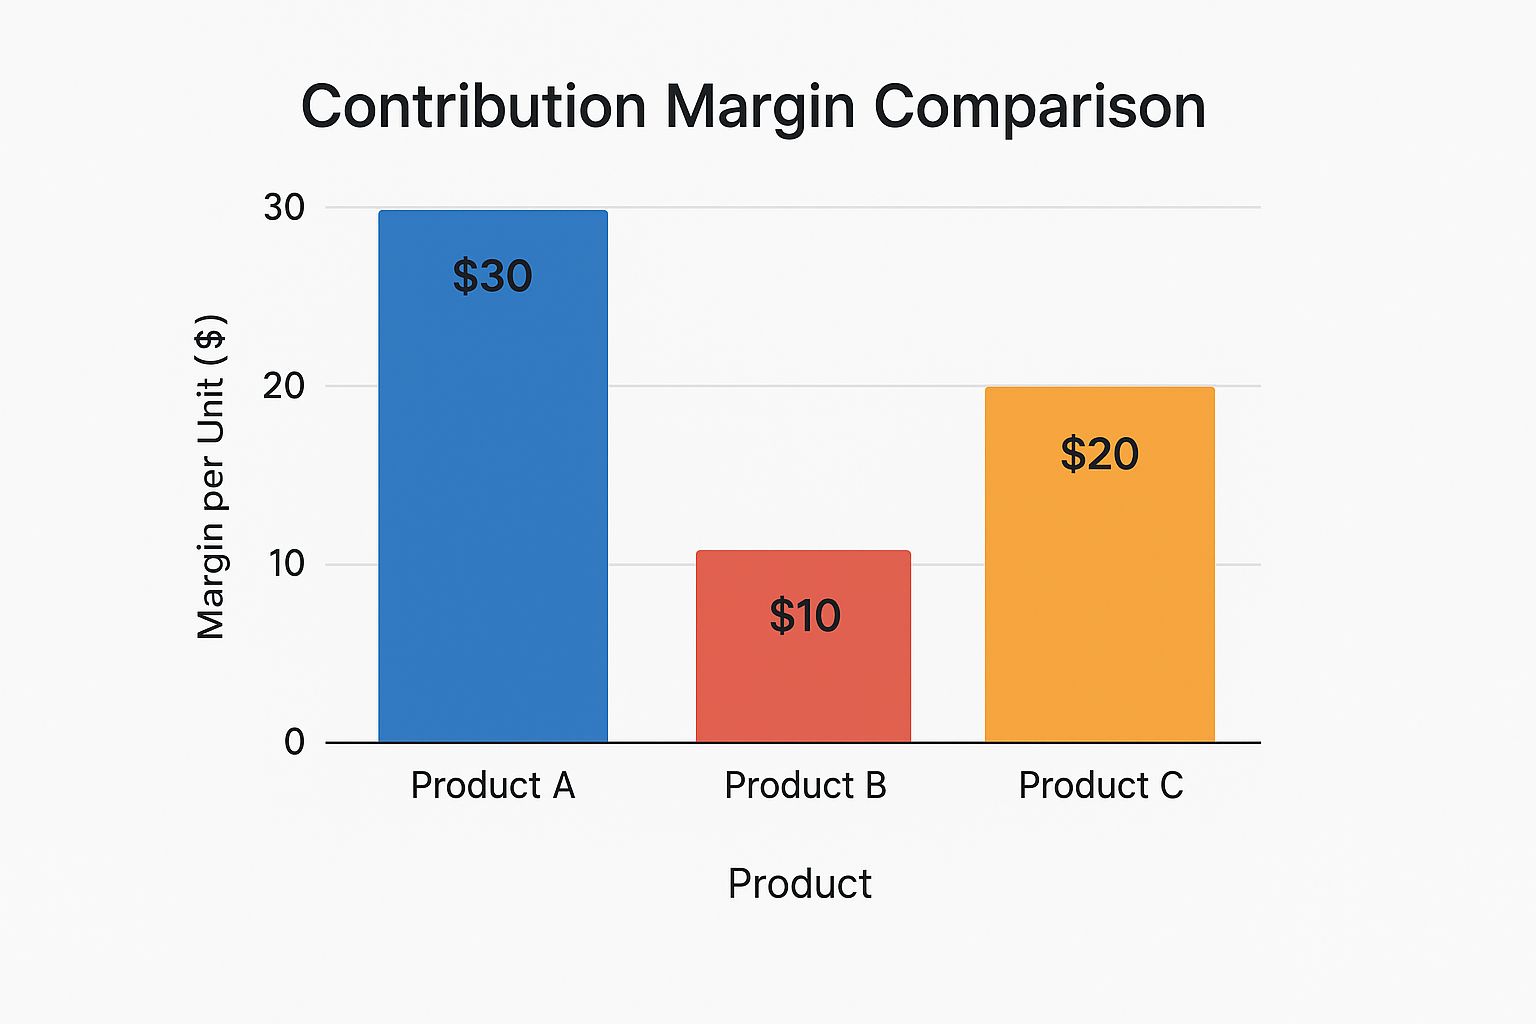
As you can see, Product A is the clear winner, bringing in $30 from every sale. Product B, on the other hand, only contributes $10.
Getting a good handle on your contribution margin unlocks some serious strategic flexibility. For example, it helps you figure out if you should take on special, one-time orders. You might be able to accept a huge order at a discounted price if the sale still generates a positive contribution margin, because that extra income helps chip away at your fixed costs.
Contribution margin reveals where your company truly makes its money. It transforms raw financial data into an actionable strategy, showing you which levers to pull to boost your bottom line.
This metric also provides crucial context. Margins vary like crazy from one industry to another. For instance, the electronics and computer distribution world squeaks by on a slim 13.2% average gross margin, while pharmaceuticals can soar past 50%. This shows why it’s so important to benchmark against your peers to understand what a "healthy" margin even looks like in your field.
To really get a strategic edge from your contribution margin, start thinking about how your pricing model affects it. Exploring things like value-based pricing strategies can be a game-changer. This approach ensures your price tag reflects the actual value you're delivering to customers, which directly boosts the margin on every single sale.
So, what’s a “good” contribution margin? The honest answer is: it depends.
This metric isn't a one-size-fits-all number. What spells incredible success in one industry could signal deep trouble in another. The real power of contribution margin comes from understanding these industry-specific quirks.
Take a software-as-a-service (SaaS) company. Their cost structure is worlds apart from a retail store. Once the initial development work is done (a huge fixed cost), the variable cost to add one more customer is practically zero. It might just be a few cents for payment processing or server space. This creates an incredibly high contribution margin, often soaring above 80-90%.
Now, flip the script to a grocery store or a direct-to-consumer (DTC) brand selling physical products. Every single sale comes with a hefty list of variable costs—the product itself, the box it goes in, and the shipping label. As a result, their contribution margins are much, much lower. For them, high sales volume isn't just a goal; it's the only path to profitability.
At its core, the difference boils down to the nature of variable costs. High-margin industries usually have tiny variable costs per unit, while high-volume industries have significant costs tied to every sale.
Knowing your industry's benchmark is the first step toward setting realistic financial goals. A 35% margin might be fantastic for a retailer but downright alarming for a SaaS company. Context is everything.
To really drive this home, let’s look at how different business models stack up. The table below gives you a general feel for how cost structures and margins vary across a few common industries.
IndustryTypical Variable CostsTypical Fixed CostsExpected Contribution MarginSaaS/SoftwareServer hosting, payment processing fees, customer support for new users.Software development, R&D, marketing, salaries, office rent.Very High (70-90%+)E-commerce/RetailCost of goods sold (COGS), packaging, shipping, transaction fees.Warehousing, marketing salaries, website platform fees, rent for physical stores.Low to Moderate (20-50%)ManufacturingRaw materials, direct labor, factory utilities, production supplies.Factory equipment depreciation, rent, administrative salaries, R&D.Moderate (30-60%)Consulting/ServicesBillable hours of contractors or project-specific staff, travel expenses.Full-time salaries, office rent, marketing, software subscriptions.High (50-80%)
As you can see, a business selling digital products operates in a completely different financial universe than one selling physical goods. This is why you can't just borrow a "good" margin from another industry and apply it to your own.
The concept of contribution margin is also a lifeline in sectors dealing with massive fixed costs, like oil and gas. These companies have to generate an enormous margin just to cover their staggering investments in exploration and equipment.
Historically, integrated oil companies have reported gross profit margins between 30% and 35%. Exploration firms can see that number jump above 50% when commodity prices are high. This means for every $100 in sales, a typical integrated oil company gets to keep around $30–$35 to cover its colossal fixed costs. It’s a powerful illustration of how critical pricing power and cost control are in their world. If you're curious, you can explore more about these industry-specific financial metrics to see how they measure performance.

Getting a grip on your contribution margin is a huge step forward, but like any powerful tool, you have to know how to use it right. It's all too easy to fall into a few common traps that can lead you completely astray.
One of the biggest mix-ups is confusing contribution margin with gross margin. They sound similar, but they tell you very different stories about your business, and making decisions based on the wrong one is a recipe for disaster.
Gross margin simply subtracts the Cost of Goods Sold (COGS) from your revenue. The problem? COGS is often a messy blend of both variable and fixed costs. In contrast, contribution margin subtracts only the truly variable costs, giving you a much cleaner, more precise metric for making smart internal decisions.
The entire value of your contribution margin analysis rests on one thing: correctly separating your variable and fixed costs. If you get this wrong, your numbers will be skewed, and your understanding of which products are actually profitable will be completely distorted.
A classic mistake is lumping a fixed cost, like a warehouse manager's salary, into your variable costs. Doing this will artificially crush your contribution margin and could make you think a perfectly healthy product is a dud that needs to be cut.
To sidestep this landmine, you need to be methodical:
A low-margin product isn't automatically a bad product. If it sells in high volume, its total contribution to covering fixed costs can be massive. Never judge a product on its per-unit margin alone.
Another critical pitfall is getting tunnel vision and focusing only on the per-unit margin while totally ignoring sales volume. It’s a classic case of missing the forest for the trees.
Think about it: a product with a tiny $5 margin that sells 10,000 units a month is chipping in $50,000 toward your fixed costs. Meanwhile, another product with a juicy $50 margin that only moves 100 units is only contributing $5,000. If you axed the "low-margin" product in this scenario, you’d be shooting yourself in the foot.
It's also crucial to ground your analysis in the reality of your industry. Global trends show that while margins have grown, the gains haven't been spread evenly. Over the past couple of decades, margin expansion has powered about half of all equity returns in the developed world, but that growth was heavily skewed toward sectors like tech and communications.
At the same time, many traditional industries, like manufacturing, have seen their margins stagnate. This is exactly why your strategic goals need to be realistic and informed by your specific market. You can dig deeper into these global margin trends from Bridgewater Associates to get a better sense of the bigger picture.
When you start digging into the numbers that drive your business, a few questions always seem to pop up. Let's tackle some of the most common ones to help you put your new knowledge of contribution margin to work.
So, what’s the actual difference between contribution margin and gross margin? They sound similar, but they tell you completely different stories about your business.
Gross margin is what you get when you subtract the Cost of Goods Sold (COGS) from your revenue. The problem is, COGS is often a messy number, lumping both fixed and variable production costs together.
Contribution margin gives you a much cleaner, more useful picture. It only subtracts the true variable costs from revenue. This isolates the exact amount of cash each sale generates to help pay your fixed overhead. For internal decisions—like pricing a new product or figuring out if you can afford a special order—it’s a far superior metric.
Is it a waste of time to sell a product with a low margin? Not at all. Judging a product only by its per-unit margin is a classic mistake. The real story is often about volume.
Sure, a product might have a slim margin, but if it flies off the shelves, its total contribution to your bottom line can be massive. These high-volume items are often the workhorses of a business. They consistently churn out the cash you need to cover fixed costs like rent and salaries, which is what ultimately fuels your overall profitability.
Alright, so how do you actually improve your contribution margin? It really comes down to pulling one of three levers: bumping up your price, cutting your variable costs, or getting more efficient.
Here are a few ways to make that happen:
Focusing on these areas means every single sale puts more money in your pocket to cover those fixed costs and drive profit.
At Million Dollar Sellers, we know that mastering your numbers is what separates the pros from the amateurs. Join our exclusive community of elite e-commerce founders to get the playbooks that 7, 8, and 9-figure sellers use to dominate their markets. Learn more about what MDS can do for your business.
Join the Ecom Entrepreneur Community for Vetted 7-9 Figure Ecommerce Founders
Learn MoreYou may also like:
Learn more about our special events!
Check Events