


Stay Updated with Everything about MDS
Thank you! Your submission has been received!
Oops! Something went wrong while submitting the form.
Chilat Doina
November 22, 2025
Inventory turnover is one of those metrics that sounds complicated, but it's actually pretty simple. It tells you how many times your business sells and replaces its entire stock over a specific period.
Think of it as a speedometer for your sales efficiency. It answers the question: How fast are we turning the stuff on our shelves back into cash?
Imagine your inventory is literally cash sitting on your warehouse shelves. Every unsold product is capital that's tied up, unable to be used for marketing, growth, or just paying the bills.
The faster you can convert that "shelved cash" back into actual money in your bank account, the healthier your business will be. This conversion speed is exactly what inventory turnover measures.
To bring this to life, picture two different businesses:

The bakery is a picture of financial health. Its cash flow is strong, its products are always fresh (preventing waste), and it can quickly adapt to what customers want. The bookstore, on the other hand, is struggling. Its capital is trapped in unsold goods, storage costs are a constant drain, and it has little flexibility to change what it offers.
Tracking your inventory turnover isn't just an accounting exercise—it's a vital diagnostic tool for your entire operation. It gives you direct insight into several key areas of your business, revealing both strengths and weaknesses.
A healthy turnover rate is a clear sign of strong sales and smart inventory management. A poor rate? That's often the first warning sign of deeper problems.
Your inventory turnover ratio is more than just a number. It’s a direct reflection of your purchasing decisions, your sales effectiveness, and your overall operational agility. Mastering this metric is fundamental to building a resilient and profitable ecommerce business.
For any serious business owner, understanding this KPI is non-negotiable. It directly impacts your ability to manage cash flow, slash costly waste from obsolete stock, and ultimately drive sustainable growth.
Let's break down what a high or low turnover rate really means for your day-to-day.
The table below gives you a quick snapshot of what your inventory turnover ratio is signaling about your business's health.
In short, a high number generally points to a well-oiled machine, while a low number suggests there's some friction in the gears that needs a closer look.
Figuring out your inventory turnover ratio doesn't take a finance degree. It’s actually pretty straightforward and uses numbers you’re probably already tracking. At its heart, you're just comparing what you spent on the products you sold with the value of the products you still have sitting on the shelves.
The most reliable way to do this—the method the pros use—is the Cost of Goods Sold (COGS) formula. This approach gives you a true apples-to-apples comparison by measuring the cost of your sold inventory against the cost of your held inventory.
The formula itself is simple. It tells you how many times your business sells and replaces its entire stock over a specific period (usually a year), which is a massive tell-tale sign of how efficient your operation is.
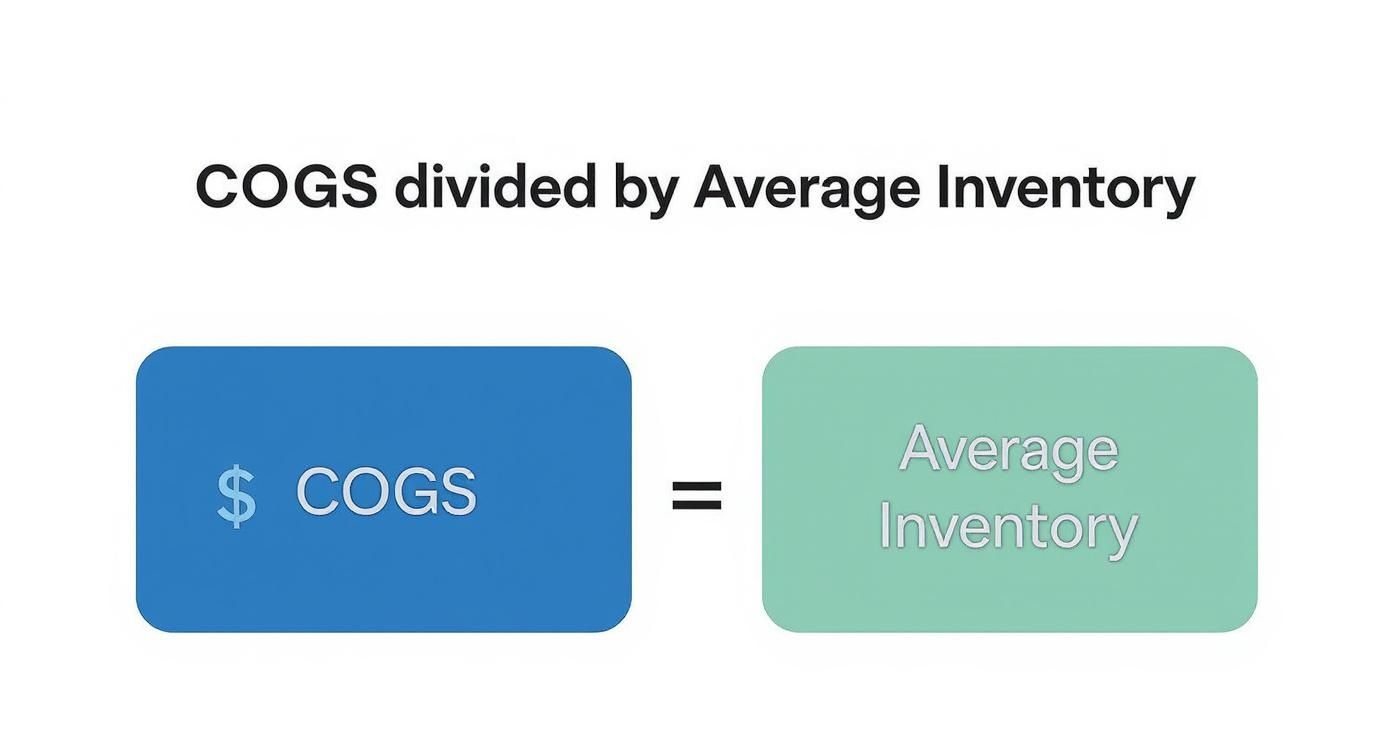
Here it is: Inventory Turnover Ratio = Cost of Goods Sold (COGS) ÷ Average Inventory.
Let's quickly break down what those two parts mean and where you can find them.
Cost of Goods Sold (COGS): This is the direct cost of everything you sold. Think materials, direct labor—the hard costs. You'll find this number on your income statement for whatever period you're looking at, whether it's a quarter or the full year.
Average Inventory: This isn't just a snapshot of your inventory's value. To get a real sense of things, you need an average to smooth out any big swings from promotions or seasonal demand. The formula is simple: (Beginning Inventory + Ending Inventory) / 2.
Using an average is non-negotiable. If you just pulled your inventory value from the end of December, your holiday sales would throw everything off, making your turnover look way better than it actually was. An average gives you a much more honest look at how your inventory really performed all year long. For more detailed guidance, check out our guide on how to calculate inventory turnover ratio.
Let's walk through a real-world example. Imagine you run an online clothing boutique called "Urban Threads" and you want to calculate your inventory turnover for last year.
You pull up your financial statements and find these numbers:
This means Urban Threads sold through and completely replaced its entire inventory 6 times over the past year. That number is now a powerful benchmark you can use to track the health of the business going forward.
Now, you might occasionally see a different formula floating around that uses total sales instead of COGS: Turnover Ratio = Total Sales / Average Inventory.
Be careful with this one. While it can give you a very rough estimate in a pinch, it’s not something you should rely on for serious internal analysis.
Why not? Because your sales number includes your profit margin. That inflates the top part of the equation and can make your inventory look like it's moving much faster than it really is. For the truest picture of your operational efficiency, always stick with the COGS-based formula. It gives you the unvarnished truth.
So, you've calculated your inventory turnover ratio. You have a number. Now what?
On its own, that number doesn't mean much. Think of it like a single frame from a movie—it gives you a snapshot, but you need the whole scene to understand what’s really happening. The story your ratio tells depends almost entirely on the industry you're in.
A ratio of 4 might be fantastic for a luxury car dealership but a total disaster for a grocery store. A jeweler expects a diamond ring to sit for months; a grocer needs to sell milk in days. This is the golden rule of interpretation: a "good" inventory turnover ratio is never a one-size-fits-all figure.
The goal isn't just to get a number. It's to understand what that number says about the speed and efficiency of your business.
Comparing your turnover rate to a business in a completely different world is a recipe for bad decisions. A high-end furniture store and a fast-fashion e-commerce brand operate in different universes when it comes to sales velocity. That's why the first step is to find out what's normal for your industry.
Industry benchmarks vary wildly and give you a realistic target to aim for.
For context, here’s a look at what "average" looks like across different sectors.
This table shows just how different "good" can look. Your ratio only becomes a meaningful KPI when you measure it against your direct competitors and sector averages. Digging into industry data from sources like Omneelab.com can give you an even clearer picture of where you stand.
The formula itself is pretty simple, but it packs a punch.
It's a straightforward look at the relationship between what you sold (at cost) and the value of what you're holding.
While the turnover ratio is a powerful metric, it can feel a bit abstract. A ratio of "6" doesn't immediately paint a picture of how long a product is sitting on your shelf.
For a much more intuitive metric, you can translate that ratio into a timeline. This is where Days Sales of Inventory (DSI), also called Days of Inventory Outstanding, comes in. It tells you the average number of days it takes to sell through your entire inventory.
It’s a simple calculation:
DSI = 365 / Inventory Turnover Ratio
Let’s go back to our example of the "Urban Threads" online boutique. They had an inventory turnover ratio of 6.0.
Just like that, the abstract ratio of "6" becomes a concrete piece of intel: on average, a product sits in the Urban Threads warehouse for about 61 days before someone buys it.
That’s a number you can actually work with. It lets you ask better questions like, "Is 61 days too long for our product lines?" or "What can we do to get this down to 45 days?" DSI makes your inventory turnover tangible, turning a financial metric into a clear operational target.
https://www.youtube.com/embed/1bDDd58XVLA
Your inventory turnover ratio is so much more than a number on a spreadsheet; it’s a direct measure of your company’s financial pulse. Think of it as a story about how hard your capital is working for you. A strong ratio can rocket your business forward, while a weak one can quietly bleed you dry and slam the brakes on your growth.
To really get a feel for its impact, let’s paint two very different pictures: one of a business crushing it with a healthy turnover rate, and another struggling under the weight of dusty, stagnant stock. The difference between their financial realities is night and day, and it shows just how critical this metric is to your bottom line.
When your inventory turnover is high (but not so high that you're constantly out of stock), your business runs like a well-oiled machine. This isn't just about operational neatness; it translates into some serious financial firepower that creates a positive feedback loop, fueling more growth and stability.
A business in this sweet spot typically enjoys:
Now, there is a catch. Pushing for an absurdly high turnover rate can backfire. It's often a sign that you're under-stocking, leading to frequent stockouts. That just frustrates customers and sends them straight to your competitors—a mistake that can easily cost you more than you save.
Let’s look at the flip side: a business with a low inventory turnover rate. On the surface, a packed warehouse might look impressive, like a sign of a well-stocked company. But financially? It’s often a slow-motion disaster.
Stagnant inventory is the silent killer of profitability, creating a chain reaction of financial headaches:
A low inventory turnover rate is a flashing red light. It’s a clear warning that your capital is being squandered, creating a drag on your cash flow, jacking up your financial risk, and ultimately choking your ability to invest in the future.
At the end of the day, your inventory turnover ratio isn’t just about counting boxes. It’s about managing your cash, your risk, and your capacity to grow. Making this number a core focus of your strategy is one of the most direct ways to build a stronger financial foundation for your business.

Knowing your inventory turnover ratio is the first step, but improving it is where the magic happens. A low turnover rate isn't a dead end—it's a flashing sign telling you it's time to act. By putting the right strategies in motion, you can slash waste, free up cash, and build a much stronger, more profitable business. This is your playbook for turning data into dollars.
The goal isn’t just about selling faster. It's about buying smarter and managing every single unit with precision. Each of the following tactics tackles a different part of your inventory's journey, from the moment you buy it to the moment a customer does. Getting just one or two of these right can make a huge difference to your turnover and your bottom line.
Honestly, the best way to improve inventory turnover is to stop buying products that are just going to sit there. It all starts with sharp demand forecasting. Instead of just going with your gut or reordering what you did last year, you need to use data to get a much clearer picture of what your customers will actually want to buy.
Start by digging into your historical sales data. Look for patterns around seasons, past promotions, and any trends you see bubbling up. Most modern inventory software has forecasting tools baked right in, which can do a lot of the heavy lifting for you and help you make decisions based on facts, not feelings. The better you get at predicting demand, the less cash you'll have tied up in slow-moving stock.
Just-In-Time (JIT) inventory is all about getting goods from your suppliers only as you need them for production or to fulfill an order. Think of it as the ultimate lean inventory model. It’s designed to cut your holding costs and the risk of products becoming obsolete down to almost zero.
Now, a full-blown JIT system requires rock-solid relationships with reliable suppliers and a hyper-efficient supply chain, which can be tough. For most e-commerce brands, a modified JIT approach is way more practical. This could mean ordering your best-selling items in smaller, more frequent batches. You keep stock levels lean but never risk selling out of your winners.
By minimizing the amount of inventory you have on hand at any given moment, you automatically boost your turnover rate. This frees up a ton of working capital that you can pump back into growing the business.
Slow-moving inventory is a direct anchor on your turnover ratio. Don't just let those products collect dust in a corner of the warehouse; you've got to be proactive about turning them back into cash. Smart promotions and dynamic pricing are your best friends here.
Consider giving these tactics a shot:
The trick is to act before the inventory becomes a real problem. Set up regular review cycles to spot underperforming products early. That way, you can launch a promo strategy while the items are still relevant. Many of these ideas are part of broader inventory management best practices that focus on maintaining a healthy, continuous flow of stock.
Let's face it: not all of your inventory is created equal. ABC analysis is a dead-simple way to categorize your products into three buckets based on how much value they bring to your business:
This framework helps you focus your energy where it counts. You should manage your "A-Items" like a hawk—always in stock, but never overstocked. For your "C-Items," you can afford to be a bit more relaxed, since stocking mistakes won't hurt your finances nearly as much. For brands managing specific goods like office supplies, you can find Practical inventory management discussions that often touch on similar efficiency-boosting methods. When you optimize how you manage each category, your overall inventory turnover naturally gets a whole lot better.
Even after you've got the formulas down, putting inventory turnover into practice always brings up a few tricky questions. It's a powerful metric, for sure, but context is everything.
Let's dig into some of the most common sticking points I see sellers run into. Getting these cleared up will help you go from just knowing the definition to actually using it to make smarter decisions.
Absolutely. It’s one of those "too much of a good thing" situations. While a high turnover usually points to strong sales and efficient management, an excessively high ratio can be a serious red flag.
What's it a red flag for? Usually, it means you're under-stocking.
If you’re burning through inventory at a lightning pace, it’s a strong sign you aren’t carrying enough to meet customer demand. This leads straight to stockouts, which are killer. You don't just lose that one sale; you risk losing the customer for good when they bounce to a competitor who actually has the product.
Beyond that, a sky-high turnover can quietly drive up your costs. Placing tons of small, frequent orders often means higher shipping and admin expenses, which eats away at the very efficiency you think you’re achieving.
The goal isn’t to chase the highest number possible. The goal is to find your optimal turnover rate—that sweet spot where you maximize sales while minimizing both holding costs and the risk of stocking out.
The right answer depends entirely on how fast your business and your industry move. There's no one-size-fits-all rule, but there are definitely some clear best practices.
The most important thing? Be consistent. Pick a schedule and stick to it. That's the only way you can make meaningful comparisons and track whether you’re actually improving over time.
This is a critical distinction, and getting it wrong can completely throw off your analysis. You might see both methods floating around, but one is clearly better for making real business decisions.
The COGS-based formula (COGS / Average Inventory) is the gold standard. Why? Because it’s an apples-to-apples comparison. It measures the cost of the goods you sold against the cost of the inventory you're holding. This gives you a true, unvarnished look at your operational efficiency.
The Sales-based formula (Sales / Average Inventory), on the other hand, is less accurate because it mixes apples and oranges. Your total sales figure includes your profit margin, which inflates the top number in the equation and gives you a deceptively high turnover ratio. It can make you think you're moving inventory faster than you really are.
For any kind of serious internal analysis, financial reporting, or planning, always use the COGS-based formula.
In today's world, technology isn't a "nice-to-have" for inventory management—it's essential. The right systems give you a level of precision that was just impossible a decade ago, and that has a direct impact on your turnover.
A modern Inventory Management System (IMS) is the command center for all of this. Here’s how it helps:
When you integrate your IMS with your sales platforms (Shopify, Amazon, etc.) and accounting software, you create a single source of truth. This is what empowers you to make sharp, data-driven decisions that lead directly to a healthier, more profitable inventory turnover rate.
At Million Dollar Sellers, our members share the exact strategies they use to optimize every part of their e-commerce operations, from inventory management to global scaling. If you're a 7-figure seller looking to connect with a trusted network of peers operating at the highest level, see if you qualify to join us. Learn more about MDS.
Join the Ecom Entrepreneur Community for Vetted 7-9 Figure Ecommerce Founders
Learn MoreYou may also like:
Learn more about our special events!
Check Events.svg)
.svg)
.svg)

.svg)