


Stay Updated with Everything about MDS
Thank you! Your submission has been received!
Oops! Something went wrong while submitting the form.
Chilat Doina
November 22, 2025
Inventory turnover is one of those classic business metrics that sounds way more complicated than it is. At its core, it’s all about speed. It tells you how quickly you’re selling through your entire stock of products over a certain period.
Think of it as your business's sales velocity. A high turnover number means products are flying off the shelves. A low number? It means they’re sitting around, collecting dust.
Let’s use a simple analogy. Imagine you run a small bakery. You bake 100 loaves of sourdough every morning. If you sell all 100 by closing time and get ready to bake another 100 for tomorrow, you’ve "turned over" your entire bread inventory in just one day. That’s the concept in a nutshell.
It’s a crucial key performance indicator (KPI) that boils down to one simple but powerful question: How many times did my business sell its entire inventory this year?
To give you a quick reference, here's a table breaking down the core concepts.
This table simplifies what inventory turnover is, what it does, and why it's a must-track metric for any ecommerce business.
Understanding these basics is the first step toward using this metric to make smarter, more profitable decisions for your business.
Keeping a close eye on your inventory turnover ratio isn't just an accounting exercise—it's vital for keeping your business healthy. Your turnover rate has a direct line to your financial stability and how smoothly your operations run. When you know how fast your products are moving, you can make much smarter calls on purchasing, pricing, and marketing.
A solid grasp of turnover helps you:
The goal isn't just to sell products; it's to sell them in a timely manner. Inventory turnover reveals the true momentum of your sales engine, showing whether it's revving high or stalling out.
It’s easy to assume that a higher turnover rate is always the goal, but it’s not that simple. An extremely high ratio could be a red flag that you're under-stocking. If you're constantly running out of popular items, you're leaving money on the table and frustrating customers who might go to a competitor.
On the flip side, a very low ratio is almost always bad news. It usually points to overstocking, weak sales, or products that have become obsolete.
The perfect turnover rate isn't a one-size-fits-all number; it changes dramatically from one industry to another. A grocery store selling fresh produce will have a sky-high turnover compared to a dealership selling luxury cars. The real key is finding that sweet spot for your business and your products.
Alright, now that you’ve got the “why” behind inventory turnover, let’s get into the “how.” Calculating the ratio is actually pretty simple, but the number you get is incredibly powerful. It gives you a hard metric to measure how well your business is really doing. All you need are a couple of key figures from your financial statements.
There are two main ways to run the numbers. While both can give you a general idea, one is definitely the gold standard for getting an accurate picture.
Ask any accountant or financial analyst, and they'll tell you the best way to calculate this ratio is with your Cost of Goods Sold (COGS). Why? Because it’s a true apples-to-apples comparison. It pits the cost of your inventory against the actual cost of the products you've sold, stripping away any profit margins that could skew the results.
Here’s the formula:
Inventory Turnover Ratio = Cost of Goods Sold (COGS) / Average Inventory
To make this work, you'll need two numbers:
(Beginning Inventory + Ending Inventory) / 2.Getting this right hinges on having solid data. Thankfully, modern software platforms often come with advanced reporting capabilities that can pull these numbers for you in just a few clicks.
Some businesses opt to use total sales instead of COGS. It’s a bit of a shortcut, especially if your COGS data isn't easily accessible, but be warned—it can be misleading. Since sales figures include your profit markup, the ratio you get often looks better than it actually is.
The formula looks like this:
Inventory Turnover Ratio = Net Sales / Average Inventory
The problem here is you’re comparing a retail value (sales) to a cost value (inventory). It’s not a clean comparison and can hide operational issues. Whenever possible, stick with the COGS method for the most honest insights.
Time to make this real. Let's say you run an online store called "Cool Tees" and want to figure out your inventory turnover for the last fiscal year.
First, you pull your numbers:
Now you have everything you need.
Step 1: Calculate Your Average Inventory
First, let's find the average value of the inventory you held all year.
Step 2: Calculate Your Inventory Turnover Ratio
Next, plug your COGS and Average Inventory into the main formula.
So, what does this 4 actually mean? It means "Cool Tees" sold through and completely replaced its entire inventory four times over the course of the year. This is your baseline—a critical number you can now track month after month and compare against industry benchmarks to see how you stack up.
For most businesses, experts agree that a healthy ratio falls somewhere between 5 and 10, striking that sweet spot between having enough stock on hand and not tying up too much cash in products that just sit there.
Calculating your inventory turnover ratio is a huge step, but the number itself is only half the story. A ratio of 4 might be a disaster for a grocery store but a massive success for a high-end furniture retailer. Context is everything. To truly understand what your inventory turnover is telling you, you have to stack it up against industry benchmarks.
This is where you go from just knowing the number to understanding what it means for your business's health. Think of it like a speedometer in a car. Seeing you're going 45 mph doesn't tell you much until you know the speed limit is 25 mph in a school zone or 65 mph on the highway. Industry benchmarks are your speed limits; they give you the context you need to judge your performance.
A "good" ratio isn't a universal constant. It changes dramatically based on your business model, what you sell, and what your customers expect.
It’s easy to assume the higher the turnover, the better. And while strong sales are great, an unusually high ratio can be a red flag. It might mean your inventory levels are too lean, which leads to frequent stockouts. That means lost sales, frustrated customers who might not come back, and potentially higher shipping costs from placing tons of small replenishment orders.
On the flip side, a low turnover isn't always a sign of failure. If you're selling high-value, slow-moving items like luxury watches or custom-built machinery, a low turnover is just part of the business model. The goal isn't volume; it's maximizing profit on every single sale.
The key is finding that sweet spot for your specific niche. This visual breaks down the simple but powerful formula at the heart of this metric.
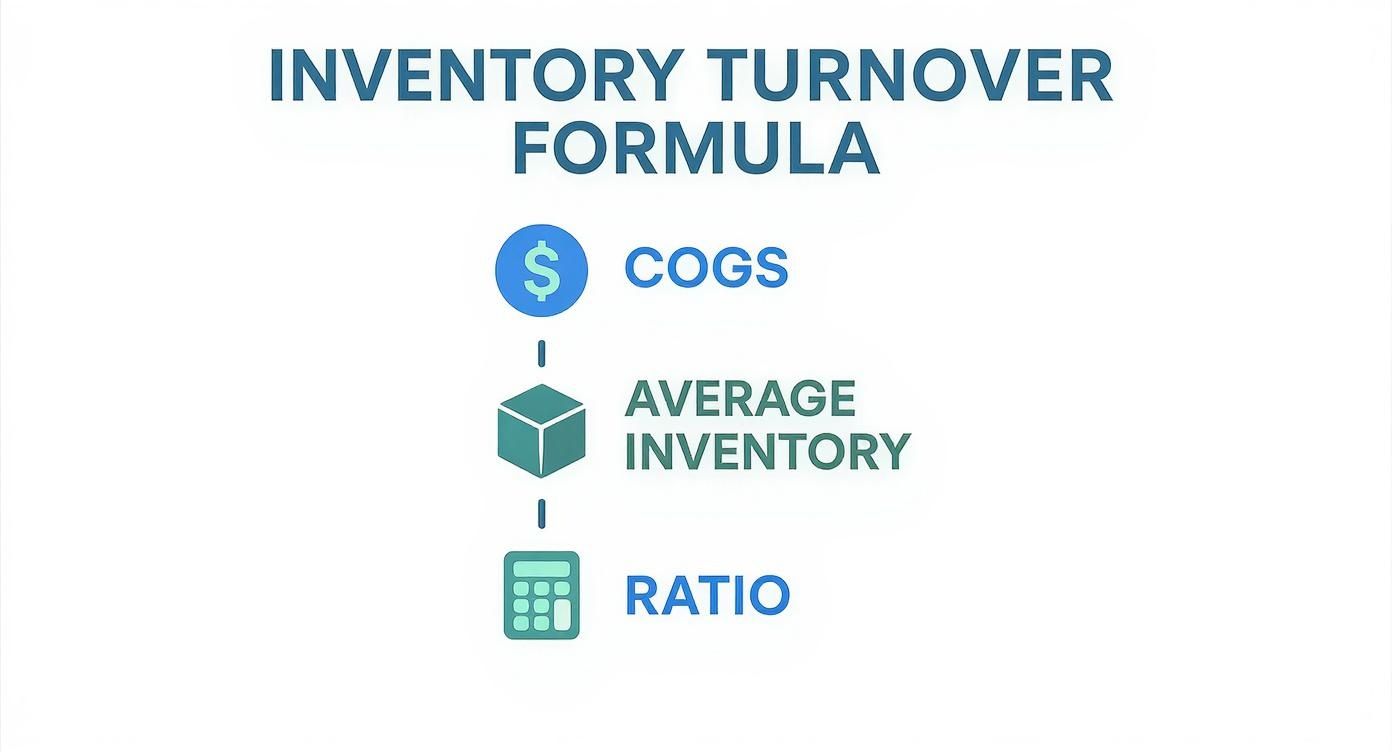
This graphic gets right to the point: Cost of Goods Sold divided by Average Inventory. This is the core calculation you'll use to compare your performance against the standards in your industry.
The game has changed. Decades ago, U.S. retailers might have turned their inventory 4 to 5 times a year and been perfectly happy. Today, things are way more competitive. Brick-and-mortar stores often aim for 4-6 turns, while nimble ecommerce businesses can hit 6-12 turns annually. The retail sector as a whole recently reported an average turnover ratio of 13.79, showing just how much operational speed has accelerated.
To give you a clearer picture, here’s a look at how different industries operate.
The numbers below really drive home the point that your industry dictates what's considered "good." A fast-fashion brand and a furniture store are playing two completely different games.
As you can see, a one-size-fits-all approach to inventory turnover just doesn't work. The real goal is to analyze your numbers within the context of your specific market.
The most powerful way to use your inventory turnover ratio isn't as a standalone number, but as a trend line. Tracking it over time shows whether your operational efficiency is improving, declining, or staying flat.
Ultimately, your ratio is a diagnostic tool. By comparing it to your industry's standards and tracking its changes, you can spot opportunities to refine your purchasing strategy, optimize marketing, and boost your overall profitability. For deeper insights into tracking these figures, check out our guide on creating an effective performance metrics dashboard.
Your inventory turnover ratio isn't just another number on a spreadsheet; it's a direct pulse on the financial health of your business. Why? Because every single product sitting on your shelves represents cold, hard cash that isn't working for you. A slow turnover rate is like a financial anchor, tying up precious capital that should be fueling your growth.
Think of it this way: all that unsold inventory is essentially frozen assets. That's cash you could be pouring into marketing campaigns, developing your next bestseller, or expanding into new markets. The faster you flip that inventory into sales, the more liquid your business becomes. That liquidity gives you the agility to pounce on opportunities and navigate any rough patches that come your way.
Beyond just trapping your cash, that slow-moving stock is actively costing you money every single day. These silent profit killers are called holding costs (or carrying costs), and they can quietly drain your bank account if you're not paying attention.
What do these costs look like? They're a mix of things that add up frighteningly fast:
A healthy turnover rate keeps these costs to a minimum simply because products aren't sitting around long enough to rack up a big bill. This has a direct, positive impact on your gross margins and overall profitability. In fact, most strategies for working capital optimization start right here, with getting a handle on inventory efficiency.
A low inventory turnover ratio is a silent killer of cash flow. It doesn’t just mean sales are slow; it means your business is paying to store products that aren't generating revenue.
To really drive home the financial impact, it helps to look at turnover from a slightly different angle. While the ratio tells you how many times you sell through your stock in a year, a related metric called Days Sales of Inventory (DSI) tells you how many days it takes to do it.
DSI translates the abstract ratio into a concrete timeline. It answers the critical question: "On average, how long does a product sit on my shelf before it's sold?"
The calculation couldn't be simpler:
Days Sales of Inventory (DSI) = 365 / Inventory Turnover Ratio
Let's jump back to our "Cool Tees" online store example. They had an inventory turnover ratio of 4.
This number gives you powerful context. It means "Cool Tees" takes, on average, just over three months to turn its t-shirt inventory into cash. By tracking your DSI, you can set clear, tangible goals to shorten this cash conversion cycle. Doing so directly boosts your financial flexibility and cuts down your need for outside funding to cover day-to-day expenses.
Knowing your inventory turnover ratio is step one. Actually improving it is where the real money is made. A low turnover rate isn't a life sentence—it's a flashing neon sign telling you it's time to take action.
By putting a few targeted strategies into play, you can sell products faster, free up precious cash, and slash the costs of holding onto slow-moving stock. These aren't just theories; they're practical, road-tested tactics that smart businesses use every day to stay lean and efficient. The goal is simple: make better decisions about what you buy, how you price it, and how you get it out the door.
The single best way to improve your turnover? Get better at predicting the future. Accurate demand forecasting lets you order just enough product to keep customers happy without creating a mountain of unsold goods in your warehouse. It’s time to stop guessing and start making purchasing decisions based on cold, hard data.
Start digging into your historical sales data. Look for the obvious patterns:
Understanding what drives your sales allows you to anticipate what's coming next with far greater accuracy. This data-first mindset is the foundation of modern inventory management and your best defense against both overstocking and stockouts.
Honestly, technology has changed the game here. Companies that have embraced advanced analytics and AI for forecasting are miles ahead. Businesses using these tools often see a 10-20% better inventory turnover ratio than those stuck with old-school methods. AI-powered tools help you cut down on excess stock and react way faster when the market shifts.
Forecasting is about planning; control is about execution. You need systems to manage the actual flow of goods, and one of the most famous is the Just-in-Time (JIT) method. With JIT, you order products from suppliers so they arrive right as you need them for production or sales, which means you hold onto as little inventory as possible.
Think of it like a perfectly timed dance between you and your suppliers. Instead of stockpiling inventory, goods arrive exactly when needed. This move alone can slash your holding costs and dramatically reduce the risk of your products becoming obsolete.
But let's be real—JIT demands incredibly reliable suppliers and a flawless supply chain. A more down-to-earth approach for many ecommerce brands is ABC analysis. This is all about categorizing your products based on their value to your business:
This tiered system guarantees you’re spending your time, energy, and capital on the products that actually move the needle.
Even the best planners end up with some duds. Products that just... sit. Letting this "dead stock" collect dust is the fastest way to kill your turnover ratio and lock up your cash. You need a game plan to move it out.
Here are a few tactics that work like a charm:
Don't think of slow-moving inventory as a failure. See it as an opportunity. Every piece of dead stock you clear out is cash you can pour back into products your customers are actually excited to buy.
And don't forget your warehouse operations. Smooth, safe, and efficient handling of goods prevents damage and delays that can sabotage your turnover rate. Beyond just organizing your shelves, think about operational safety. Following basic forklift safety guidelines prevents accidents and disruptions that grind everything to a halt. To learn more about running a tight ship, check out these inventory management best practices.
Even after you’ve got the formulas down, a few common questions always seem to pop up. This section is all about clearing up that confusion. Think of it as a quick-reference guide for the real-world scenarios that business owners run into.
We'll tackle the questions I hear most often, connecting them back to the core ideas we've already covered. The goal is for you to walk away with a complete, confident understanding of how to put this metric to work.
Absolutely. It's a classic case of "too much of a good thing." While a high turnover ratio often points to killer sales and sharp management, a number that's off the charts is usually a red flag. It often means your inventory levels are dangerously low, which leads to the one thing no retailer ever wants to see: a stockout.
When you're constantly running out of your best-sellers, you aren't just losing one sale. You're creating frustrated customers who will happily go to a competitor—and they might not come back. Plus, scrambling to keep up with that demand by placing lots of small, frequent orders can kill your margins with extra shipping and admin costs.
A healthy inventory turnover is a balancing act. You want to sell products fast enough to keep cash flowing and holding costs low, but not so fast that you're constantly out of stock and letting customers down.
It's crucial to look at a high ratio alongside your order fulfillment rates and customer feedback. The sweet spot is a fast turnover that also meets customer demand without a hitch.
Calculating your average inventory is a non-negotiable step. It smooths out the natural highs and lows in your stock levels, giving you a far more accurate baseline for your turnover calculation. Just using a single snapshot in time can be wildly misleading—imagine taking a measurement right after a huge shipment arrived or just after a massive flash sale.
The most common way to do it is simple:
The formula looks like this: (Beginning Inventory + Ending Inventory) / 2 = Average Inventory.
Now, if your business has big seasonal swings—like a swimwear brand that’s dead in the winter or a shop selling holiday decor—you might want to get a little more granular. In that case, you can add up the inventory value from the end of each month and divide the total by twelve. This gives you an even truer average that accounts for all those monthly fluctuations.
Inventory turnover and Days Sales of Inventory (DSI) are really just two sides of the same coin. They look at the exact same process but from different angles, and together, they paint a complete picture of your inventory health.
You actually calculate DSI using your turnover ratio: 365 / Inventory Turnover Ratio = DSI.
Let's say your turnover ratio is 8. That means you're selling through your entire inventory eight times a year. Your DSI would be 45.6 (365 ÷ 8), which means it takes you about 46 days, on average, to turn your stock into cash. One measures frequency, the other measures time.
For the most part, no. Inventory turnover is a metric built from the ground up for businesses that sell physical stuff. Retailers, manufacturers, and wholesalers live and die by this number because their cash is tied up in tangible products sitting on a shelf.
If you run a service-based business—like a consulting firm, a digital marketing agency, or a software company—the traditional concept of inventory turnover doesn't really fit. You don't have a warehouse full of products. Your main assets are your people, your ideas, and your client list.
That said, some service businesses get creative and adapt the concept to track the "turnover" of other things, like project assets or billable hours. But it’s important to know this is an internal metric, not the standard financial ratio you'd use for comparing your business to others.
Managing inventory is one of the most critical skills for scaling an ecommerce brand. For founders looking to master this and other high-level strategies, Million Dollar Sellers offers an exclusive community where the world's top entrepreneurs share what's working right now. Join a network of 7, 8, and 9-figure sellers who are defining the future of ecommerce. Learn more and see if you qualify at https://milliondollarsellers.com.
Join the Ecom Entrepreneur Community for Vetted 7-9 Figure Ecommerce Founders
Learn MoreYou may also like:
Learn more about our special events!
Check Events.svg)
.svg)
.svg)

.svg)