


Stay Updated with Everything about MDS
Thank you! Your submission has been received!
Oops! Something went wrong while submitting the form.
Chilat Doina
November 22, 2025
Inventory turnover is one of those metrics that sounds complicated but is actually pretty simple. It tells you how many times you sell and replace your entire stock of products over a certain period, usually a year.
Think of it as the pulse of your business. It’s a direct measure of how efficiently you're moving products from your warehouse shelves into the hands of your customers. A high number is generally good news—it means sales are strong. A low number, on the other hand, can be a red flag, hinting at weak demand or that you're sitting on way too much inventory.
Let's use an analogy. Imagine your inventory is like water flowing through a pipe. A steady, fast-moving stream is a healthy sign. Products are selling, cash is flowing back into your business, and things are running smoothly. That's a high inventory turnover in action.
But what if that flow slows to a stagnant trickle? That’s a problem. It means products are just sitting there, tying up your capital and risking becoming outdated or obsolete. This is what a low inventory turnover looks like, and it’s often a warning that something deeper is wrong with your operations.
This simple picture gets to the core of what inventory turnover really is: a vital sign for your business. It’s not just some abstract number on a spreadsheet; it’s a real-world reflection of your sales health and how well you’re managing your stock.
Keeping a close eye on your inventory turnover is non-negotiable because it gives you immediate, practical insights into the core of your operations. It helps you understand:
Before we dive deeper, let's quickly summarize these key ideas. This table breaks down the main concepts at a glance.
Ultimately, understanding these concepts is the first step toward using this metric to make smarter decisions for your business.
As a key financial metric, the inventory turnover ratio measures how many times a company's inventory is sold and replaced over a specific period. The benchmarks vary wildly, though. For instance, e-commerce businesses often see higher turnover rates, ranging from 6 to 12 times per year, while many brick-and-mortar stores might see 4 to 6. This gap just shows how much your business model and industry matter. You can find more insights about the inventory turnover ratio at Omneelab.
There's no single "good" turnover rate that works for everyone. A grocery store selling perishable goods needs a lightning-fast turnover, while a dealership selling luxury cars will naturally have a much slower one. The real goal is to figure out what's healthy for your market and then work on improving it.
Knowing what inventory turnover is gets you in the game. But learning how to calculate and track it is how you win. This is where the concept becomes a hard number—a powerful KPI you can use to make smarter, faster decisions for your business.
Let's break down exactly how to do the math.
This whole process is really just about tracking how efficiently products move through your warehouse. They arrive, they get stocked, and they sell. Simple as that.
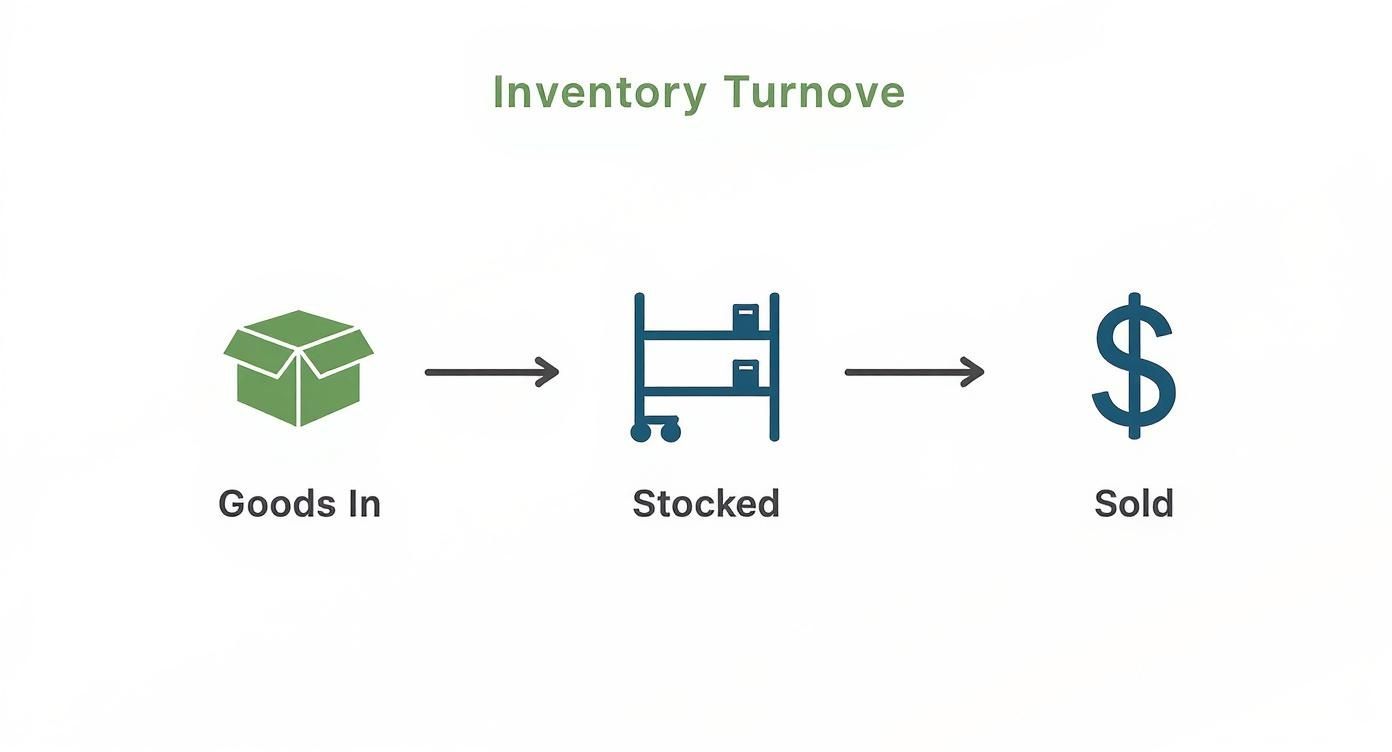
The speed of that journey is what dictates your turnover rate. And your turnover rate dictates your cash flow.
The best and most accurate way to calculate your inventory turnover ratio is by using your Cost of Goods Sold (COGS). This is the gold standard because it compares the cost of your inventory to the cost of the products you sold, giving you a true apples-to-apples view.
The formula is beautifully simple:
Inventory Turnover Ratio = Cost of Goods Sold (COGS) / Average Inventory
To get this done, you'll need just two numbers from your financial statements:
(Beginning Inventory + Ending Inventory) / 2.Why use an average? Because it smooths out the bumps. It accounts for seasonal peaks or big one-off purchase orders, giving you a much more realistic picture of your typical inventory levels. For a deeper dive, you can learn more about how to calculate your inventory turnover ratio and apply it.
What if you don't have a clean COGS figure handy? It happens, especially for smaller businesses or those with simpler accounting systems. In that case, you can fall back on a formula that uses your total sales revenue instead.
Here's what that looks like:
Inventory Turnover Ratio = Net Sales / Average Inventory
While it's definitely easier to calculate, this method is less accurate. The problem is that it compares your sales revenue—which includes your profit margin—to the cost of your inventory. This mismatch can artificially inflate your turnover ratio, making it look like you're selling inventory faster than you actually are. It works in a pinch, but use it with a grain of salt.
Let's make this real. Imagine you run an e-commerce store selling high-end coffee beans. You want to figure out your inventory turnover for the last year, so you pull these numbers from your books:
First, you need to find your average inventory for the year.
Now, plug that number into the standard COGS formula:
What does that mean? Your coffee business sold through and replaced its entire inventory 6 times over the course of the year. That single number is your baseline, a starting point for asking much deeper questions.
Your turnover ratio of 6 is great, but what does it mean for your day-to-day operations? That's where Days Sales of Inventory (DSI) comes in. This metric, also called Days of Inventory on Hand, tells you the average number of days it takes to sell through your stock.
The DSI formula is another simple one:
Days Sales of Inventory (DSI) = 365 Days / Inventory Turnover Ratio
Let's use our coffee shop example, which had a turnover ratio of 6:
This tells you that, on average, a bag of coffee sits on your shelf for about 61 days before a customer buys it. DSI is an incredible tool for spotting trouble early. If you see that number start creeping up month after month, it's a huge red flag that inventory is moving too slowly, tying up your cash and racking up holding costs.
So you’ve calculated your inventory turnover ratio. You've got a number. But what's the story that number is telling you? Is it a sign of a healthy, efficient operation, or is it a warning of hidden problems lurking in your warehouse?
The answer isn't a simple "high is good, low is bad." It's all about finding the right balance for your specific business.
Think of it like Goldilocks tasting porridge. A ratio that’s too low means your inventory is sitting around for way too long, tying up cash and collecting dust. But a ratio that’s too high can be just as dangerous—it’s a major red flag that you might be running out of stock and leaving sales on the table. The real goal is to find the ratio that’s just right.
Nailing this sweet spot is how you turn your inventory from a potential liability into one of your most powerful assets.
A low inventory turnover ratio is a clear sign that your products are moving way too slowly. This might not seem like a big deal at first, but it creates a whole cascade of costly problems that quietly drain your resources and eat away at your profits.
When inventory just sits, it's not just taking up shelf space; it's actively costing you money. Every single day an item remains unsold, you're paying for:
Ultimately, a consistently low turnover ratio points to deeper issues. It could be poor demand forecasting, ineffective marketing, or a fundamental mismatch between what you're selling and what your customers actually want.
At first glance, a super-high turnover ratio looks like the dream. Products are flying off the shelves, sales are through the roof, and nothing is sitting for long. While this is often a great sign, an excessively high ratio can mask some pretty significant risks.
If your turnover is extremely high, it might mean you're under-stocking and simply don't have enough inventory to keep up with customer demand. This leads directly to stockouts, which are far more damaging than most brands realize.
A stockout isn't just one lost sale. It can frustrate customers who might never come back, damage your brand's reputation, and even hurt your search rankings on platforms like Amazon.
Finding the right balance is about keeping enough stock on hand to satisfy demand without tying up too much of your capital. It’s a delicate dance, but getting it right is absolutely crucial for sustainable growth.
So, what exactly is a "good" inventory turnover ratio? It depends entirely on your industry. A ratio of 4 might be fantastic for a furniture store but a total disaster for a grocery business selling perishable goods.
Historically, this ratio has been a critical health indicator for supply chains. For instance, companies in fast-moving consumer goods (FMCG) often shoot for ratios between 6 and 12 to keep waste to a minimum. On the other hand, businesses selling high-ticket items like electronics or luxury goods might have lower ratios, often around 2 to 4, because of their longer sales cycles.
One real-world example saw an electronics retailer improve its turnover from a stressful 2.5 to a much healthier 4.5 in just six months by implementing better forecasting. This simple change freed up a ton of capital and boosted their revenue by 15%. It just goes to show how a data-driven approach can make a massive difference. You can dive deeper into how inventory turnover reflects business sustainability over at Sortly.
Here’s a quick look at typical turnover rates across different ecommerce sectors:
Use these numbers as a starting point, but always benchmark against your direct competitors for the most accurate picture. Your goal isn't just to hit the average; it's to understand where you stand and constantly work to optimize your position.
Your inventory turnover ratio isn't just some abstract operational metric; it’s a direct pipeline to your company's financial health. It measures how fast you turn your biggest asset—your inventory—into cold, hard cash. Nailing this connection is the key to unlocking hidden profits and building a business that lasts.
Think of your inventory as stacks of cash sitting on warehouse shelves. When that inventory moves slowly, your cash is literally frozen in place. But when it moves quickly, you create a powerful cycle, constantly freeing up capital to put back to work growing the business.

A healthy turnover rate means you can pay suppliers on time, pour money into new marketing campaigns, or expand your product line without taking on debt. It's about transforming a static asset into dynamic working capital that fuels your ambitions.
Let's make this real. Imagine a direct-to-consumer (DTC) brand with $100,000 in average inventory and an annual COGS of $300,000. Simple math tells us their inventory turnover ratio is 3. They sell through their entire stock three times a year.
Now, what happens if they get smarter with their forecasting and dial in their marketing to boost that turnover to 5?
With a turnover of 3, their inventory sits on the shelves for about 122 days (365 / 3). By cranking the turnover up to 5, that number plummets to just 73 days (365 / 5). That 49-day improvement is huge. It means they need far less cash tied up in inventory at any given moment to generate the same sales. That freed-up capital is significant, letting them reinvest in growth instead of storage.
By improving turnover, the business effectively gives itself a cash injection without taking on debt. This newfound liquidity can be the difference between stagnating and scaling.
This is a perfect example of how a seemingly small tweak to an operational metric can create a massive financial advantage. It’s the fuel you need for expansion.
The table below breaks down the real-world consequences of both slow and fast turnover across different parts of your business.
As you can see, the ripple effects of your turnover rate touch everything from your bank account to your brand's reputation.
A low inventory turnover quietly bleeds your profits through holding costs. These are the persistent, often-ignored expenses that come with storing unsold goods. The longer a product sits, the more it costs you. Plain and simple.
And these hidden fees go way beyond just the warehouse rent. They include a whole range of expenses that add up fast:
Industry experts estimate these holding costs can represent 20-30% of your inventory's value every single year. A slow turnover inflates these expenses, silently eating away at your profit margins day after day.
Finally, a strong inventory turnover is your best defense against margin erosion. When products sit for too long, the pressure to just get rid of them builds. This anxiety often leads to a vicious cycle of discounting and clearance sales just to move the stock.
While a quick sale can provide a short-term cash boost, relying on deep markdowns is a terrible long-term strategy. It absolutely destroys your profitability. Every dollar you discount is a dollar taken directly from your gross margin.
By maintaining a healthy turnover rate, you sell more products at full price. This not only maximizes your revenue but also strengthens your brand's value by avoiding the reputation of being a company that's constantly "on sale." Fast-moving inventory is profitable inventory, ensuring you capture the full value for every single item you sell.
Knowing your inventory turnover ratio is just the starting line. The real money is made when you use that number to make smarter decisions for your business. Boosting your turnover isn't about guesswork—it's about putting targeted, data-driven strategies into play that sync up what you buy with what your customers actually want.
Getting this right has a direct impact on your cash flow, cuts down on waste, and gives you a serious competitive edge. The goal here is to stop thinking of inventory as a static cost sitting on a shelf and start treating it like a dynamic, profit-generating asset.
Let's dig into the hands-on tactics you can use to make that happen.
Good demand forecasting is the bedrock of solid inventory management. When you can confidently predict what customers will buy and when, you can order just enough to meet that demand—without sinking your capital into products that just sit there. It’s the difference between proactive planning and constantly scrambling to react.
Start by digging into your historical sales data. You’re looking for obvious patterns related to things like:
Modern inventory software can automate a ton of this analysis for you, using your past data and even AI to spit out much more accurate forecasts. The better you get at predicting, the leaner and more responsive your inventory can become.
The Just-In-Time (JIT) inventory model is a lean strategy all about receiving goods from your suppliers only as you need them to fulfill customer orders. Instead of holding huge amounts of "just-in-case" stock, you coordinate tightly with suppliers so products arrive right on schedule.
The upside is huge: you slash your holding costs because you're not paying to store mountains of inventory. The catch? JIT demands an incredibly reliable and efficient supply chain. One hiccup from a supplier can mean instant stockouts. That’s why building rock-solid relationships with dependable partners is an absolute must before you even think about this strategy. For many brands, overcoming common inventory management challenges is the first hurdle to clear on the path to a working JIT system.
So, what do you do about the products that are already on your shelves gathering dust? Slow-moving or obsolete inventory is a massive drag on your turnover ratio and your bottom line. Strategic pricing is your best weapon for clearing it out and freeing up that frozen capital.
Think about running plays like:
The key is to be proactive. Don't wait until a product has been sitting for a year to do something about it. Regularly identify your slowest-moving SKUs—what some sellers call "duds" or "sleepers"—and build a plan to liquidate them before they become a total loss.
This move not only pumps up your turnover ratio but also clears physical space for new, more profitable products.
Sometimes, a product isn't selling for a simple reason: nobody knows about it. Before you jump to heavy discounting, take a hard look at your marketing. Is a specific product line underperforming because it's buried on your website or never gets mentioned in your email campaigns and social media?
A simple shift in your marketing focus can breathe new life into struggling products. Feature them on your homepage, create targeted ad campaigns around their unique benefits, or produce content that shows customers why they need it. A little boost in visibility can be all it takes to kickstart sales and improve turnover without crushing your margins.
At the end of the day, a leaner supply chain almost always leads to faster inventory turnover. The time it takes from placing an order with a supplier to it arriving at your warehouse is known as lead time. The longer your lead times, the more safety stock you're forced to carry to avoid stockouts, which naturally drags your turnover ratio down.
Work with your suppliers to see where you can shorten those lead times. Maybe that means finding more local sources, negotiating faster shipping, or using tech to automate your reordering process. Even shaving a few days off your lead time can make a significant difference in how much inventory you need to keep on hand. For a more complete playbook, it's worth exploring these 10 actionable inventory management best practices to build a well-rounded system. By making your supply chain more efficient, you build a more agile—and more profitable—business.
Relying on a clunky spreadsheet to track your stock is like navigating with a paper map in the age of GPS. It might get you there, but it’s slow, outdated, and prone to disaster. Today's businesses are tossing the spreadsheets and embracing technology to get a serious leg up on the competition.
The future of inventory management isn’t just about counting what you have—it's intelligent, automated, and woven into every part of your operation. This shift is all about using sophisticated tools that help you predict what customers will want tomorrow, not just what they bought yesterday. Getting this right is how you achieve the kind of turnover rates that were once pure fantasy.
The engine driving this change? Artificial Intelligence (AI) and good old-fashioned automation. AI-powered forecasting tools can chew through your historical sales data, spot market trends, and even account for things like upcoming holidays to predict demand with scary accuracy. This means you can finally order precisely what you need, right when you need it.
But these systems don't just predict; they act. You can set up automated reordering to fire off a purchase order the second your stock hits a pre-set minimum. This takes human error—the main culprit behind stockouts and overstocking—out of the equation, ensuring a smooth, continuous flow of your best-sellers.
For anyone looking to take that first step, digging into the best inventory management software for small business is the place to start.
Modern inventory systems give you something priceless: a single source of truth. They offer real-time visibility into your stock levels across every single place you sell—your website, Amazon, a pop-up shop, you name it. This unified view is the only way to prevent the dreaded oversell that kills customer trust.
This complete visibility allows you to make smarter, data-driven decisions on the fly. You can confidently launch a flash sale or pivot your marketing strategy, knowing your inventory numbers are rock-solid and can back you up.
This level of insight transforms inventory from a logistical headache into a strategic asset. You can dynamically manage your stock, shifting products to where they’re needed most to squeeze every last drop of value out of your turnover.
Of course, benchmarks for inventory turnover are all over the map, reflecting different business models and supply chains. In the tech world, for instance, a giant like Nvidia might hold around 92 days of inventory, while a leaner company like Broadcom keeps just 36 days. These numbers show just how critical it is to tailor your inventory strategy to balance supply with demand and stay sharp in a fast-moving market. You can see more on how turnover rates differ across global industries on MacroMicro.
After digging into the formulas and strategies, a few key questions always seem to pop up. Let's tackle them head-on so you can feel confident putting this all into practice.
Absolutely. While a high turnover ratio usually points to healthy sales, an extremely high number can be a major red flag. It often means you’re cutting it too close with your stock levels and are constantly on the verge of selling out.
Stockouts are a killer. They don't just frustrate customers and send them to your competitors; they can also wreck your brand's reputation for reliability and even damage your search rankings on platforms like Amazon. The goal isn’t just to sell fast—it's to find that sweet spot that keeps up with demand without leaving easy money on the table.
The standard textbook answer is to calculate inventory turnover annually, which is useful for year-over-year comparisons. But in the fast-moving world of ecommerce, waiting a full year is like driving while looking in the rearview mirror. You'll miss every turn.
For a real pulse on your business, you should be tracking this quarterly, if not monthly.
Think of it this way: frequent calculation turns a historical report card into a forward-looking GPS. If you spot your turnover rate dipping for a few months straight, you can dive in and fix the problem before it snowballs into a serious cash flow crisis.
If your turnover ratio is looking sluggish, your first move should always be to diagnose before you prescribe. Resist the knee-jerk reaction to slash prices across the board. The real first step is to perform an ABC analysis to figure out exactly what isn't selling.
This method helps you segment your inventory and shine a spotlight on your "C-grade" items—the dust-collectors that are hogging warehouse space and tying up your cash. Once you've identified these problem SKUs, you can get surgical with your solution, like creating targeted promotions or smart product bundles to move them out. It’s a much smarter way to fix the issue without devaluing your entire brand.
At Million Dollar Sellers, our members don't just talk theory; they share field-tested strategies for mastering everything from inventory velocity to supply chain logistics. If you're ready to learn from an elite community of 7, 8, and 9-figure founders, it's time to see what you're missing. Learn more at https://milliondollarsellers.com.
Join the Ecom Entrepreneur Community for Vetted 7-9 Figure Ecommerce Founders
Learn MoreYou may also like:
Learn more about our special events!
Check Events.svg)
.svg)
.svg)

.svg)