


Stay Updated with Everything about MDS
Thank you! Your submission has been received!
Oops! Something went wrong while submitting the form.
Chilat Doina
December 24, 2025
In the hyper-competitive world of e-commerce, top-line revenue is only half the story. The real moat for high-growth sellers is built in the back-end through relentless operational efficiency. While flashy marketing campaigns grab headlines, sustainable profitability is forged in warehouses, production lines, and logistics networks. This requires moving beyond vanity metrics and embedding a data-driven culture focused on the right Key Performance Indicators (KPIs). For any brand scaling past seven figures, a deep understanding of your operational performance isn't just helpful; it's a fundamental requirement for survival and dominance.
This guide cuts through the noise to provide a definitive roundup of the 10 most critical KPIs for operations. We will break down each metric with clear formulas, ideal benchmarks for both DTC and Amazon sellers, and common pitfalls to avoid. More importantly, we will provide actionable steps to track these metrics in your dashboards and turn raw data into a powerful competitive advantage that scales with your business. Mastering each kpi for operations detailed here will empower you to optimize inventory, streamline production, and enhance customer satisfaction, directly impacting your bottom line. As technology continues to reshape logistics and fulfillment, applying a data-centric approach is crucial. To delve deeper into the strategic advantages, consider exploring comprehensive AI and ecommerce insights that cover practical AI strategies and real-world applications for growth. Let's dive into the metrics that separate the good from the great.
Overall Equipment Effectiveness (OEE) is a powerful KPI for operations that measures manufacturing productivity. It provides a holistic view by evaluating three critical factors: Availability, Performance, and Quality. The resulting score, represented as a percentage, reveals how much of your planned production time is genuinely productive. A score of 100% signifies perfect production with zero downtime, slowdowns, or defects.
Pioneered by Seiichi Nakajima as part of the Total Productive Maintenance (TPM) methodology, OEE is the gold standard for identifying efficiency losses. It helps ecommerce brands with in-house manufacturing or assembly operations pinpoint exactly where and why production falls short, making it an indispensable diagnostic tool.
OEE synthesizes three sub-metrics into a single, comprehensive score.
OEE = Availability × Performance × QualityRun Time / Planned Production Time.(Ideal Cycle Time × Total Count) / Run Time.Good Count / Total Count.Your primary data sources will be your Manufacturing Execution System (MES), Enterprise Resource Planning (ERP) software, or even manual production logs.
Begin by establishing a clear baseline before launching any improvement efforts. This initial measurement is crucial for tracking progress.
First Pass Yield (FPY) is a critical KPI for operations that directly measures production quality and efficiency. It calculates the percentage of units completed to specification on the first attempt, without needing any rework, repairs, or scrapping. A high FPY signifies a stable, high-quality, and cost-effective production process, as it minimizes wasted materials, time, and labor.

Popularized by Six Sigma and ISO 9001 quality management frameworks, FPY is a powerful indicator of your operational health. For ecommerce brands managing production, tracking FPY reveals hidden costs and inefficiencies that erode profit margins. It's the ultimate measure of getting things "right the first time."
FPY offers a straightforward look at initial quality output before any corrective actions are taken.
FPY = (Total Units Produced - Defective Units) / Total Units ProducedFor example, if you produce 1,000 units and 50 are found to be defective, your FPY is (1000 - 50) / 1000, which equals 95%.
FPY data is typically gathered from your Quality Management System (QMS), Manufacturing Execution System (MES), or through manual inspections and production logs at key stages.
Start by identifying the critical production steps where defects are most likely to occur and begin measuring FPY there.
Overall Labor Productivity is a fundamental KPI for operations that measures the efficiency of your workforce. It quantifies the output generated per hour of labor, providing a clear window into how effectively your team's time is converted into tangible results. For ecommerce brands, this metric is crucial for managing labor costs, a significant component of operational expenses in fulfillment, customer service, and production.
Popularized by lean manufacturing pioneers like W. Edwards Deming and the Toyota Production System, this KPI helps organizations understand the true value generated by their human capital. Tracking it allows you to make informed decisions about staffing, process improvements, and automation investments, directly impacting your operational margins and scalability.
The calculation for Overall Labor Productivity is straightforward, focusing on the ratio of output to labor input.
Labor Productivity = Total Output / Total Labor HoursFor example, if your fulfillment center shipped 2,000 orders in a week and your team worked a combined 400 hours, your labor productivity would be 5 orders per hour.
Your primary data sources will be your Warehouse Management System (WMS), time tracking software, payroll records, and order management system (OMS).
Start by accurately tracking all labor hours, separating productive time from paid time off, breaks, and administrative tasks to get a clean baseline.
On-Time Delivery (OTD) is a fundamental KPI for operations that measures the percentage of orders delivered to the customer within the promised timeframe. It is a direct indicator of supply chain efficiency and a cornerstone of customer satisfaction. For ecommerce brands, where the delivery experience is a key touchpoint, a high OTD rate builds trust and encourages repeat business, while a low rate can quickly damage brand reputation.
This metric is heavily promoted by logistics giants like Amazon and DHL, who have set the modern standard for fast, reliable shipping. OTD is a critical measure of your operational promise to the customer. It reflects the effectiveness of your entire fulfillment process, from order processing and warehouse operations to last-mile logistics.

OTD is a straightforward percentage that compares successful on-time deliveries against total deliveries.
OTD = (Number of On-Time Orders / Total Number of Orders Delivered) × 100Your primary data sources will be your Order Management System (OMS), Warehouse Management System (WMS), and carrier tracking data from partners like FedEx, UPS, or USPS.
Start by clearly defining what "on-time" means for your business. Does it mean delivery by the end of the promised day, or within a specific time window? Consistency is key.
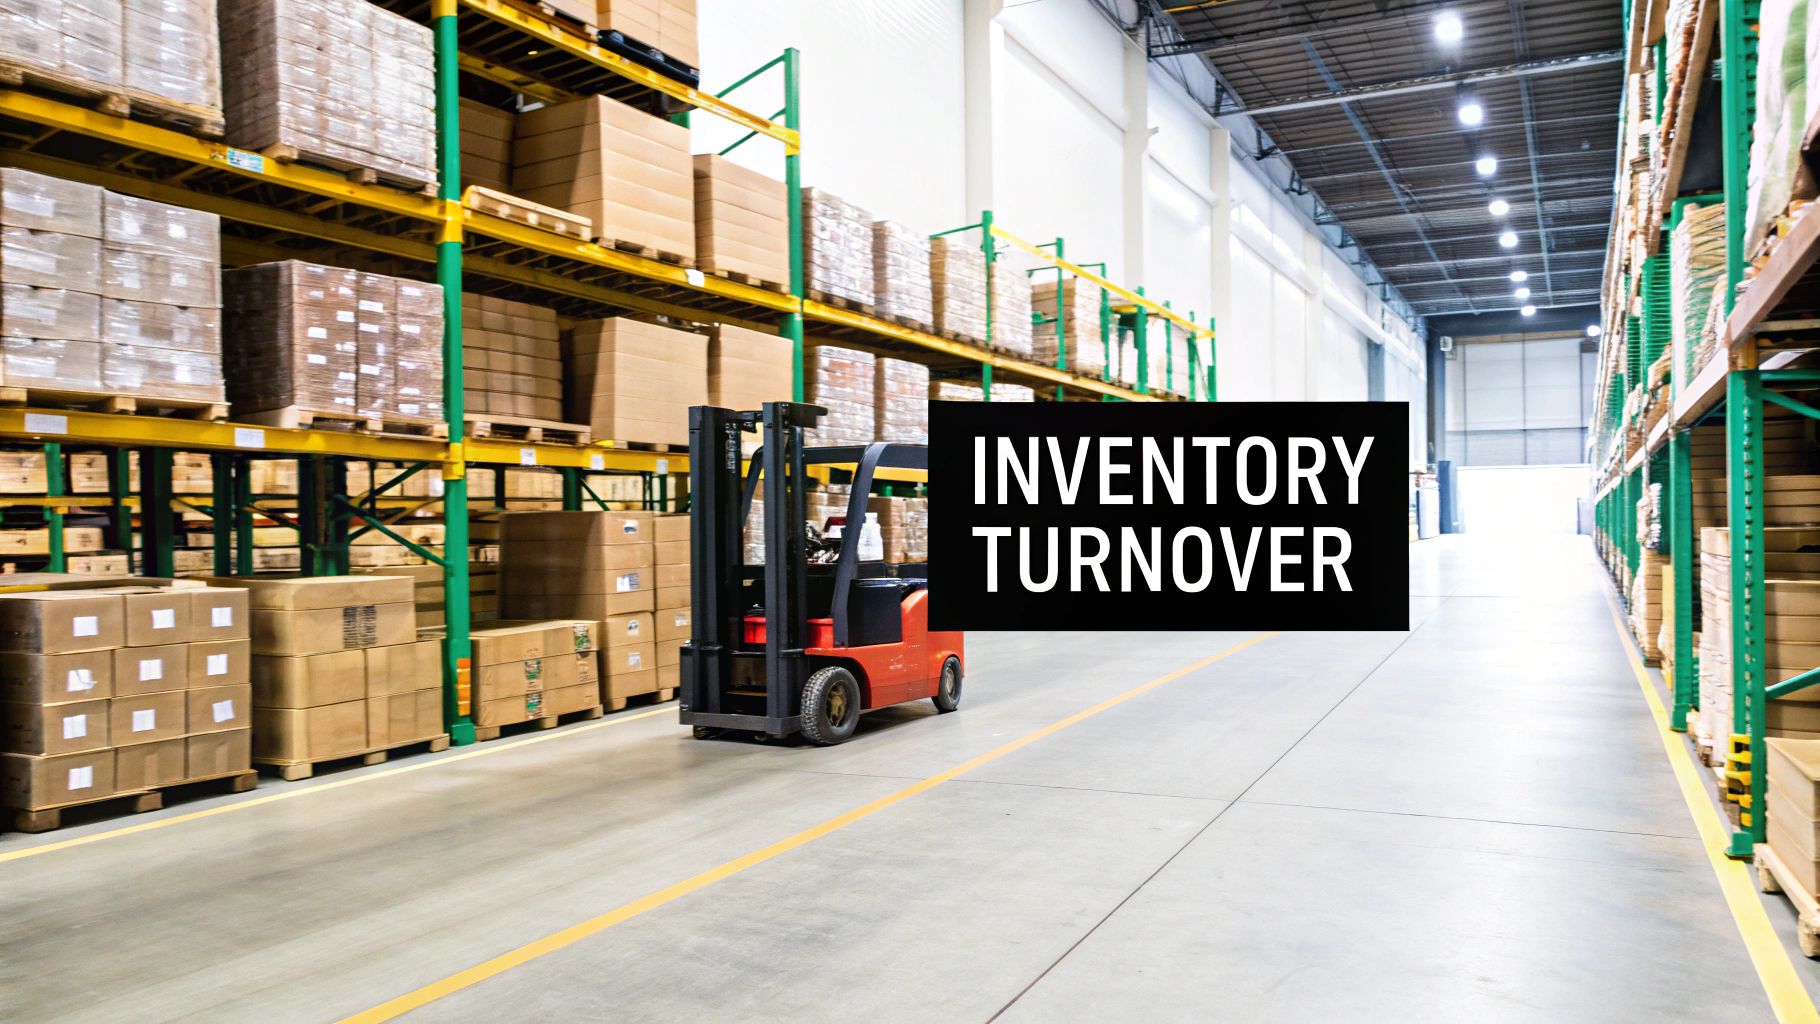
The Inventory Turnover Ratio is a critical financial and operational KPI that measures how many times a company sells and replaces its inventory over a specific period. It provides a clear indication of sales velocity and inventory management efficiency. A higher ratio generally suggests strong sales and effective inventory control, while a low ratio can signal overstocking, obsolete inventory, or poor sales performance.
Popularized by retail giants like Walmart and Amazon, and a core concept in lean manufacturing, this metric is fundamental for any ecommerce brand. It directly impacts cash flow and profitability, as inventory represents a significant portion of working capital. Efficiently managing this turnover is a key lever for operational excellence.
This ratio compares the cost of goods sold (COGS) to the average inventory value, revealing how efficiently inventory is converted into sales.
Inventory Turnover = Cost of Goods Sold / Average Inventory Value(Beginning Inventory + Ending Inventory) / 2.Your primary data will come from your balance sheet and income statement, typically housed in your accounting software (like QuickBooks or Xero) or ERP system.
Start by calculating your baseline turnover ratio for the last 12 months. This initial figure will be your benchmark for all future improvement efforts. For a deeper understanding, explore these advanced inventory management best practices.
Overall Equipment Downtime is a critical KPI for operations that quantifies the total time a piece of equipment is not in service. By splitting this metric into planned (e.g., scheduled maintenance, changeovers) and unplanned (e.g., unexpected breakdowns, material shortages) categories, you gain deep insights into the reliability and health of your production assets. The goal is to minimize unplanned downtime, which disrupts schedules and inflates costs, while optimizing planned downtime for maximum efficiency.
This KPI is essential for any ecommerce brand with manufacturing or significant assembly operations. It moves beyond simply knowing a machine is down; it forces you to analyze why it's down. This distinction is the foundation of proactive maintenance strategies like Total Productive Maintenance (TPM) and Reliability-Centered Maintenance (RCM), which aim to prevent failures before they happen.
Calculating downtime as a percentage of total available time provides a clear view of its impact. The real value comes from segmenting the total.
Downtime % = (Total Downtime Hours / Total Available Hours) × 100For example, if a packaging machine has 400 available hours in a month and experiences 8 hours of planned maintenance and 12 hours of unexpected breakdowns, its total downtime is 20 hours, or 5%. Crucially, 60% of that downtime was unplanned.
Data is typically captured through a Manufacturing Execution System (MES), Computerized Maintenance Management System (CMMS), or detailed operator logs.
Start by accurately logging all downtime events and categorizing them as either planned or unplanned. This initial data collection is your baseline.
Cost Per Unit (CPU) is a fundamental KPI for operations that quantifies the total expense incurred to produce a single item. It provides a granular view of your production efficiency by rolling up all associated costs, including direct materials, direct labor, and manufacturing overhead, into a single, per-unit figure. Tracking CPU is essential for pricing strategies, profitability analysis, and identifying cost-saving opportunities.
Popularized by management accounting pioneers and integral to lean manufacturing, CPU serves as a direct measure of your operational health. For ecommerce brands, a firm grasp on this metric is critical for protecting margins, especially when dealing with volatile raw material prices or competitive pressures. It reveals the true cost of bringing a product to life, moving beyond just the bill of materials.
CPU aggregates all production-related expenses and divides them by the number of units produced over a specific period.
CPU = Total Operating Costs / Total Units ProducedYour primary data sources will be your Enterprise Resource Planning (ERP) system, accounting software (like QuickBooks or Xero), and production logs.
Start by clearly defining what costs are included in your "Total Operating Costs" to ensure consistent tracking. This baseline is your starting point for all improvement efforts.
Process Cycle Time is a fundamental KPI for operations that measures the total elapsed time from the beginning of a process to its end. This includes both value-added time (when work is actively being done) and non-value-added time (such as waiting, transport, or inspection). It offers a clear window into your operational velocity and efficiency, showing how quickly you can turn inputs into outputs.
Popularized by Lean manufacturing and the Theory of Constraints, this metric is crucial for any ecommerce brand looking to improve throughput and customer satisfaction. Whether it's the time from order placement to shipment or from raw material intake to finished good, reducing cycle time directly correlates with lower costs, increased capacity, and faster delivery to your customers.
Process Cycle Time is a direct measurement of duration, but it's often analyzed alongside Little's Law to understand process dynamics.
Process Cycle Time = Process End Time - Process Start TimeWIP = Throughput × Cycle Time. This shows how reducing cycle time can increase throughput without adding more inventory.Data can be pulled from your Warehouse Management System (WMS), ERP, or through manual time studies and process mapping exercises.
Start by clearly defining the start and end points of the process you want to measure. Ambiguity here is a common pitfall that skews data.
Schedule Compliance, often called Production Schedule Attainment, is a critical KPI for operations that measures how effectively a production team follows its planned schedule. It evaluates the ability to complete a planned volume of work within a specific timeframe, directly reflecting an organization's reliability and its capacity to meet internal and external commitments. For ecommerce brands, high schedule compliance ensures products are ready for fulfillment, preventing stockouts and backorders.
This metric is a cornerstone of effective production management, heavily advocated within frameworks like the Supply Chain Council's SCOR model and by Advanced Planning Systems (APS) software vendors. It moves beyond just measuring output; it measures the predictability and stability of your entire manufacturing or assembly process, which is essential for scaling operations.
This KPI provides a clear percentage score representing adherence to the production plan.
Schedule Compliance = (Actual Output / Planned Output) × 100For example, if your plan was to assemble 1,000 units of a product in a week and you successfully completed 950, your schedule compliance would be 95%.
Data is typically pulled from your Enterprise Resource Planning (ERP) or Manufacturing Execution System (MES), which houses both the production schedule and the actual output records.
Start by ensuring your production planning is realistic and accounts for known constraints. Unattainable schedules will always result in poor compliance scores.
Return on Assets (ROA) is a financial KPI for operations that measures how efficiently a company's assets are used to generate profit. It reveals the profitability of a business relative to its total asset base, answering the critical question: "How much profit are we generating for every dollar invested in assets?" Paired with Asset Utilization, which measures pure output, it provides a comprehensive view of capital efficiency.
For asset-heavy ecommerce brands, such as those with significant investments in warehouses, automation, or delivery fleets, these metrics are vital. They help justify capital expenditures and ensure that expensive operational investments are delivering a tangible return. For instance, logistics companies constantly track these metrics to optimize their fleets and achieve industry-leading ROA.
ROA and Asset Utilization are complementary, assessing profitability and productivity, respectively.
Return on Assets = Net Income / Total AssetsAsset Utilization = Total Revenue (or Output) / Total Asset ValueYour primary data will come from your financial statements (balance sheet and income statement) and your Enterprise Resource Planning (ERP) or asset management system.
Start by calculating your baseline ROA and Asset Utilization rate to understand your current performance before making changes.
Metric🔄 Implementation complexity⚡ Resource requirements📊 Expected outcomes💡 Ideal use cases⭐ Key advantagesOverall Equipment Effectiveness (OEE)OEE = Availability × Performance × QualityHigh — needs integrated machine data & correct calculationsHigh — sensors, MES/SCADA, analytics, real-time dashboardsImproved overall productivity; targeted loss reductionDiscrete/manufacturing lines, TPM and lean programs⭐ Holistic equipment performance view with actionable loss breakdownFirst Pass Yield (FPY)FPY = (Units − Defect Units) / Total Units × 100Low — simple counts at inspection pointsLow — inspection, quality tracking systemsReduced rework/scrap; clearer quality baselineHigh-precision manufacturing (semiconductor, medical)⭐ Easy-to-understand quality metric; highlights true first-pass qualityOverall Labor Productivity<br=Total Output / Total Labor Hours>Medium — needs normalized output and time trackingMedium — timekeeping, HR data, output measurementBetter staffing decisions; higher throughput per labor hourWarehouses, distribution centers, labor-intensive plants⭐ Direct link between labor input and operational outputOn-Time Delivery (OTD)OTD = (On-Time Deliveries / Total Deliveries) × 100Low — straightforward but requires integrated order/delivery dataMedium — TMS/ERP integration, logistics trackingHigher customer satisfaction and retentionLogistics, e‑commerce, JIT suppliers⭐ Customer-facing KPI; easy to communicate and benchmarkInventory Turnover RatioTurnover = COGS / Avg. InventoryMedium — depends on consistent valuation methodsMedium — inventory systems, accurate COGS reportingImproved cash flow and lower carrying costsRetail, fast-moving consumer goods, perishable goods⭐ Signals demand accuracy and working‑capital efficiencyOverall Equipment Downtime (Planned vs Unplanned)Downtime% = Downtime Hours / Available Hours × 100High — requires precise categorization and loggingHigh — CMMS, condition monitoring, maintenance dataReduced unplanned outages; better maintenance planningContinuous process industries, critical assets (refineries, data centers)⭐ Differentiates planned vs unplanned to prioritize reliability workCost Per Unit (CPU)CPU = Total Operating Costs / Units ProducedMedium — requires comprehensive cost allocation (ABC recommended)Medium — accounting systems, cost-driver dataClearer unit profitability; supports pricing & make/buy decisionsCost-sensitive manufacturing, bid-based suppliers⭐ Direct measure of unit cost for pricing and cost-reduction focusProcess Cycle TimeMedium — needs end-to-end timing and value-stream mappingMedium — data capture across steps, mapping toolsShorter lead times; bottleneck identificationService processes, assembly lines, TOC/lean initiatives⭐ Reveals non-value-added time to target process improvementsSchedule Compliance (Production Schedule Attainment)Compliance% = Actual / Planned × 100Medium — requires planning vs actual comparison and constraints modelingMedium — APS/ERP, production reportingImproved execution and production reliabilityMake-to-order, JIT environments, coordinated supply chains⭐ Measures execution discipline and planning accuracyReturn on Assets (ROA) & Asset UtilizationROA = Net Income / Total AssetsUtilization = Output / Asset ValueMedium — aligns financial and operational data; depreciation effectsMedium–High — financial systems, asset registers, utilization trackingBetter capital efficiency and investment decisionsCapital-intensive industries (airlines, heavy manufacturing)⭐ Connects asset use to shareholder returns; informs capex and redeployment decisions
We've explored a comprehensive roundup of the most critical KPIs for operations, from the granular efficiency of Overall Equipment Effectiveness (OEE) and First Pass Yield (FPY) to the high-level financial health indicators like Return on Assets (ROA). Each metric, from Inventory Turnover to On-Time Delivery, offers a unique lens through which to view your ecommerce business. But simply knowing the definitions and formulas is only the first checkpoint in a much longer race.
The real transformation begins when you move from passive data collection to active, intelligent application. The ultimate goal isn't just to have a dashboard full of green numbers; it’s to build a self-reinforcing cycle of improvement, an operational flywheel that gains momentum with every data point analyzed and every process optimized. This is where top-tier brands separate themselves from the competition.
Tracking every KPI for operations from day one is a recipe for analysis paralysis. Instead, adopt a phased, strategic approach to implementation that aligns with your current business priorities and challenges.
For high-growth sellers on Amazon and DTC platforms, operational excellence isn't a one-time project; it's a deeply embedded part of the company culture. It's the relentless pursuit of making things better, faster, and more cost-effective. A crucial element of achieving market dominance is implementing data-driven growth strategies that translate raw insights into tangible results. This means empowering your team to not just report the numbers but to own them.
Key Takeaway: Celebrate the wins when a KPI improves, but more importantly, diagnose the shortcomings without blame. Frame a drop in On-Time Delivery not as a failure, but as an opportunity to find a hidden bottleneck in your fulfillment process. Encourage experimentation and give your team the autonomy to test new solutions. This cultural shift is the secret ingredient that transforms a good operations team into a world-class one.
By integrating this select group of kpi for operations into your daily, weekly, and monthly DNA, you are doing far more than just improving efficiency. You are building a resilient, scalable, and fundamentally more valuable ecommerce asset. You are creating a business that can withstand market shocks, capitalize on growth opportunities, and consistently delight customers. This is how you move from merely tracking data to achieving true market dominance.
Ready to learn how the world's most successful Amazon sellers leverage their operational data to scale past 7 and 8 figures? Join Million Dollar Sellers, an exclusive, vetted community where elite entrepreneurs share the exact strategies, SOPs, and dashboards they use to master their operations. Connect with peers who have already solved the challenges you're facing today. Apply to join Million Dollar Sellers and turn your operational data into your biggest competitive advantage.
Join the Ecom Entrepreneur Community for Vetted 7-9 Figure Ecommerce Founders
Learn MoreYou may also like:
Learn more about our special events!
Check Events.svg)
.svg)
.svg)

.svg)