
Chilat Doina
November 17, 2026
Amazon reported $109.074 billion in fulfillment costs for 2025, against $98.505 billion in 2024, in its 2025 Form 10-K filed with the SEC. That number buys the delivery promise your listing leans on, and every seller pays into it through fees on units, storage, and returns.
Operations in Amazon, viewed from a brand rather than from Seattle, is the weekly system that puts the right units in the right building, hits the speed the listing promises, and keeps the account eligible to sell. Ads sit on top of that system. When the system slips, you lose the order, the rank the order would have defended, and the ad spend that sent a shopper to an out-of-stock page.
Five areas make up that system: demand and inventory, inbound and placement, fulfillment mode, account and catalog health, and cash tied to fees and stock. Each has a weekly job, one metric worth watching, and a predictable first failure. Everything else in this piece hangs off those five.
Shoppers treat two-day delivery as the baseline and same-day as a bonus. Amazon spent two decades building the machine that made that normal, moving from rented carrier capacity into its own warehousing, sortation, transportation, delivery vans, aircraft, and package routing, a build-out traced in Business Insider's timeline of Amazon's logistics arm. That network turned fast, trackable delivery into the core of the marketplace's customer proposition, and it means the platform prices speed into every order you sell.
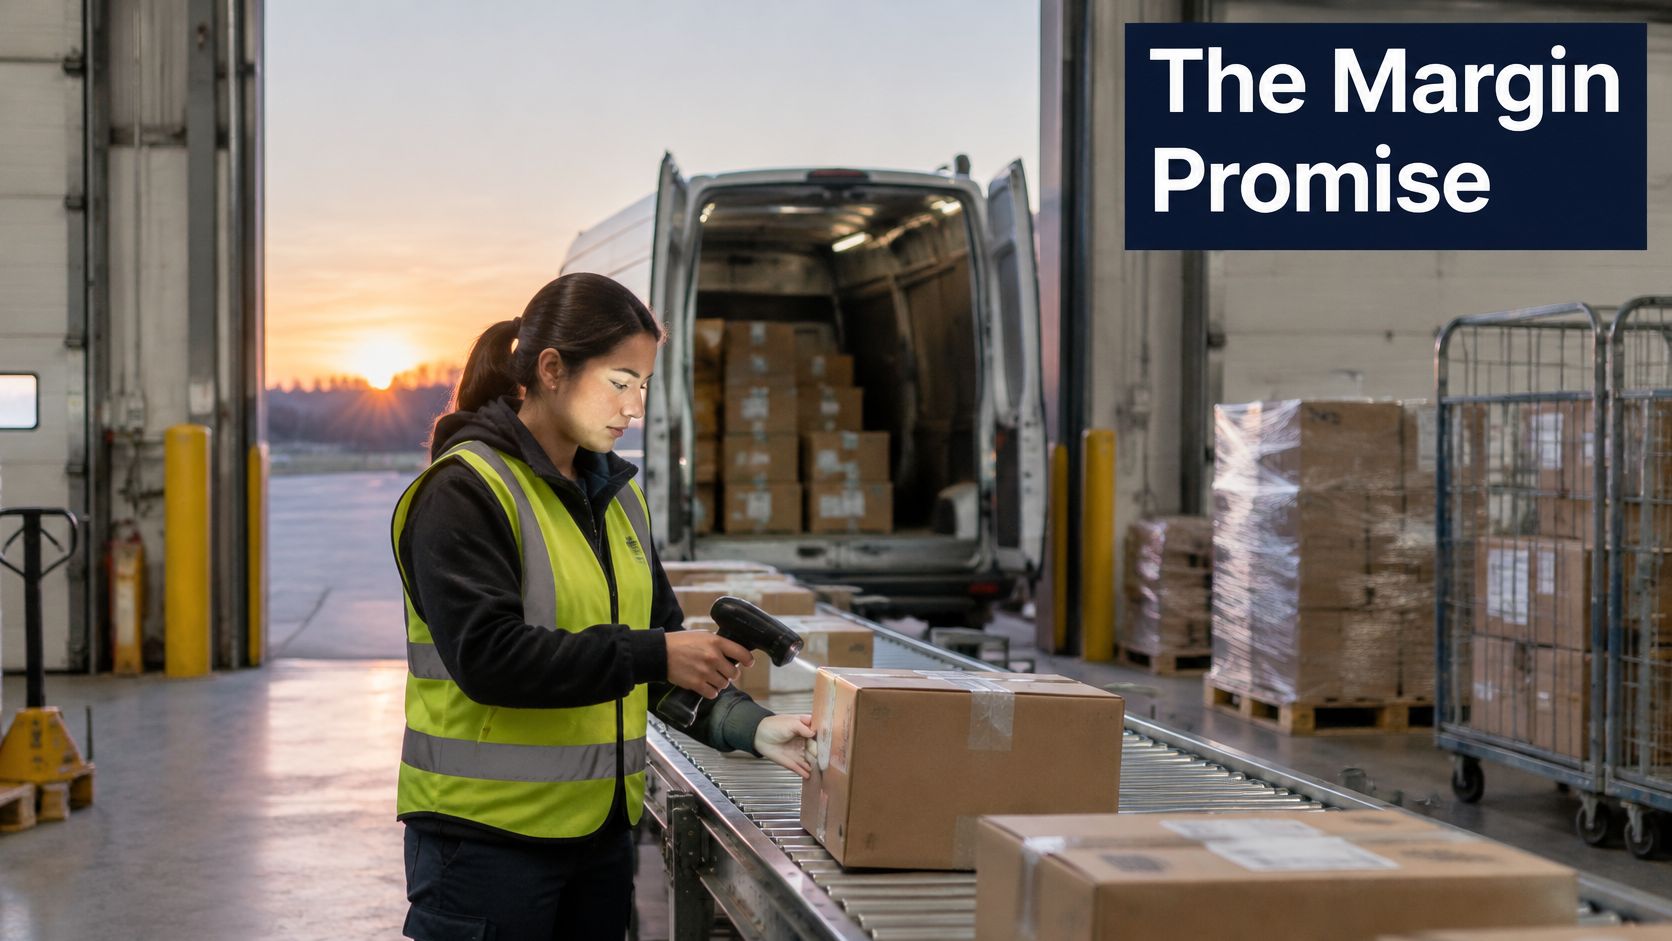
Think of a restaurant. The listing is the menu, inventory is the walk-in, fulfillment is the line during service, and account health is the inspection that can close the kitchen on a Tuesday afternoon. A great menu with an empty walk-in and a failing inspection sells nothing.
Every brand on Amazon is really making three promises: the unit is available, delivery lands when the listing says, and the account stays in good standing. Break the first and rank decays. Break the second and the badge disappears. Break the third and the revenue stops entirely while you write appeals.
Replenishment is the loop that touches everything else, and most brands run it on one weeks-of-cover target applied across the whole catalog. That single number hides the two things that cost money: a hero running dry while a long-tail SKU sits in a building collecting aged-inventory fees.
Here is the loop to run this week, before another SKU gets added to it.
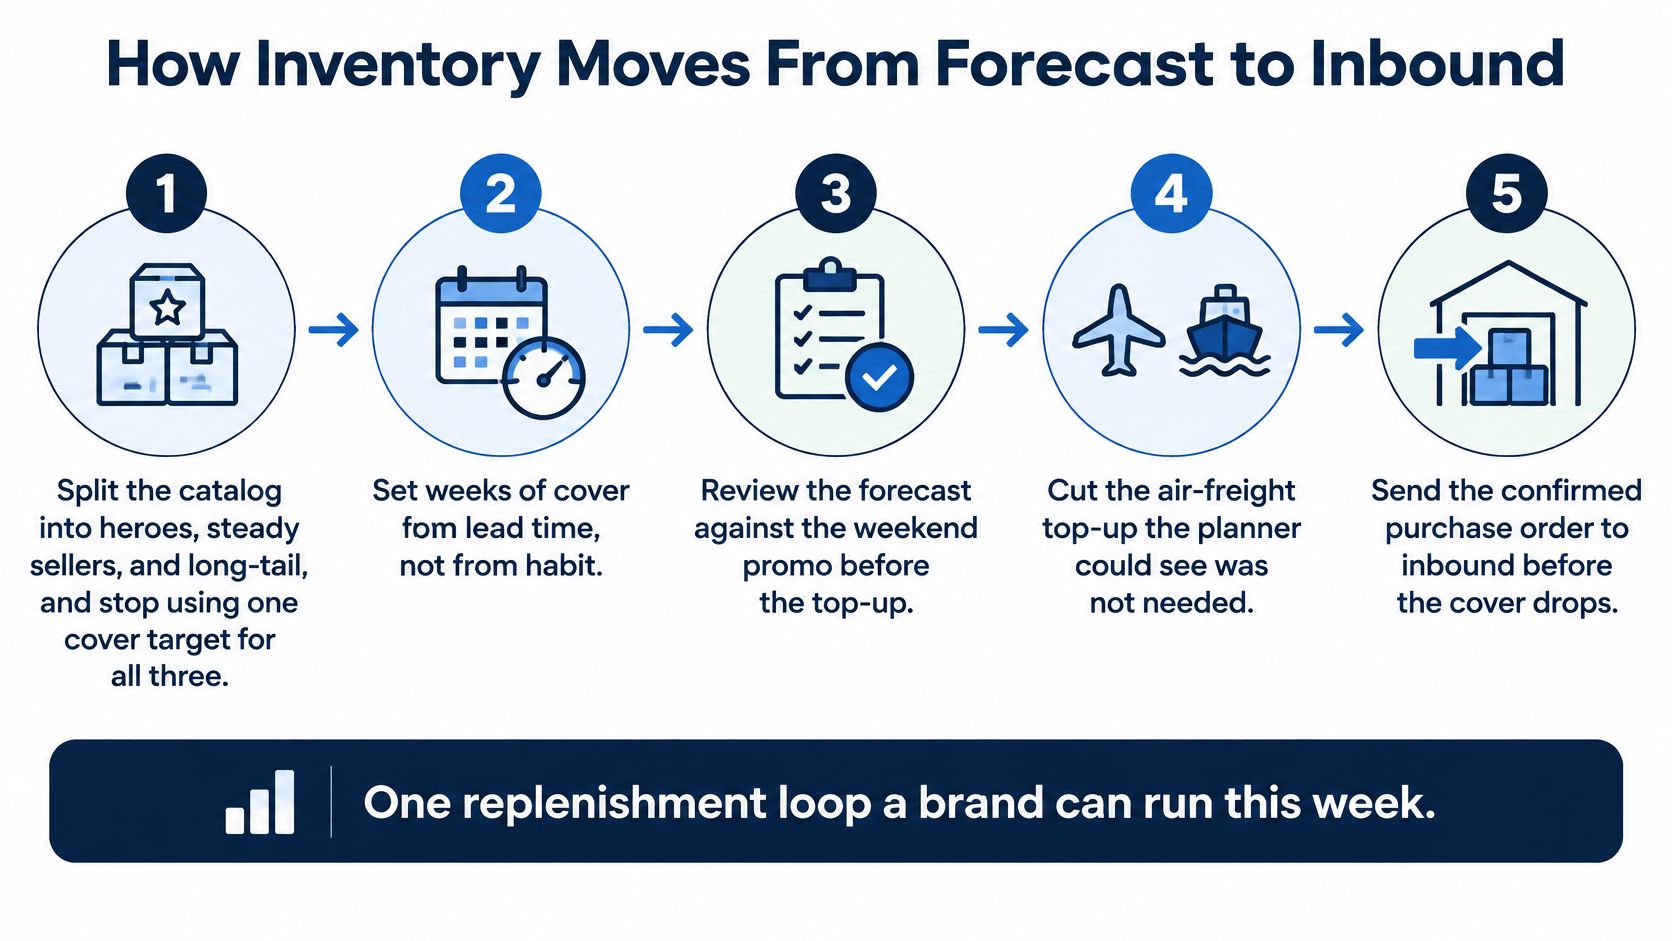
Seasonal SKUs need an inbound window scheduled backwards from the peak, not forwards from the factory. If the units land after the demand curve turns, the freight was the cheap part of the mistake.
Multipacks create phantom stock. The three-pack shows in stock while the single unit is stranded in another building, and the listing keeps selling a promise the network can't fill. Keep parent and child inventory reconciled or the buy box will teach you about it.
A healthy picture looks boring: heroes in stock, no unexplained unfulfillable pile, and the next purchase order dated to the lead time rather than to a panic.
Pin this map where the planner sits. Every row is a weekly job, one metric, and the failure that shows up first when nobody owns it.
| Area | Weekly work | Metric that matters | Breaks first |
|---|---|---|---|
| Demand and inventory | Forecast cover and reorder points by SKU | Weeks of cover and in-stock rate on heroes | Stockout or aged units |
| Inbound and placement | Book shipments, labels, and FC splits | Check-in time and inbound defect rate | Stranded or unfulfillable inventory |
| Fulfillment mode | Choose FBA, seller-fulfilled, 3PL, or hybrid | Contribution margin per order | Storage, returns, and removals eating the fee savings |
| Account and catalog health | Fix flags, listings, and cases | Policy and performance standing | Suppressed or suspended ASIN |
| Cash in the network | Track fees, turns, and removals | Inventory turns and days of stock held | Working capital stuck in slow SKUs |
The rows are ordered by how quickly a mistake becomes expensive. Inventory errors take weeks to surface, inbound errors surface in days, and an account flag surfaces in hours.
Amazon's own cost base explains why these seller metrics move margin. The company put fulfillment at 15.4% of net sales in 2025, up from 15.2% in 2024, with shipping costs of $102.7 billion, up from $95.8 billion, according to Amazon's 2025 Form 10-K. Those figures cover operating and staffing fulfillment centers, customer service, and payment processing. Placement, packaging, carrier utilization, labor, and delivery density are exactly the levers that produce a number that size, and each of them shows up as a line in your own unit economics.
The owner rule: if you can't name the person who checks a row every week, that row is currently unmanaged, no matter how good the dashboard looks.
Most brands can staff the first two rows with the existing team and stall on the third, because fulfillment mode gets decided once at launch and then never revisited while storage and returns reshape the margin.
The weekly work is not analysis, it's collection: pulling check-in times, unfulfillable counts, fee changes, and return reasons into one sheet before anyone can make a decision. That's the first job worth handing off. A virtual assistant for ecommerce can own the collection layer, so the founder spends the hour deciding instead of exporting.
Mark the row you can't staff this week. That one is the project, not the new product launch.
Treating FBA as a per-unit fee is the most expensive shortcut in Amazon operations. The pick-and-pack charge is the visible part. Storage duration, inbound defects, removals, returns, and the working capital sitting in Amazon's buildings are the part that decides whether a SKU makes money.
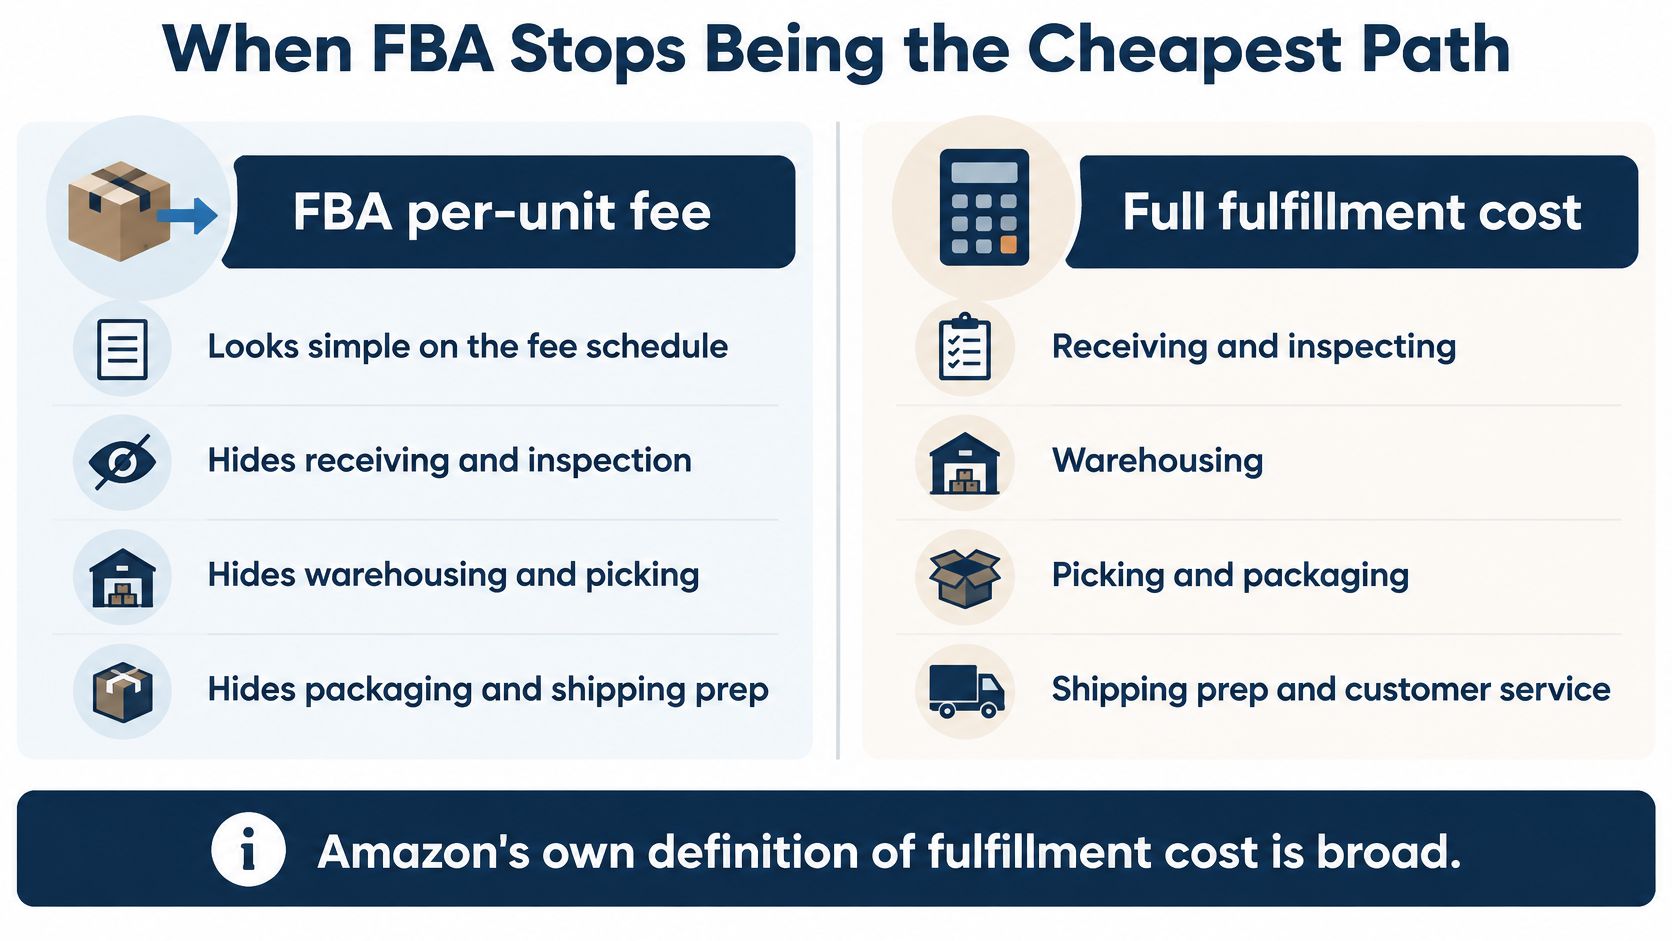
Amazon's own definition of fulfillment cost is broad. The 2025 filing counts receiving and inspecting inventory, warehousing, picking, packaging, shipping preparation, customer service, payment processing, facilities, equipment, rent, and third-party services, and it notes that costs rose with network investment and higher sales, with foreign-exchange movements adding $609 million to the increase, per Amazon's 2025 filing. Scale doesn't automatically lower your total cost. It prices speed and placement, and you inherit both.
Score each path on contribution margin per order, inventory turns, the service level the listing has to hit, and cash conversion. Not on the fee schedule.
| Model | Best when | Main cost driver | Cash tied up | Service level |
|---|---|---|---|---|
| FBA | Fast-turning heroes that need the fastest promise | Storage days, returns, removals, and inbound defects on top of fulfillment fees | High while Amazon holds the units | Fastest marketplace promise |
| Seller fulfilled | Slow, oversized, or high-return SKUs with a reliable carrier | Carrier rate, labor, and missed promise dates | Lower if stock stays in your building | Only as fast as your cutoff and zones |
| Regional 3PL | Same SKU also sold off Amazon, or backup stock outside FBA | 3PL receive, storage, and pick minimums | Medium, and movable if you own the inventory | Depends on the 3PL's ship zones |
| Hybrid | Hero in FBA, overflow and DTC at a 3PL | Split shipments plus the cost of keeping two pools accurate | Split, with a smaller FBA pool | Fast on the hero, flexible on the rest |
Take selling price and subtract the referral fee, the pick-and-pack or 3PL fee, inbound freight per unit, expected storage for the days on hand you carry, the return rate applied to the resale loss, removal cost per unit, and a charge for the cash sitting in that stock for its dwell time.
If FBA wins on the first two lines and loses once storage days and returns are included, that SKU is subsidizing convenience. Move it. I would start with the SKU that has the highest days on hand and the highest return rate, because those two stack. The line-by-line breakdown of FBA versus FBM on Amazon is worth reading before you make that move.
The video below walks through how the fee compares to the actual operating cost.
Hybrid is the answer more often than sellers expect: the hero stays in FBA for speed, and overflow plus DTC stock sits with a 3PL. Density is the lever on both sides. Amazon cut carbon emissions per shipped unit by 7% in 2025 compared with 2024, per its 2025 sustainability summary, and the same density logic decides whether your hybrid split is efficient or just duplicated freight.
A model that only wins on the pick fee isn't cheaper. It's cheaper on the line you happened to look at.
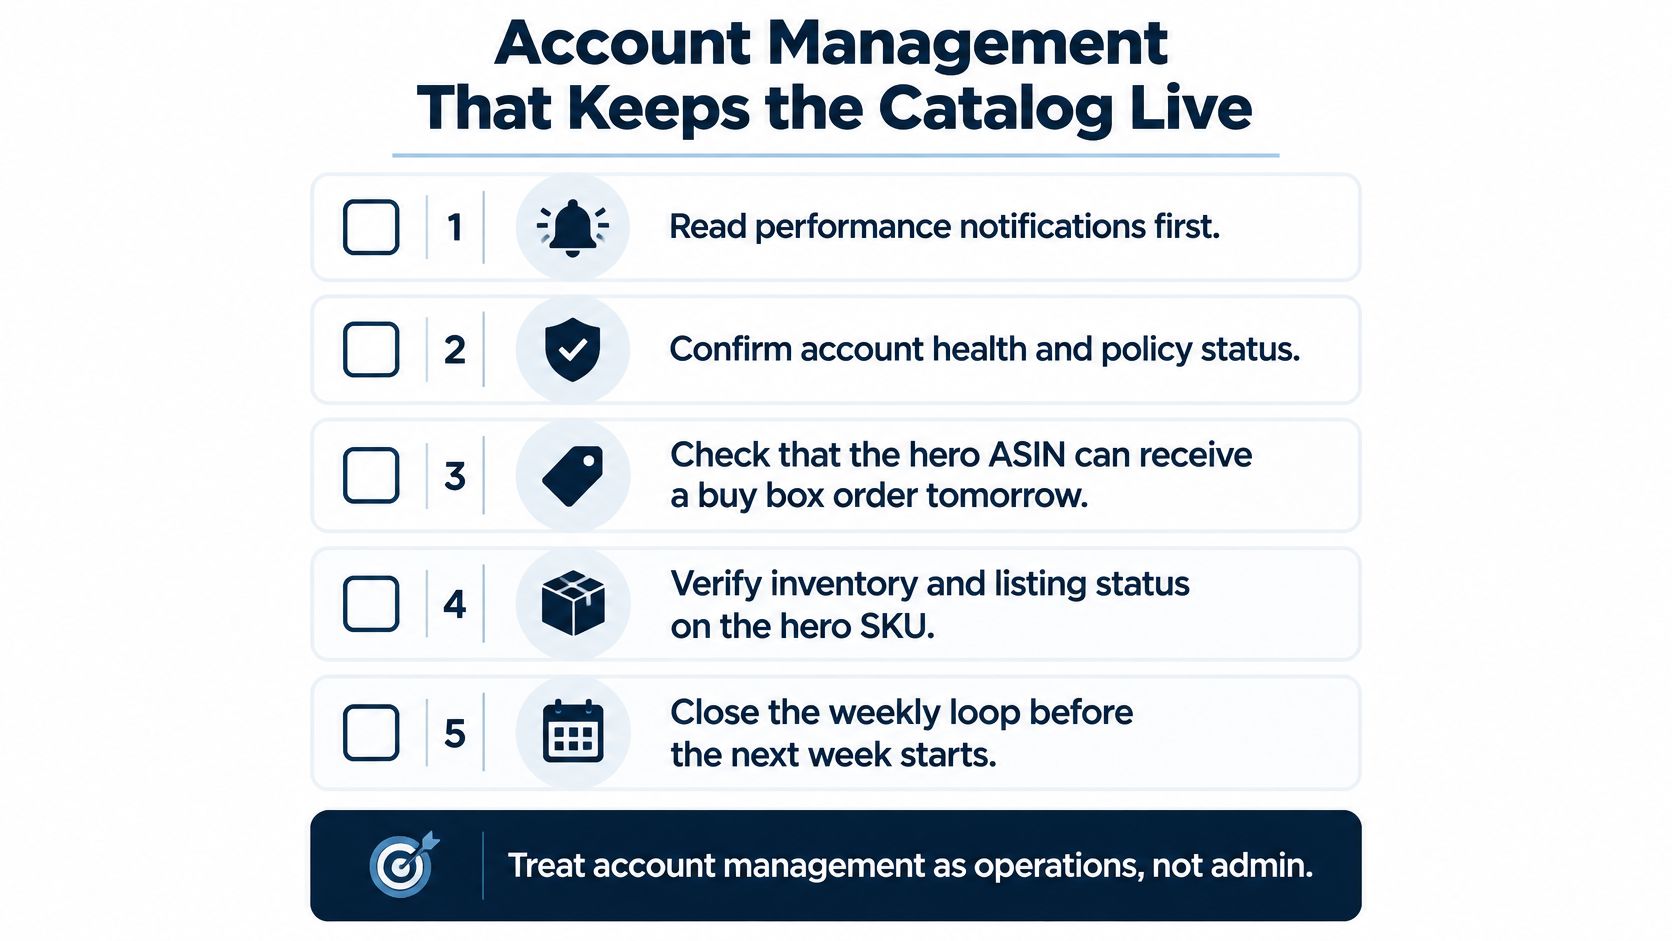
Account work is operations, not admin. A healthy account is one where the hero ASIN can take a buy box order tomorrow morning. Everything below that standard is a risk with a clock on it.
Cash leaks through the payment layer too. Seller transactions carry higher payment-processing costs as a share of net sales than Amazon's own retail sales, because those costs are calculated on the gross purchase price. A messy refund and reimbursement queue is therefore a margin problem, not just a service problem.
Appeal a suppression with the exact document the notice asks for. One page, the requested evidence, no narrative about how long you've been selling. The Amazon appeal process is where that document set gets built, and a clean file beats a long letter every time.
Reconcile reimbursements against lost or damaged inbound inside the claim window for that shipment type. Most brands leave money behind because nobody owns the queue.
Fix the detail page when returns say the item isn't as described. Changing images and bullets is faster than changing shoppers.
A brand selling in several marketplaces needs the same discipline with a narrower focus: one region's flag can absorb the whole team's attention while the home marketplace, the one paying the bills, drifts.
No ad budget increase goes onto an ASIN that is suppressed or chronically out of stock. The spend will buy you a lower conversion rate.
Take a home-goods brand whose hero bottle set produces most of its Amazon revenue, and watch one week. Nothing dramatic happens, which is the point.

Monday, the planner sees 18 days of cover after a weekend promotion and cancels the air-freight top-up that would have landed after the spike was already dead. That single decision protects more margin than a week of bid tuning.
Tuesday, inbound shows a pallet checked in as unfulfillable because the prep photos didn't match the shipment. The fix is a same-day case with photos and the packing spec, not a new purchase order. Reordering around a receiving problem just buys the same problem again with fresh freight costs.
Wednesday, the margin sheet replaces the fee calculator. FBA still wins on the hero. The bulky refill loses once 90 days of storage and a 12% return rate are in the row, so that SKU moves to the regional 3PL while the hero stays put.
Thursday, a detail-page mismatch is driving returns that say the count is wrong. The account owner edits the images before anyone requests more ad budget.
Friday, the team checks the backup: four weeks of the hero at the 3PL, enough to cover a receiving stall, plus a written trigger to flip those units if FBA in-stock on the hero drops under three weeks.
That backup exists because one platform currently holds demand access, payments, inventory custody, and the customer message. Amazon's 2025 filing notes the company relies on third parties for parts of fulfillment and customer service, which is the same reason a brand shouldn't treat the network as a fixed guarantee, as the filing summary sets out. Resilience is a portfolio decision with four inputs: expected lost contribution margin, recovery time, inventory exposure, and the cost of maintaining redundancy.
Sketch the same Monday-to-Friday cadence around your own hero SKU. If a day has no owner, that's the day the margin leaves.
Lock three owners before another SKU or campaign goes live: one for replenishment and inbound, one for the fulfillment-path score on each hero, and one for account standing. Then run a 45-minute weekly review covering weeks of cover, inbound defects, contribution margin by fulfillment path, open policy flags, and the backup weeks held outside FBA.
If a hero fails the margin test, move that SKU first. Redesigning the whole catalog is a way of avoiding the one decision that pays.
Founders who want outside pressure-testing on a fulfillment switch or a safety-stock trigger can bring both to Million Dollar Sellers, an ecommerce-only peer group where members have a collective TTM revenue of $15B+ and where entry requires $1M in trailing-twelve-month Amazon revenue as a founder or substantial equity holder. Peers who have already moved a hero out of FBA will tell you what broke.
One rule closes the loop: any decision reached with peers goes onto the weekly sheet with a named owner and a review date.
Million Dollar Sellers exists for operators who want their fulfillment, inventory, and account decisions stress-tested by people running the same playbook at scale. Bring your FBA-versus-3PL math, your safety-stock trigger, and your inbound defect rate to a room where the answers come from founders who have already paid for them. Visit Million Dollar Sellers to see how membership works and whether your brand qualifies.
Join the Ecommerce Community for Founders Scaling from 7 to 9 Figures
Learn MoreYou may also like:
Learn more about our events!
Check Events