Chilat Doina
November 18, 2025
If you've ever felt like you're just guessing whether your e-commerce store is actually making money, the Profit and Loss (P&L) statement is your new best friend. It’s not just another spreadsheet. It’s the story of your business’s financial performance over a specific time, like a month, a quarter, or a year.
The P&L—sometimes called an income statement—cuts through the noise to answer the single most important question you have: Are we profitable?
At its core, your P&L statement is a straightforward summary of your revenue, your expenses, and the resulting profit or loss. It’s one of the most fundamental financial documents for any company. On a macro level, these reports paint a picture of the entire economy. For instance, in the second quarter of 2025, total corporate profits after tax in the United States reached a seasonally adjusted rate of $3,355.897 billion.
But for an e-commerce brand, the P&L is all about making smarter decisions on the ground floor—the kind that directly beef up your bottom line. It stops you from flying blind and lets you know with certainty how your business is really doing. It's your financial report card, showing you exactly what’s working and what isn’t.

Here’s a simple way to think about it: Imagine your revenue is all the water flowing into a big bucket. Every single expense—from the cost of your products and your ad spend to shipping fees and software subscriptions—is a hole in that bucket. Your P&L statement tells you exactly how much water is left at the end of the day.
This isn’t just an accounting exercise. When you review your P&L regularly, you can:
A well-kept P&L statement is way more than an accounting chore; it's a strategic roadmap. It turns abstract numbers into actionable steps for growing your business the right way. Without it, you’re just winging it.
Now, to really get the most out of your P&L, it helps to understand the difference between accounting methods like accrual and cash basis. Knowing which method you're using is key to interpreting the data correctly and making sound decisions.
Ultimately, the goal is to see the whole story, not just the final number. For example, understanding a metric like gross margin gives you instant insight into how profitable your products are before a single dollar is spent on marketing or operations. We break this down even further in our guide on what is gross margin. Nailing these fundamentals is the first step to truly mastering your e-commerce finances.
If you really want to get a handle on your profit and loss statement, you have to stop seeing it as just a single document. Think of it more like a recipe. Each line item is an ingredient, and the "bottom line" is the finished dish you get to taste. For an e-commerce brand, nailing this recipe means tracking some very specific costs that brick-and-mortar stores never even think about.
Let's break down the essential pieces you'll find on your P&L, starting right from the top. We'll follow the money as it flows through your business, from the initial sale all the way to the final profit.
The whole journey kicks off with Revenue, which you’ll also hear called Gross Sales. This is the big, flashy number—the total amount of money you brought in from every single customer purchase, before any deductions. It’s the sticker price of everything you sold in a certain period.
But Gross Sales can be a bit of a vanity metric. The number you really need to care about is Net Sales. This is what’s left after you face the realities of selling online.
To find your Net Sales, you have to subtract a few common things:
This difference is critical. Your top-line revenue might look amazing, but your Net Sales tells you the real story of how much cash is actually coming into the business from selling your products.
Once you've got your Net Sales figured out, the next move is to subtract the Cost of Goods Sold (COGS). These are the direct costs tied to the products you actually sold. If a product is still sitting in your warehouse, its cost doesn't count here.
For e-commerce brands, COGS usually includes a few key things:
To truly understand your P&L, you have to break down every single expense. For e-commerce businesses, that means mastering how to calculate cost per unit in ecommerce. Getting this right is the only way to know if your products are actually profitable.
Subtracting COGS from your Net Sales gets you to one of the most important metrics on your entire P&L statement: Gross Profit.
Formula: Gross Profit = Net Sales - Cost of Goods Sold (COGS)
Gross Profit tells you exactly how much money is left over from your sales after you've paid for the products themselves. It's the fuel for the rest of your business. This is the cash you'll use to pay for marketing, salaries, software, and everything else it takes to run your company. A healthy Gross Profit is one of the strongest signs of a sustainable business.
Finally, we land on Operating Expenses (OpEx). These are all the costs of running the business that aren't directly tied to making or buying a single product. Think of this as the cost of keeping the lights on and the engine running.
For an online store, your OpEx section is going to be filled with some familiar friends:
By carefully sorting your numbers into these four main buckets—Revenue, COGS, Gross Profit, and OpEx—you create a clear, logical story of your company's financial health. Each line gives you another piece of the puzzle, leading you straight to that all-important bottom line.
Think of your Profit and Loss statement not as a boring spreadsheet, but as a story. It's a top-down narrative that tracks every dollar your business earns, showing you exactly where it goes until you're left with your actual profit.
Let's walk through it, step-by-step. We'll use a simple e-commerce example, "Cozy Mugs Co.," to make things concrete.
Imagine Cozy Mugs Co. generated $50,000 in total sales last month. That's our starting point—our Revenue. From here, we just follow a logical path of subtractions to see what’s really going on financially.
The very first calculation on any P&L is turning your total sales into a more useful number: Gross Profit. This tells you how much money you made from selling your products before paying for anything else. It's the first and most critical check on your core product profitability.
Here's how it works:
What’s left is your Gross Profit: $45,000 (Net Sales) - $15,000 (COGS) = $30,000.
This $30,000 is the money you have available to actually run the rest of your business.
Key Takeaway: Gross Profit is the engine of your business. A healthy Gross Profit means your pricing and supply chain are working in harmony, leaving you enough cash to cover everything else.
With your Gross Profit figured out, the next chapter in your P&L story is subtracting all the costs of running the business. These are your Operating Expenses (OpEx), and they cover everything from your ad spend to your Shopify subscription.
Back to our example, Cozy Mugs Co. has the following monthly OpEx:
By subtracting your total OpEx from your Gross Profit, you find your Operating Income: $30,000 (Gross Profit) - $19,500 (OpEx) = $10,500.
This number is huge. It shows you how profitable your core business is, completely separate from things like loans or taxes.
We’re almost there. The final step brings us to the famous "bottom line." To get there, you just need to subtract any non-operational items from your Operating Income. For most e-commerce brands, this usually means interest on loans and, of course, taxes.
You see massive corporations reporting enormous profits, but a closer look at their P&L often shows those numbers are boosted by one-off events like selling an asset, not just their day-to-day business. Globally, some companies have blown past $45 billion in annual earnings, and understanding these statements helps you see what’s sustainable profit versus a one-time windfall, as you can see in reports on the largest corporate profits and losses.
For Cozy Mugs Co., let's say they have a $500 interest expense on a business loan and an estimated income tax of $2,000.
This final number, $8,000, is your Net Income (or Net Profit). That’s the real, actual profit your business made for the month after every single bill has been paid. By following this top-down flow, you've turned a jumble of numbers into a clear story about your business's health.
Your P&L isn't just a boring financial report that your accountant sends over. Think of it less like a history book and more like a treasure map. The raw numbers are just the starting point; the real gold is in turning that data into Key Performance Indicators (KPIs) that tell you the story behind your business and what moves to make next.
These KPIs are like a health check for your brand. They take abstract financial data and distill it into clear, simple metrics that let you diagnose the health of your pricing, operations, and marketing. This is how a simple report becomes your strategic roadmap for growth.
The most important KPIs you can pull from your P&L are your three core profit margins. Each one gives you a different view of your financial performance, starting broad and getting more specific until you hit the all-important bottom line.
Here’s the essential trio every e-commerce founder needs to know:
Understanding the relationship between these three is fundamental. If your Gross Profit Margin is low, it’s a massive red flag. You need to immediately dig into your product costs or pricing strategy. But what if you have a strong Gross Profit Margin and a weak Operating Profit Margin? That points to a different problem, like bloated overhead or inefficient ad spend.
This infographic breaks down the simple flow of how your revenue trickles down into actual profit.
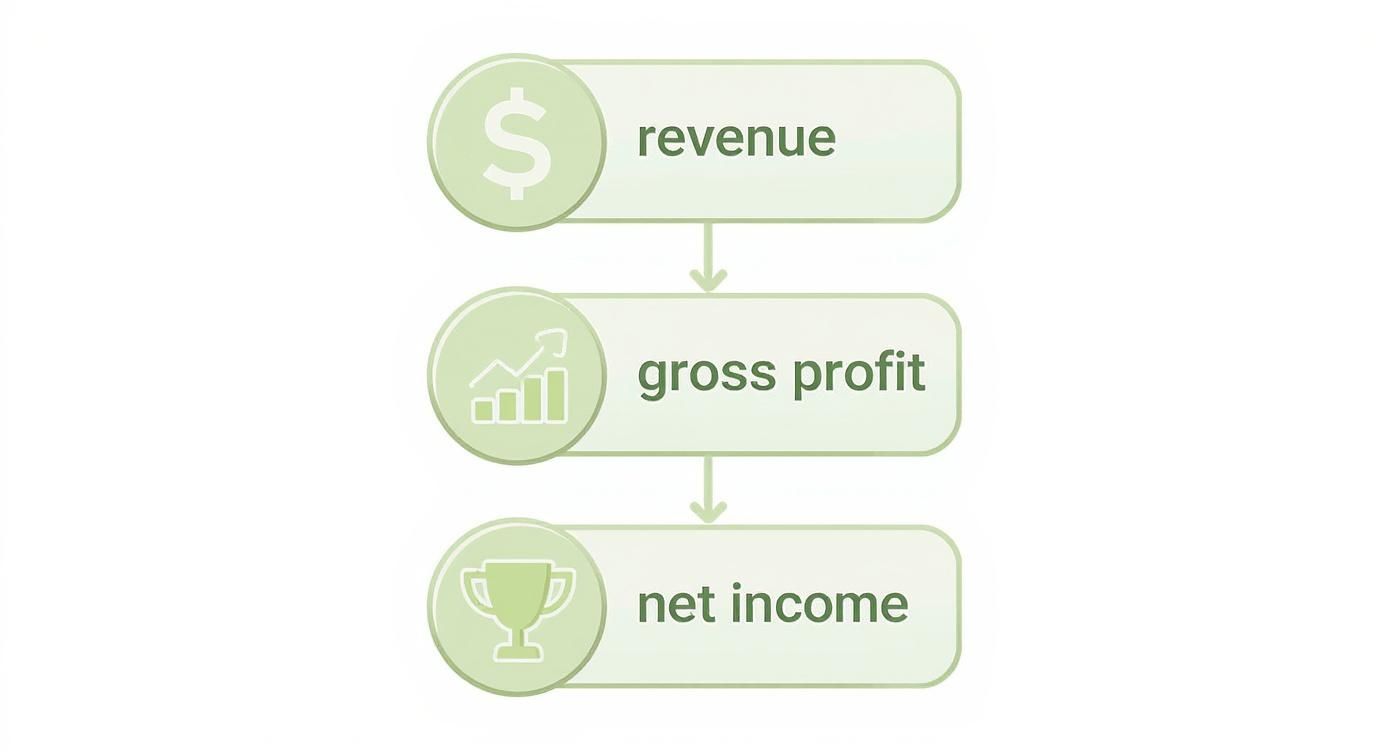
As you can see, each profit level is just a smaller piece of the one before it, with different types of expenses getting subtracted along the way.
Now, let's translate this into some simple math. Using the numbers straight from your P&L, you can calculate these vital percentages in just a few minutes.
(Gross Profit / Net Sales) x 100(Operating Income / Net Sales) x 100(Net Income / Net Sales) x 100By tracking these margins month over month, you graduate from just reading a report to actively managing your business's financial health. You can spot a worrying trend before it snowballs and double down on what’s actually working.
Beyond overall profitability, your P&L is perfect for scrutinizing specific costs. For any e-commerce brand, a crucial KPI is the Marketing Expense Ratio. It's a straightforward measure of what percentage of your revenue you're spending to acquire customers.
(Total Marketing Expenses / Net Sales) x 100If you spent $8,000 on marketing to bring in $45,000 in Net Sales, your ratio is 17.8%. There isn't a universal "good" number here—it depends entirely on your industry, growth stage, and gross margins. But tracking this KPI helps you answer one of the most important questions in e-commerce: "Is my marketing spend actually efficient?"
To help you keep these numbers straight, we've put together a quick reference table with the most important KPIs you can pull from your P&L.
KPIFormulaWhat It MeasuresGross Profit Margin(Gross Profit / Net Sales) x 100The percentage of revenue left after accounting for the cost of goods sold (COGS). A core indicator of product profitability.Operating Profit Margin(Operating Income / Net Sales) x 100The profitability of your core business operations, before interest and taxes. Shows operational efficiency.Net Profit Margin(Net Income / Net Sales) x 100The final "bottom line" profitability after all expenses, including taxes and interest, have been paid.Marketing Expense Ratio(Total Marketing Expenses / Net Sales) x 100The percentage of your revenue being spent on marketing and advertising. Helps gauge marketing efficiency.
This table serves as a great cheat sheet. When you're reviewing your financials, calculate these four metrics to get an instant snapshot of your business's performance.
Monitoring these KPIs consistently is the key to making smarter, data-driven decisions. To take it a step further, you can centralize these metrics and more by building out a dedicated performance metrics dashboard to keep a constant pulse on the financial vitals of your business.
A standard, blended P&L gives you a decent bird's-eye view of your business. It's a great starting point, but for a growing e-commerce brand, that top-level view can be dangerously misleading.
Why? Because it often hides unprofitable products and failing marketing campaigns behind your overall winners. This creates a false sense of security, masking problems that are quietly eating away at your bottom line.
This is where the top operators separate themselves from the pack. They go deeper. Instead of just glancing at the total profit, they break their P&L down into smaller, more granular pieces to uncover what’s really happening. This advanced analysis is where you find the golden opportunities to scale profitably.
One of the most powerful moves you can make is to analyze profitability on a per-product, or SKU-level, basis. A blended P&L might tell you that you have a healthy 30% net margin, but that average is often just an illusion.
In reality, you could have a hero product delivering a massive 60% margin, while another is secretly losing you money on every single sale once you factor in its specific storage costs, higher return rates, or unique shipping requirements.
To really see what's going on, you have to accurately allocate all relevant costs to each specific product:
This process shines a bright light on which products are your true profit drivers and which are just vanity revenue. Armed with these insights, you can make surgical decisions, like cutting a loser SKU to free up cash or doubling down on marketing for a true winner.
Just as some products are more profitable than others, so are your marketing channels. A blended P&L just lumps all your ad spend into one big line item, making it impossible to know if your Google Ads are truly outperforming your Instagram campaigns.
Channel-level P&L analysis solves this by essentially creating mini-P&Ls for each of your primary acquisition channels.
By isolating the revenue and direct advertising costs for each channel, you can calculate a true channel-specific return on investment. This moves you beyond surface-level metrics like ROAS and toward genuine channel profitability.
For example, you might discover that while Instagram has a higher ROAS, Google Ads attracts customers who buy higher-margin products and stick around longer, giving them a better lifetime value. This is the kind of deep understanding that’s critical for making smart decisions about where to put your money.
This mirrors how analysts dissect large-scale financial reports. Think about Wall Street. Historical data on NYSE brokers, who reported profits of around $26.3 billion in 2023, is analyzed to spot trends in cost management versus revenue growth. This detailed approach is what separates basic reporting from strategic financial intelligence, and you can learn more about these trends in financial sector profitability.
By applying these advanced P&L techniques, you stop just recording your financial history and start actively shaping your financial future. You gain the clarity needed to cut waste, reinvest in what works, and build a more resilient, profitable e-commerce business.
A small error on your profit and loss statement isn't just a typo—it can lead you to make disastrous business decisions based on a completely warped view of your financial health. Think of these common mistakes as hidden leaks in your financial bucket. Plugging them is the only way to make sure you keep as much of your hard-earned revenue as possible.
These aren't just minor accounting headaches, either. They can fundamentally change how you see what's working and what isn't, tricking you into pouring money into losing strategies or cutting the very things that are actually driving your growth.
One of the most frequent—and damaging—errors we see is misclassifying expenses. The classic e-commerce example is stuffing marketing and advertising spend into the Cost of Goods Sold (COGS) bucket. I get the logic: ads are a cost of making a sale, right? While it feels intuitive, it’s wrong according to standard accounting, and it will mess up your numbers.
When you do this, you artificially inflate your COGS, which in turn crushes your Gross Profit. Suddenly, your product margins look terrible, but you get a false sense of security about how much you're spending on operations.
A P&L is a story, and a miscategorized expense tells the wrong one. It's not just about being inaccurate; it's about being fundamentally misled by your own data.
Your P&L is only as good as the data you feed it. It's shockingly easy to overlook the small, recurring costs that quietly bleed your bottom line dry. At the same time, if you don't account for deductions from your revenue, you're working with Monopoly money.
Here are the usual suspects people forget:
Finally, your choice between cash-basis and accrual-basis accounting can make or break the usefulness of your P&L. Cash-basis accounting is simple: you record money when it comes in and when it goes out. But for an e-commerce brand with inventory, it's dangerously misleading.
Imagine you pay for $20,000 of inventory in January but don't sell it until March. A cash-basis P&L shows a huge loss in January and massive, inflated profits in March. Your monthly performance looks like a rollercoaster, giving you zero real insight.
Accrual-basis accounting, on the other hand, records revenue when you earn it and expenses when you incur them, no matter when the cash actually moves. This method paints a much truer picture of your profitability over time. It's the standard for any business that’s serious about scaling.
Even after you get the hang of your profit and loss statement, a few practical questions always seem to pop up. Getting clear answers here is the key to turning your P&L from a document you just glance at into a tool you actually use to build a stronger business.
Let's dive into some of the most common questions we see from e-commerce founders digging into their finances.
There's no single right answer here—the best cadence depends entirely on what you’re trying to accomplish. I like to think of it as having two different zoom levels for your business's financial health.
A monthly P&L review helps you manage the business day-to-day. A quarterly review helps you steer it for the long term. You absolutely need both to win.
This is a classic point of confusion, and for good reason. They're both critical financial statements, but they tell you completely different stories about your company.
Here’s the simplest way to remember it:
A P&L statement is like a movie. It shows your financial performance—your revenue, costs, and ultimate profit (or loss)—over a period of time, like a month or a quarter.
On the other hand, a balance sheet is like a snapshot. It captures your company's financial position at a single moment in time, showing what you own (assets) and what you owe (liabilities).
Yes, you absolutely can. Modern accounting software like QuickBooks or Xero has made it way easier to categorize all your transactions and generate a P&L pretty much automatically.
But there's a big trade-off. Doing it yourself saves you money, and it forces you to get intimate with your numbers, which is a huge plus. The downside? The risk of errors is real. Miscategorizing a few big expenses or using the wrong accounting method can lead to a flawed P&L, which in turn leads to bad decisions.
Hiring a good bookkeeper or an e-commerce accountant costs money, but it buys you accuracy and peace of mind. It also frees you up to focus on strategy, not data entry.
At Million Dollar Sellers, our members share battle-tested insights on everything from optimizing their P&L to scaling their operations. If you're a high-volume e-commerce entrepreneur looking to connect with a community of proven operators, learn more about what we do at https://milliondollarsellers.com.
Join the Ecom Entrepreneur Community for Vetted 7-9 Figure Ecommerce Founders
Learn MoreYou may also like:
Learn more about our special events!
Check Events