
Chilat Doina
September 27, 2026
Inventory shrinkage is the gap between recorded inventory and the stock physically on hand, and U.S. retail shrink reached $112.1 billion in FY2022, equal to 1.6% of total retail sales. That means roughly $1.60 of every $100 in sales value disappeared through theft, damage, administrative mistakes, or other causes. TCS describes the FY2022 retail shrink benchmark.
That figure reframes the question what is inventory shrinkage? It isn't a minor bookkeeping variance that finance cleans up at year-end. It's a margin leak created somewhere between purchase order, receiving dock, warehouse shelf, customer shipment, return inspection, and final inventory adjustment.
For ecommerce operators, the difficult part isn't defining the gap. The difficult part is identifying why each unit disappeared. A missing unit may be theft, a short vendor shipment, a mis-scanned transfer, a promotion configured below cost, a damaged return, or inventory that exists physically but is trapped in the wrong channel. Treating all of those outcomes as one shrink line makes the number visible but leaves nobody with a fix.
A four-unit difference is shrinkage. If an ERP shows one hundred units and a controlled count finds ninety-six, the gap remains unexplained until a documented transaction accounts for it. The definition is simple. The diagnosis is not.
The U.S. benchmark introduced above shows why operators should care. Applied to a brand with $2 million in annual sales, a 1.6% shrink rate would represent $32,000 in annual lost inventory value, before the effect on gross margin. The number matters because shrink scales with the business, while its causes often sit in separate teams and systems.
Shrinkage is different from a markdown or planned discount. A markdown is an intentional commercial decision recorded in the operating plan. Shrink is unplanned inventory value that the business expected to retain but can't recover. The accounting treatment may vary by system, but the operating question stays consistent: which unit or value failed to move through the process as expected?
Begin with a defined inventory position. Pull the record for a specific location, SKU, and cutoff time, then pause movements long enough to count the corresponding physical stock. Include receiving, quarantine, returns, damaged goods, and channel-specific locations, or document their exclusion.
A useful inventory management framework for ecommerce separates available, reserved, damaged, returned, and in-transit units. That distinction prevents teams from labeling timing issues as shrinkage when stock exists but sits in the wrong status or channel.
Practical rule: Never approve a shrink adjustment without a location, SKU, transaction window, and cause code.
The definition should produce ownership, not just an annual audit entry. Warehouse leaders own receiving and pick accuracy. Merchandising owns promotion rules. Supply chain owns vendor variances, while customer operations owns return disposition.
Channel separation makes the diagnosis usable. Compare warehouse counts with marketplace, direct-to-consumer, and returns records, then classify each variance as theft, returns fraud, promotion error, vendor short shipment, or process failure. Once every variance has a responsible process owner, shrinkage becomes an operational diagnosis instead of an undifferentiated loss line.
The traditional taxonomy starts with four buckets: external theft, internal theft, process errors, and damage. Those categories are useful because they force a team to move beyond the vague label “missing inventory.” They aren't sufficient on their own, particularly for brands selling through marketplaces and direct channels.
The composition has changed across the historical NRF-era reporting summarized by Protiviti's retail shrink analysis. The comparison below uses the shares provided for 2008 and 2022.
| Cause | 2008 share | 2022 share |
|---|---|---|
| External theft or shoplifting | 35.6% shoplifting | 36.1% external theft |
| Internal theft | 42.7% employee theft | 29% internal theft |
| Process or control errors | Not separately listed in the provided 2008 split | 27.1% process or control errors |
| Damage | Not separately listed in the provided 2008 split | Not separately quantified in the provided 2022 split |
External theft is the obvious example at a retail pop-up, but ecommerce brands face online equivalents such as delivery disputes, counterfeit returns, and stolen parcels. Physical controls still matter where goods are accessible, and operators evaluating security cages to prevent theft should consider whether restricted access fits the product, location, and labor model.
Internal theft includes an employee diverting units during picking, manipulating a return, or removing goods from a warehouse. The control response isn't surveillance everywhere. It's separation of duties, scan confirmation, restricted adjustment permissions, and exception reporting that identifies unusual patterns without assuming every discrepancy is malicious.
Process errors are less dramatic and often more expensive to ignore. A receiver may enter the wrong quantity, a picker may ship the wrong SKU, or a transfer may leave one warehouse without arriving in the destination system. Damage covers crushed cartons, broken products, spoilage, and units that become unsaleable through handling.
These buckets are a starting taxonomy, not a diagnosis. A mis-shipped unit can appear as a customer-service cost, a return, an inventory discrepancy, and a write-off at different points in the system. If the team doesn't trace the full transaction chain, the same loss may be counted twice or assigned to the wrong owner.
The assumption that shrink is mostly theft leads operators toward cameras, tags, and guards before they investigate pricing logic, receiving discipline, labor workflows, or marketplace synchronization. Recent industry coverage points to a broader operational problem. A 2025 study highlighted labor, pricing, promotions, and stock management as major drivers, with nearly 40% of retailers ranking promotion mistakes among their top five causes and 57% reporting out-of-stocks as a problem in the coverage from Grocery Dive.
Promotion errors are especially destructive because the inventory may leave the building exactly as instructed. A discount rule can create negative unit economics, a bundle can consume more stock than the system reserves, or a marketplace price can fail to update after a cost change. The unit isn't physically missing, but the business has lost value that should have been protected.
Out-of-stocks create a different distortion. The system says inventory exists, marketing continues to drive demand, and the customer reaches checkout only to encounter a cancellation or delay. That lost sale may not appear as shrinkage in the accounting system, but it signals that recorded inventory isn't reliable.
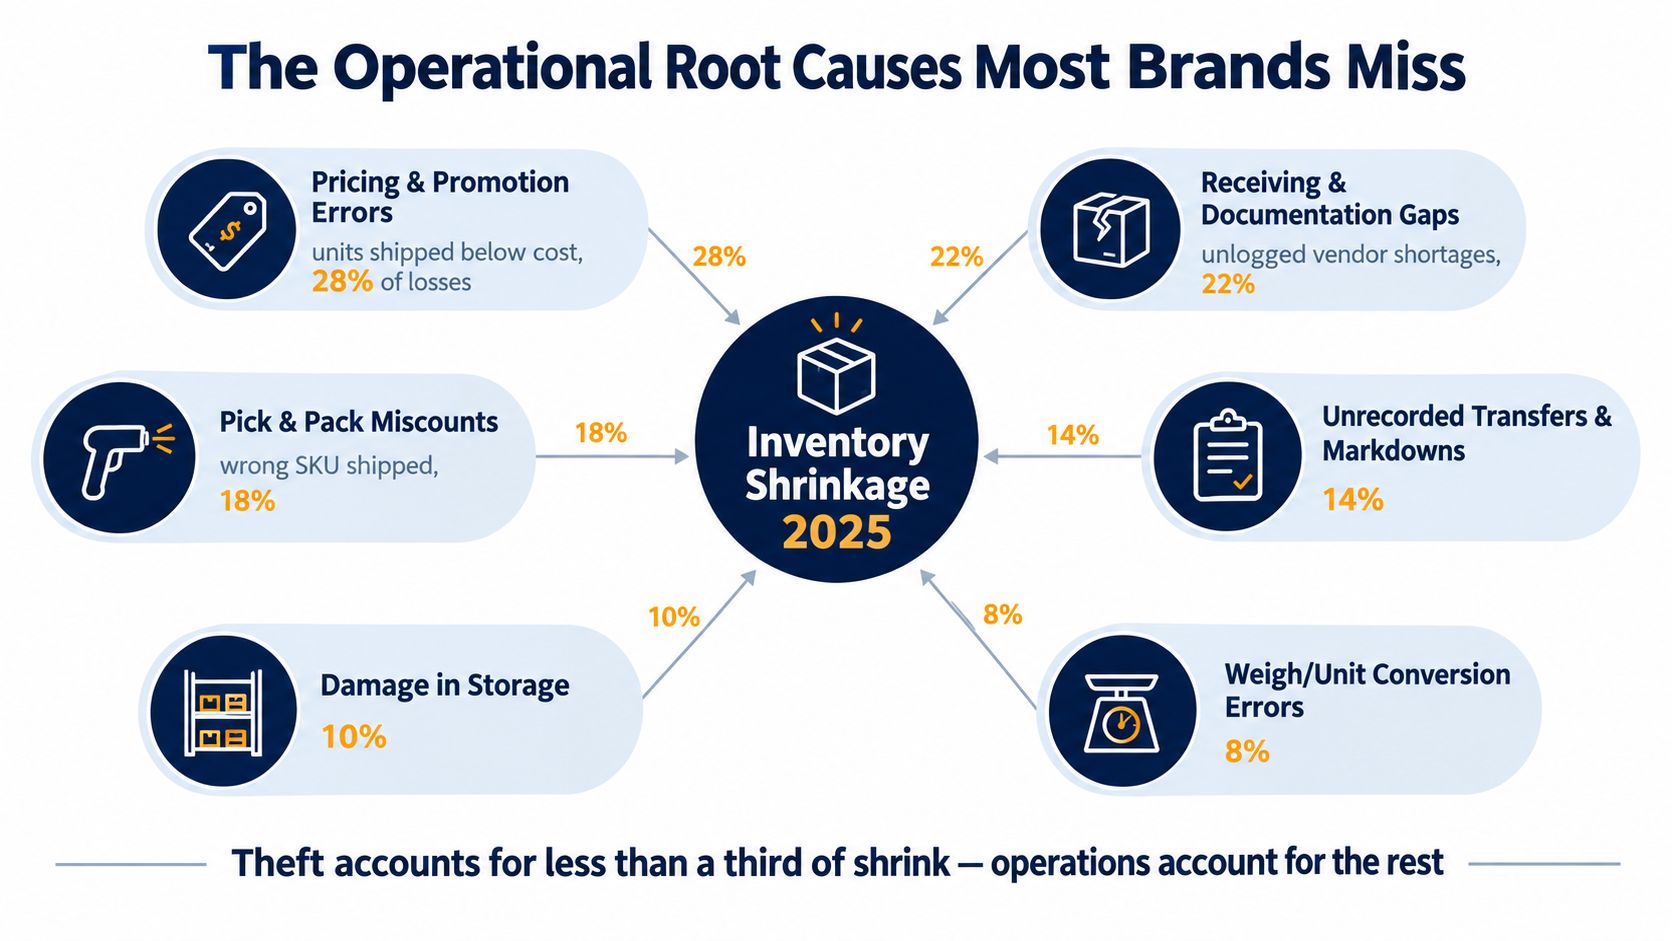
The practical conclusion is uncomfortable: a security-only program can address visible theft while leaving process-driven loss untouched. Founders should ask four questions for every material variance:
Until those questions have reliable answers, adding more loss-prevention hardware is often an expensive way to avoid fixing the transaction flow.
Start with a controlled count and a consistent formula:
Shrink rate = (Recorded inventory minus physical inventory) / recorded inventory
The denominator is expected inventory, not revenue. If the ledger shows 100 units and the count finds 98, the shrink rate is 2% for that defined population. Apply the same valuation basis throughout. A cost-based inventory measure should not be compared with a retail-value numerator.
The FY2022 benchmark of 1.6% of total retail sales, sourced earlier, is a retail sales benchmark, not a universal formula for every ecommerce inventory count. Define the population before reporting the result. If counted stock excludes in-transit units, state that in the report header so a 2% result remains comparable month over month.
Channel data often creates an apparent shortage. In-transit shipments may remain assigned to the origin location after departure. Pre-orders can inflate available units when reservations are not separated. Marketplace stock may be commingled, while an FBA report can differ from the quantity expected in the merchant system. Returns may sit in inspection, quarantine, or disposal without a final status.
Set a cutoff time, then reconcile every non-available state before assigning the variance to theft or process error. Teams that track movement velocity through inventory turnover ratio calculations can prioritize high-throughput SKUs, where a small count error affects more orders.
| Scenario | Recorded Units | Physical Units | Shrink Rate | Implied Margin Impact |
|---|---|---|---|---|
| Counted stock matches the ledger | 100 | 100 | 0% | No inventory variance |
| Small warehouse discrepancy | 100 | 98 | 2% | Cost of two missing units |
| Larger channel discrepancy | 100 | 95 | 5% | Cost of five missing units |
| Recorded units unavailable to fulfill | 100 | 90 | 10% | Cost of ten unavailable units, plus potential lost sales |
A monthly cadence exposes the cause while records are still available:
The total matters, but the cause trend directs the response. A stable aggregate can hide a growing returns problem offset by fewer warehouse errors. That distinction determines whether the next action belongs to loss prevention, returns control, merchandising, or warehouse operations.
Returns create a separate path from customer checkout back into inventory, and every handoff can change the unit's value. A returned item may be authentic, complete, and resalable. It may also be empty, used, damaged, swapped, missing accessories, or incorrectly routed.
The 2025 State of Returns report links shrinkage and lower resale value to fraud, damage, and unsaleable items. That makes returns data an inventory-control signal, not only a customer-experience metric.
A $40 item returned without a receipt isn't automatically a $40 shrink event. The business may lose the product's cost, inspection labor, return freight, repackaging materials, and the resale value difference if the item can only be liquidated or sold as open-box stock. The correct measurement follows the unit through disposition.
Fraud can enter through an empty box, wardrobing, label swapping, or a lower-value product returned in the original packaging. Damage can occur during reverse transit or inspection. FBA and 3PL discrepancies may require separate reconciliation because the platform's sellable, unsellable, lost, and disposed states don't always align with the merchant ledger.
A strong workflow records the return authorization, carrier movement, warehouse receipt, condition grade, serial or lot verification where relevant, final disposition, and inventory adjustment. Reducing returns in ecommerce should therefore include controls that protect recovery value, not just policies that reduce the number of parcels coming back.
Read the data by SKU, reason code, customer history, carrier, fulfillment location, and disposition. A spike in “wrong item” returns may indicate pick errors. A concentration of damaged returns from one carrier may point to packaging or handling. A product with frequent “not as described” claims may have a merchandising or quality problem rather than a fraud problem.
A return isn't closed when the refund is issued. It's closed when the unit has a documented, economically correct disposition.
Shrinkage removes more than the selling price of a missing unit. Product cost, inbound freight, handling, storage, preparation, and labeling have already been paid. If the unit cannot be sold, those costs remain while the expected revenue disappears.
The margin impact also depends on what caused the variance. A stolen unit, an unapproved return, a promotion configured incorrectly, and a receiving error may all appear as the same inventory adjustment, but they require different fixes. Treating them as one loss category makes the P&L harder to improve. Separate the causes by channel, SKU, fulfillment location, and transaction type before assigning a prevention budget.
For example, a business with $20 million in annual revenue and 30% gross margin would generate $6 million in gross profit. A shrink loss equal to 1.6% of revenue would total $320,000, or roughly 5.3% of expected gross profit. These figures illustrate the calculation using the stated assumptions, rather than describing a typical company.
| Annual Revenue | Gross Margin % | Shrink Loss | Gross Profit Lost % | Equivalent Marketing Budget |
|---|---|---|---|---|
| $20 million | 30% | $320,000 at 1.6% | About 5.3% | Compare with the company's actual budget |
| $20 million | 40% | $320,000 at 1.6% | 4% | Compare with the company's actual budget |
| $10 million | 30% | $160,000 at 1.6% | About 5.3% | Compare with the company's actual budget |
The indirect costs can be just as damaging. Phantom inventory creates stockouts and cancellations. Emergency replenishment can raise freight expense, while inflated safety stock ties up working capital. A promotion that sells unavailable stock adds customer-service work and may require refunds.
Build the business case around gross-margin recovery. Do not defend scanners, cycle counts, or returns inspection as generic overhead. Show which SKU groups are affected, how many units were recovered, what stockout exposure was avoided, and which operational owner must maintain the improvement. That evidence distinguishes a theft problem from a process problem and gives each channel a measurable corrective action.
Effective prevention matches controls to causes. A camera won't correct a promotion rule, and an RFID tag won't fix a vendor packing-list discrepancy. The useful stack combines physical accuracy, transaction discipline, exception reporting, and a review process that assigns every variance to someone who can change it.
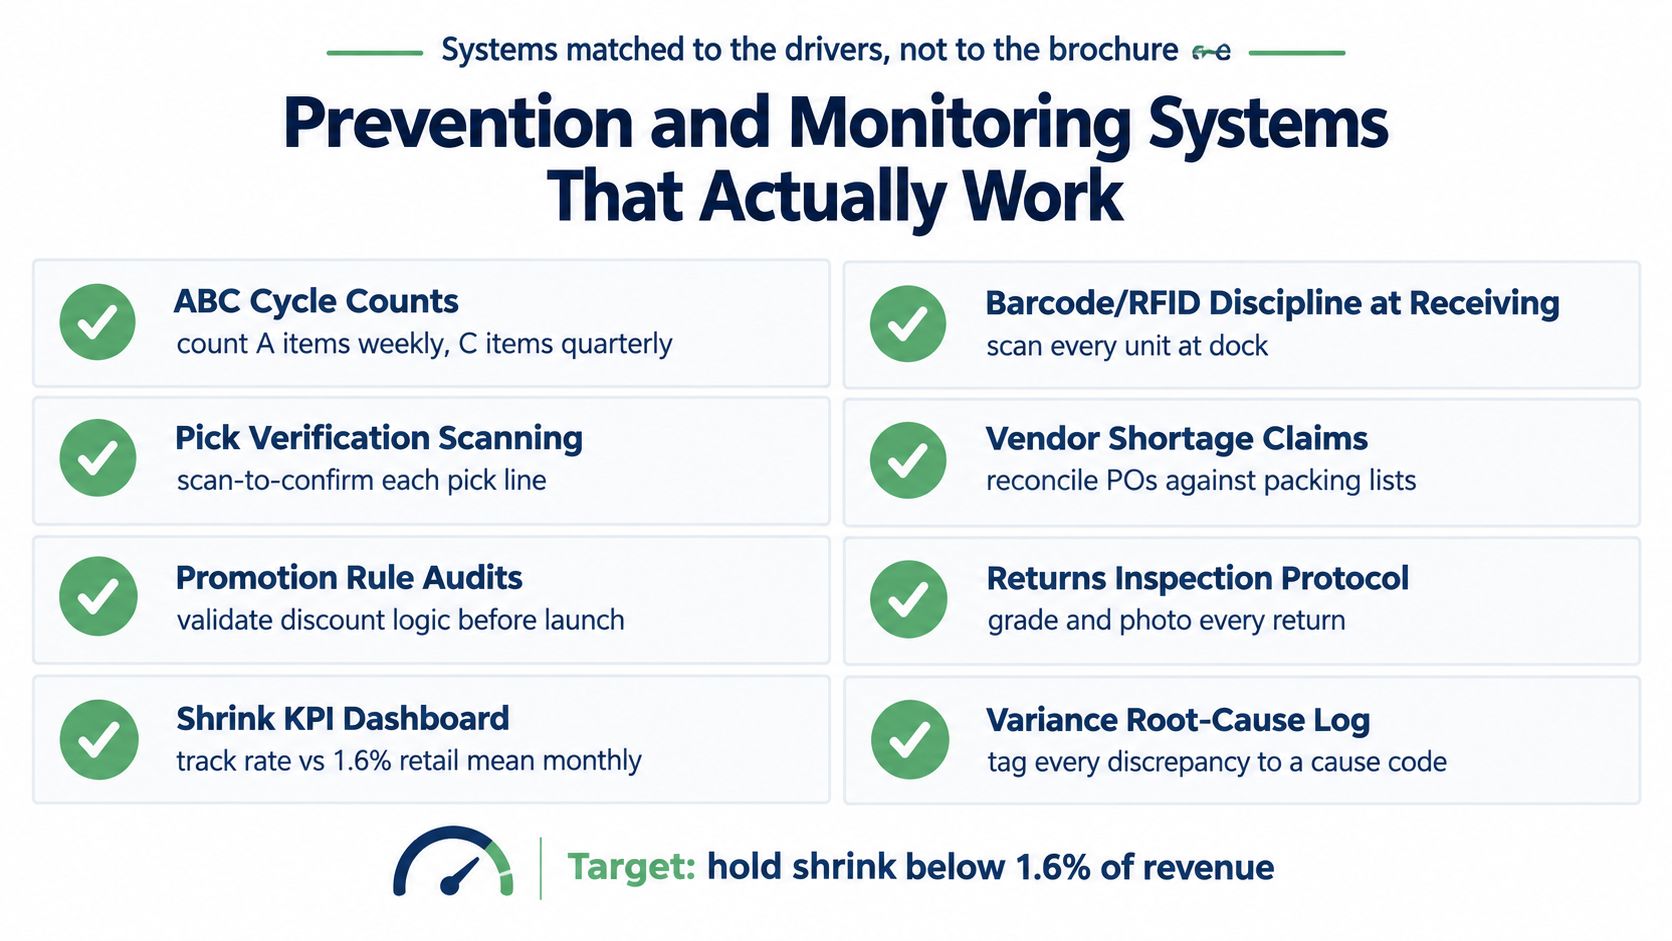
A dashboard should show shrink rate by channel and location, count accuracy, vendor compliance, return-fraud flags, negative-margin orders, mis-ships, and stockouts. The dashboard doesn't need to be elaborate. It needs stable definitions, consistent cutoffs, and an owner for every exception.
For broader security considerations, solutions to reduce retail shrink can help teams evaluate physical deterrence alongside operational controls. The trade-off is simple: invest in surveillance when the loss pattern supports it, but don't use surveillance as a substitute for scan discipline and reconciliation.
Million Dollar Sellers provides inventory management content and peer discussions relevant to sell-through, weeks of cover, reorder points, open purchase orders, and reconciling physical counts with system counts. That type of operating context can complement tools such as an ERP, WMS, returns platform, or channel-management system.
Measurement standard: If a control doesn't produce a reportable exception, a responsible owner, and a follow-up action, it isn't a control yet. It's a procedure people hope will work.
A useful first-quarter plan separates theft, returns fraud, promotion mistakes, and process errors instead of treating every adjustment as one unexplained loss. Start with diagnosis, then repair the transaction points creating the largest discrepancies.
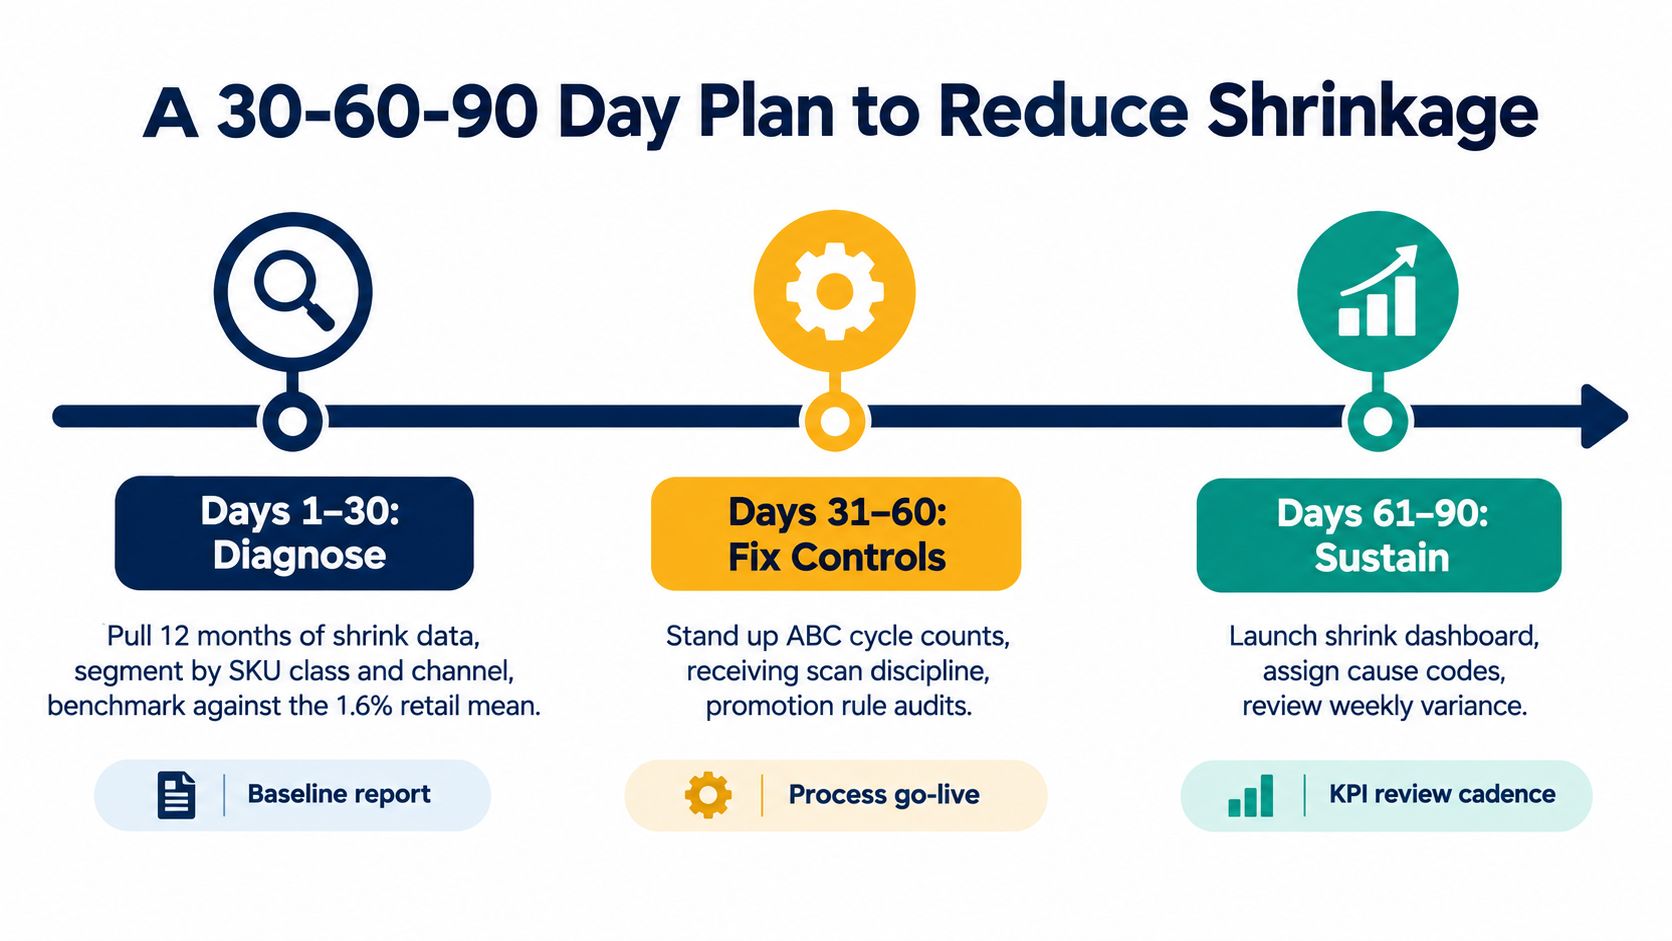
Pull shrink and adjustment history for the last 12 months. Segment it by SKU class, fulfillment location, sales channel, vendor, and cause code. If coding is incomplete, review the largest adjustments first and classify them manually. Separate DTC, marketplace, FBA, 3PL, and store activity before calculating a blended rate.
Use the 1.6% retail benchmark as a directional comparison, not a universal target. The benchmark is documented by TCS. If your category historically runs below 0.5%, treat that benchmark as an upper bound and set the first-quarter target at half your trailing-twelve-month rate. Report both the rate and dollar value, since a modest rate can still consume substantial cash at scale.
Run ABC cycle counts on items driving the greatest value or customer impact. Tighten receiving with purchase-order matching and barcode scans, then apply the same checks to picking, packing, transfers, and returns.
Create exception reports for negative-margin orders, mis-ships, unexplained adjustments, vendor shortages, and stockouts. Review promotion rules before major campaigns, particularly where bundles, coupons, and marketplace prices interact. Compare return outcomes with the original order so refund leakage is not buried inside ordinary inventory adjustments.
Request vendor chargebacks when documented shortages or damage meet the agreed evidence standard. Add RFID or scanner gates only when the variance pattern supports the cost and staff can maintain the process.
Assign one owner to the shrink dashboard. Review it monthly, with weekly attention to material variances. Each review should identify what changed, which cause is responsible, whether the corrective action worked, and whether the same failure appears in another channel.
At quarter end, keep the cadence. Recount priority SKUs, revisit returns and vendor data, update cause codes, and connect the review to gross margin. Million Dollar Sellers offers peer discussions on inventory planning and reconciliation for Amazon, DTC, and omnichannel operators. For physical deterrence, solutions to reduce retail shrink can inform equipment decisions, but surveillance cannot replace scan discipline or reconciliation.
Join the Ecom Entrepreneur Community for Vetted 7-9 Figure Ecommerce Founders
Learn MoreYou may also like:
Learn more about our special events!
Check Events