
Chilat Doina
September 14, 2026
You're running ads to a hero SKU that will be unavailable before the next inbound shipment clears receiving. At the same time, another product is occupying warehouse space, tying up cash, and hasn't moved in months. Amazon shows one available quantity, Shopify shows another, and your wholesale rep is asking whether a backorder can ship this week.
That isn't a purchasing problem. It's an inventory management ecommerce problem, where demand generation, channel allocation, purchasing, and fulfillment operate from different versions of reality. The fix isn't another spreadsheet or a promise to “check inventory more often.” You need rules that connect forecasts to reorder points, supplier constraints, channel priorities, and cash limits.
Tuesday morning, your Amazon account manager emails about the hero ASIN. The listing is still active, ads are still spending, and shoppers are still clicking, but FBA is close to zero. Shopify carts for the same product are being abandoned because the promised delivery date keeps moving. Your wholesale representative asks why the latest replenishment is short, while your warehouse team points to pallets of a slower SKU that have been sitting untouched.
That scene feels chaotic because every team is looking at a different question. Marketing sees demand. Amazon sees fulfillment availability. Wholesale sees commitments. Finance sees purchase orders and cash. The warehouse sees physical units. Inventory precision is the connective tissue between all five.
Inventory record inaccuracy means the quantity in the system differs from the quantity physically available. A Cardiff University retail study found that about 60% of SKUs were affected by inventory record inaccuracies, and correcting those inaccuracies produced roughly 4% to 8% more sales among participating retailers, as summarized by Amazon Business's ecommerce inventory management overview. The source also identifies inaccurate records as an important driver of stockouts, because replenishment and availability decisions depend on what the system believes is sellable.
Operator rule: An unavailable winner costs more than the carrying cost of a slow mover. Allocate attention according to lost revenue exposure, not warehouse convenience.
The problem gets larger as online demand becomes a larger part of retail. U.S. seasonally adjusted ecommerce sales reached $326.7 billion in Q1 2026, up 9.8% from Q1 2025, and ecommerce represented 16.9% of total U.S. retail sales in that quarter, according to reported U.S. ecommerce sales data. Your system has to protect availability across Amazon FBA, DTC, and wholesale because customers won't distinguish between an inventory error and a brand that failed to deliver.
Inventory management ecommerce means continuously deciding what to stock, where to place it, when to reorder it, and which channel gets priority when supply is limited. Counting units is only the starting point. The operating system must also translate demand signals into purchasing decisions and keep the available-to-sell quantity accurate across every sales channel.
I use three P&L lines to test whether an inventory decision is working:
Start with the catalog. Every sellable variant needs one canonical SKU, one unit of measure, and a clear relationship to marketplace listings, bundles, kits, and wholesale packs. If a single physical product appears under several internal identifiers, your forecast and available-to-sell balance will be wrong before the first order is placed.
Next, separate physical inventory from sellable inventory. Units reserved for wholesale, held for quality review, committed to an FBA transfer, or assigned to a bundle shouldn't appear as freely available DTC stock. Your system needs explicit states for on hand, allocated, inbound, damaged, quarantined, and available to promise.
Then assign channel rules. Amazon FBA may deserve priority for a proven hero SKU, while DTC needs inventory for bundles and customer data capture. Wholesale may carry contractual consequences that don't appear in marketplace metrics. Allocation is a commercial decision, not a default setting inside an OMS.
Finally, set the cash boundary. The right purchase order is not the one that fills every warehouse location. It's the one that protects service levels without trapping capital in products with weak demand, short shelf life, or uncertain channel fit.
A dashboard becomes useful only when each metric has a threshold, an owner, and a prescribed action. Without those three elements, tracking inventory KPIs is decoration.
Sell-through rate tells you how much of an available quantity moved during a defined period. Use it to decide whether a SKU deserves more supply, a smaller reorder, or a markdown plan. Weeks of cover divides usable inventory by expected weekly demand. It reveals whether a stockout is approaching, but it's only meaningful when demand and inbound quantities use the same assumptions.
Fill rate measures the share of demand you fulfill completely. Review it by channel and SKU class, because an aggregate number can hide an unacceptable failure on a hero product. Turn measures how often inventory converts through the business over a period. Pair it with gross margin return on inventory, or GMROI, so a fast-moving low-margin item doesn't automatically receive more capital than a slower, more profitable product.
Amazon's Inventory Performance Index, or IPI, belongs in the Amazon-specific operating view. It can influence how you manage FBA storage exposure and stranded or aging units, but it shouldn't become the company's master inventory metric. A strong FBA score won't fix a DTC stockout or a wholesale allocation error.
At seven-figure scale, weekly leadership reviews should focus on sell-through, weeks of cover, fill rate, and cash committed to open purchase orders. At eight-figure scale, add channel-level allocation exceptions, inbound reliability, forecast bias, and aged inventory by location. The exact target band depends on category, margin, lead time, and service promise, so set thresholds from your economics instead of copying generic benchmarks.
| KPI | Formula | 7-Figure Target | 8-Figure Target | Trigger Action |
|---|---|---|---|---|
| Sell-through | Units sold ÷ units available | Set by demand class | Set by channel and demand class | Increase, reduce, or stop replenishment |
| Weeks of cover | Sellable units ÷ forecast weekly demand | Within SKU policy band | Within channel-specific policy band | Expedite, reallocate, or defer |
| IPI | Amazon's inventory performance measure | Above Amazon's operating requirement | Managed alongside contribution and aging | Review FBA quantity and stranded stock |
| Fill rate | Fully fulfilled demand ÷ total demand | Protect hero and contractual SKUs | Review by channel, location, and SKU | Escalate allocation or inbound risk |
| GMROI | Gross margin ÷ average inventory cost | Compare capital productivity | Rank funding by return and risk | Shift open-to-buy toward stronger returns |
| Turn | Cost of goods sold ÷ average inventory | Improve without harming availability | Segment by velocity and margin | Change buy quantity, cadence, or exit plan |
Keep the executive view narrow. Put weeks of cover, fill rate, and open-PO exposure on the weekly meeting page. Review detailed SKU turn, IPI drivers, and exception logs monthly, unless an A-item breach demands immediate action.
Forecasting should evolve with the business. Don't buy an advanced model before your SKU history, promotions, returns, and channel mappings are clean. A forecast built on unreliable inputs gives you a precise-looking version of the wrong answer.
A rolling 30, 60, or 90-day moving average works well for products with steady demand and limited promotional distortion. It's transparent, easy to audit, and useful for early demand classes. It breaks when seasonality, price changes, advertising pushes, launches, or channel mix changes make recent history unrepresentative.
Weighted moving averages give more influence to recent periods. Exponential smoothing goes further by adapting to level and trend without requiring a complex feature set. These methods are appropriate when the pattern is changing, but the causes of change are still relatively simple.
Once pricing, advertising, and seasonal effects materially shift demand, regression becomes more useful. Feed it clean variables and test whether each signal improves the forecast out of sample. Don't treat ad spend as demand. Advertising can create demand, capture existing demand, or spend against an item that can't ship.
Mean absolute percentage error, or MAPE, expresses forecast error relative to actual demand. Independent industry guidance reports typical SKU-level ecommerce companies at 35% to 50% MAPE, while best-in-class operations reach 10% to 20% MAPE for monthly forecasts, according to the cited industry guidance on SKU-level forecasting. The same source reports that improving forecast accuracy by 10 percentage points can reduce stockout events by 20% to 35%, when purchase orders align more closely with demand timing and quantity.
Suppose a purchase order is intended to cover eight weeks. At 40% forecast error, the planning range implied by the brief is roughly 4.8 to 11.2 weeks, which creates a painful choice between an early stockout and excess cash tied up in product. At 15% MAPE, the same order lands in a materially tighter planning band, making safety stock, inbound timing, and channel allocation easier to control. Don't promise a specific cash saving from that improvement without your unit economics. The operational benefit is narrower uncertainty.
| Forecast Method | Best At | MAPE Range | Caveat |
|---|---|---|---|
| Moving average | Stable, established demand | Business-specific | Lags launches and turning points |
| Weighted moving average | Recent demand shifts | Business-specific | Weight choices can overreact |
| Exponential smoothing | Level and trend | Business-specific | Needs clean history |
| Regression | Price, advertising, and seasonality effects | Business-specific | Bad inputs create false confidence |
| Demand sensing | Lead time, calendar, and market signals | Business-specific | Requires integrated data and governance |
When the baseline stops explaining demand, add lead-time variability, marketing calendar signals, competitor availability, and marketplace events. For a practical overview of the earlier-stage process, use this demand forecasting ecommerce guide. The point isn't to chase model complexity. It's to reduce the uncertainty that your replenishment rules must absorb.
A forecast has no operational value until it changes a purchase order. The working chain is straightforward: forecast output sets expected demand, reorder point determines the trigger, safety stock absorbs variability, and replenishment cadence determines when the system checks and acts.
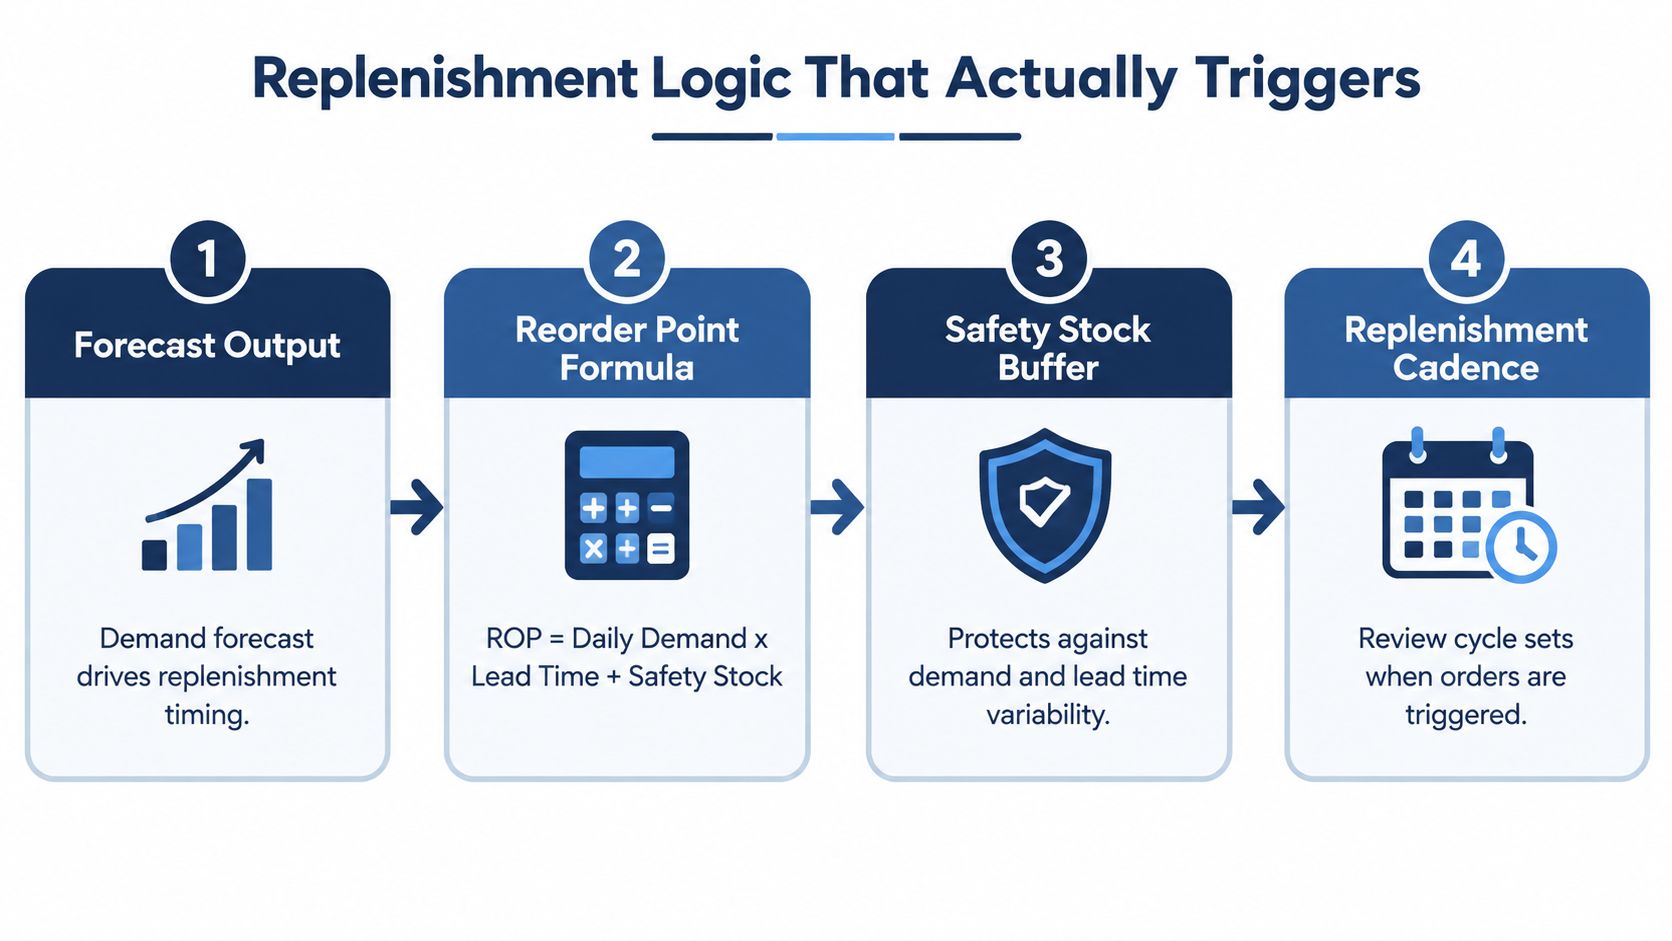
The standard reorder point is:
ROP = average daily demand × lead time + safety stock
That formula is a starting point, not the final policy. Add open inbound that is reliable, subtract allocated and unavailable units, and account for supplier minimum order quantities. If a supplier sells by case or container, SKU-level demand may tell you when to reorder, but container economics may determine how much to buy. A purchase order can be mathematically efficient at the SKU level and financially inefficient at the shipment level.
Safety stock should respond to the variation around demand and lead time, not only the average lead time. A supplier with a predictable average and erratic delivery dates needs more protection than a supplier whose transit time is consistently close to plan.
As a practical illustration, a 14-day lead time with three days of standard deviation requires roughly a week of buffer at a 95% service level, based on the planning example in the brief. Treat that as an illustrative policy input, not a universal answer. Your service target, demand volatility, and supplier reliability should determine the actual buffer.
A-items may need weekly review because a missed reorder can interrupt meaningful revenue. D-items can use a monthly review when their demand and financial exposure are low. Review cadence should follow velocity and risk, not a convenient calendar.
The system must recalculate when a variable changes. Higher forecast error raises safety stock. Longer or less reliable lead time raises the reorder point. A higher service-level target raises the buffer. A larger MOQ increases PO size and may force a cash review. If those values don't move together, you don't have replenishment logic. You have disconnected spreadsheets.
FBA is strong for proven hero SKUs that benefit from Prime eligibility, fast delivery, and marketplace discoverability. It also creates exposure to Amazon storage economics, aging inventory, removal decisions, restricted ASINs, and stranded units when account or listing conditions change. FBA should be a fulfillment strategy, not a warehouse for every variant you've ever launched.
A DTC 3PL gives you more control over margin, kitting, customization, and a shared pool that can support Shopify, TikTok Shop, and Amazon MCF. The tradeoff is integration work, operational dependency on the warehouse, and potentially slower delivery than FBA for certain marketplace orders. Wholesale adds another constraint. Its purchase orders may be planned well in advance, but the timing and penalties around short shipments can differ from DTC and marketplace demand.
A shared pool doesn't prevent overselling by itself. You need channel-level reservations and release rules.
| Dimension | FBA | DTC 3PL | Omnichannel |
|---|---|---|---|
| Primary strength | Prime fulfillment and marketplace reach | Margin, kitting, and customization | Central allocation across channels |
| Main risk | Aging, stranded, or inflexible stock | Integration and service variability | Complex rules and data governance |
| Best fit | Proven fast-moving hero SKUs | Variants, bundles, and custom orders | Shared inventory across Amazon, DTC, and wholesale |
| Required control | FBA replenishment and aging review | Accurate warehouse integration | Available-to-sell reservations and priority rules |
Physical reliability matters too. If receiving delays, conveyor failures, or warehouse interruptions affect your stock position, operational maintenance becomes part of inventory protection. Teams evaluating ways to reduce unplanned downtime in logistics should connect those controls to inbound and fulfillment risk, not treat them as a separate facilities project.
For sellers combining channels, omnichannel inventory management is useful only when it leads to explicit allocation policies. An OMS can coordinate the pool, but it can't decide whether wholesale or DTC should win during a constrained launch. That priority belongs in your commercial rules.
A unified inventory system doesn't eliminate stockouts. It can synchronize bad data faster, distribute an incorrect forecast across channels, and make an overconfident purchase order look authoritative. Forecasting reduces uncertainty. Risk controls determine whether the business survives the uncertainty that remains.
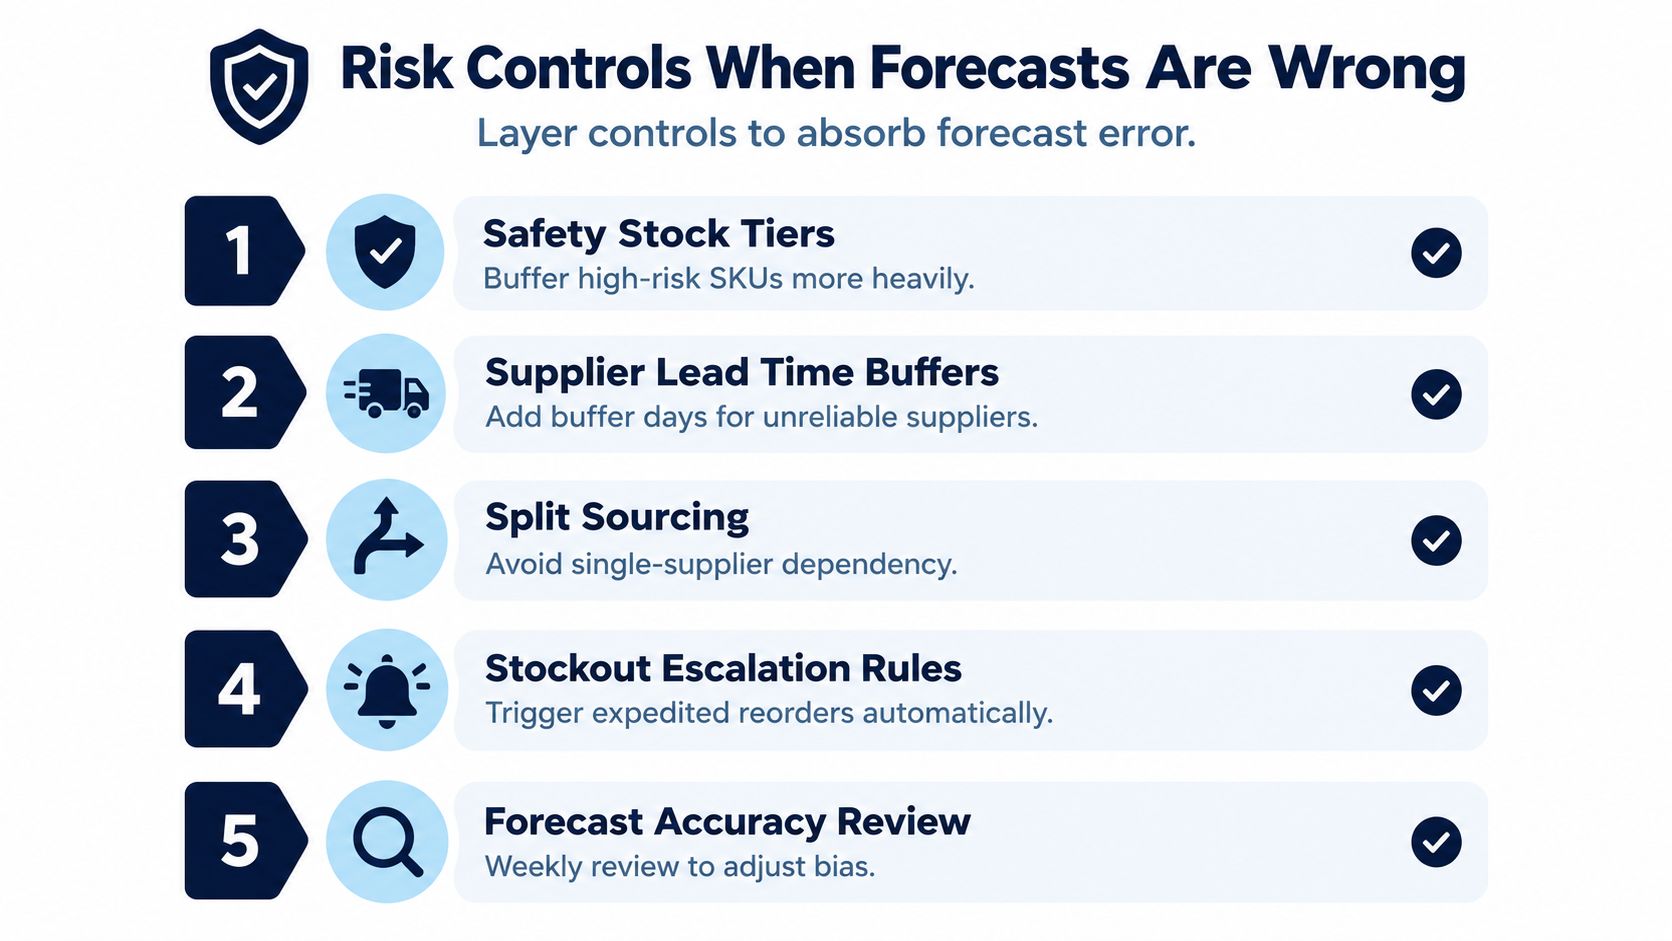
Use four controls tied to four failure modes:
A buffer prevents a demand shock from becoming a stockout. A qualified secondary supplier limits the damage from a factory disruption. A playbook stops teams from improvising expensive decisions under pressure. A cash cap prevents one optimistic forecast from consuming the funds needed for payroll, freight, and existing obligations.
Loss prevention also belongs in the control layer. If shrinkage or access failures distort physical counts, browse Systec's loss prevention solutions for ideas on protecting the inventory record at the warehouse and point of sale. The technology isn't a substitute for cycle counts, but it can support the control environment around them.
Use an exception process, not endless manual checking. The stockout prevention framework should lead to named escalation rules, clear channel priorities, and a documented response when actual demand diverges from plan.
Practical rule: Don't ask whether the forecast is right. Ask which control activates when it's wrong.
Review forecast bias weekly for high-risk demand classes. If actual sales consistently exceed plan, raise the forecast or buffer. If the forecast runs high, don't hide the error inside another purchase order. Reduce exposure, investigate the driver, and decide whether the SKU needs a controlled exit.
Don't attempt a full systems transformation while your SKU master is unreliable. Roll the operating model out in sequence so every new layer rests on data the team can trust.
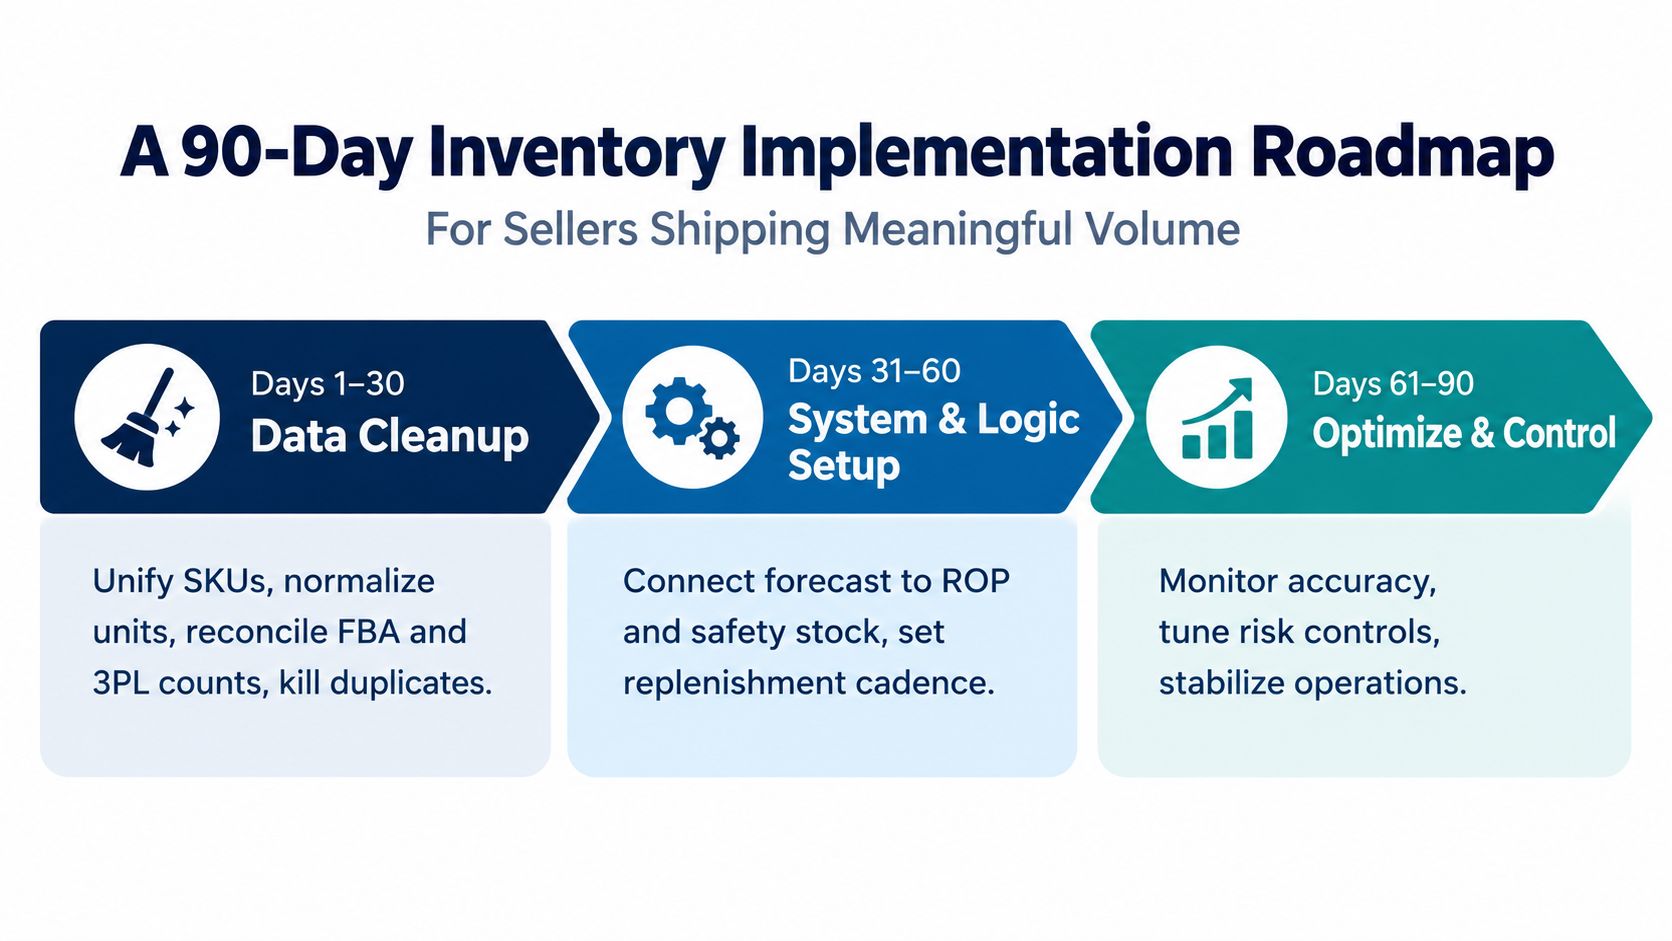
Unify SKU identifiers across Amazon, Shopify, wholesale, FBA, and the 3PL. Normalize units of measure, reconcile physical counts against system counts, remove duplicate or orphaned listings, and separate bundles from component inventory. Don't automate a discrepancy you haven't explained.
Build the weekly dashboard. Start with sell-through, weeks of cover, fill rate, turn, inbound status, and open-PO exposure. Give every threshold an owner and a response, such as expedite, transfer, reduce advertising, cap a channel, or defer a purchase order.
Pilot forecasting by demand class. Use a simple method for stable SKUs, a more responsive method for changing demand, and a separate launch or promotional process where history doesn't apply. Benchmark MAPE against the legacy process using consistent time windows and exclusions.
Connect reorder points and safety stock to system-triggered purchase orders, while keeping approval gates for large buys, unusual MOQs, and constrained cash periods. Schedule the first 30-day review before automation becomes invisible.
At that checkpoint, ask:
Extend the layer that produces clean decisions. Pause the layer that creates noise. Rework any automation that triggers without a clear owner or economic rationale.
Million Dollar Sellers gives serious ecommerce operators a private peer environment for comparing decisions around forecasting, safety stock, SKU management, warehouse operations, and Amazon inventory constraints. If you're rebuilding the system across FBA, DTC, and wholesale, visit Million Dollar Sellers to learn how the community supports operators working through these problems at scale.
Join the Ecom Entrepreneur Community for Vetted 7-9 Figure Ecommerce Founders
Learn MoreYou may also like:
Learn more about our special events!
Check Events