


Stay Updated with Everything about MDS
Thank you! Your submission has been received!
Oops! Something went wrong while submitting the form.
Chilat Doina
November 22, 2025
Inventory turnover is one of those core financial metrics that tells you how many times your business sells through and replaces its entire stock over a specific period—usually a year. Think of it as a scorecard for how fast you're moving products and how well you're managing your inventory.
Simply put, a higher number generally means you're selling products quickly. A lower number? That suggests your stock is sitting on the shelves for way too long.
Let's cut through the accounting jargon. Imagine you run a busy restaurant. Your inventory isn't just one big pile of stuff; it's a living, breathing collection of fresh ingredients like vegetables, meat, and spices.
If you buy a truckload of tomatoes but only use a handful each day, most of them will spoil. That’s just cash and space down the drain. This is a classic case of low inventory turnover.
Now, picture a kitchen where fresh ingredients arrive just in time to be prepped for the night's most popular dishes. The tomatoes are always perfect, the storage room isn't overflowing, and your cash isn't tied up in food that might go bad. That's the dream: high inventory turnover.
At its heart, inventory turnover is a simple but powerful way to measure how efficiently you manage the flow of your products. It answers a critical question for any ecommerce business: "How quickly are we turning our stock into actual sales?"
This single number acts as a vital sign for your operational health. It can flag potential issues long before they turn into full-blown crises. For instance:
Inventory turnover is a key financial metric that measures how efficiently a company manages its inventory by showing how many times it sells and replaces its stock over a specific period, typically a year.
The standard formula is refreshingly straightforward: Inventory Turnover Ratio = Cost of Goods Sold (COGS) / Average Inventory.
For example, if your business has a COGS of $4,150,000 and your average inventory value is $498,000, your ratio is 8.33. This means you sold and replenished your entire stock about 8.33 times during the year. You can dig deeper into how this calculation works on Omneelab.
To quickly break down the key parts of this metric, here's a simple table.
This table helps put the pieces together, showing how each component contributes to a complete picture of your inventory's health.
For Amazon sellers and direct-to-consumer (DTC) brands, getting a handle on inventory turnover isn't just an academic exercise—it’s a matter of survival. This metric has a direct line to everything from your cash flow and storage fees to your bottom-line profitability.
Mastering it gives you the clarity to make smarter purchasing decisions, optimize your working capital, and build a more resilient, profitable business. It's the foundation for shifting from reactive stock management to a proactive growth strategy.

Alright, now that you’ve got the concept down, it’s time to roll up your sleeves and figure out your own inventory turnover ratio. This isn't just a theoretical exercise; it’s a hands-on process that gives you the hard data you need to start making smarter, more profitable decisions.
There are two main ways to run the numbers. While both get you an answer, one is considered the gold standard because it gives you a much clearer, more accurate picture of how your business is actually performing.
Let’s break them down.
The most accurate and universally recommended way to calculate your turnover ratio is by using your Cost of Goods Sold (COGS). This method is superior for one simple reason: it compares apples to apples. Both your COGS and your inventory are valued at cost, which strips out any confusing noise from profit margins. It's a pure look at your operational efficiency.
The formula itself is pretty straightforward:
Inventory Turnover Ratio = Cost of Goods Sold (COGS) / Average Inventory
To get there, you’ll need to pull two key numbers from your accounting records:
You can find your average inventory with this quick calculation:
Average Inventory = (Beginning Inventory + Ending Inventory) / 2
Let's walk through an example to see it in action.
COGS Method Example
Imagine an online electronics store wants to calculate its turnover for last year.
First, they need to find their average inventory:
($60,000 + $40,000) / 2 = $50,000
Now, they just plug everything into the main formula:
$300,000 (COGS) / $50,000 (Average Inventory) = 6
The store’s inventory turnover ratio is 6. In plain English, this means they sold through and completely replaced their entire inventory six times over the course of the year.
There’s another way to do this using your total sales revenue instead of COGS. While it's an option, this method is generally less accurate for judging how well your operations are running. Why? Because you're comparing sales (at retail price) with inventory (at cost). The profit margin baked into the sales number can really skew the result, often making your turnover look better than it actually is.
The formula looks like this:
Inventory Turnover Ratio = Sales / Average Inventory
Honestly, you should only use this method if you absolutely can't get your hands on the COGS data. If you want to dive deeper into the pros and cons, you can learn more about how to calculate the inventory turnover ratio and which method makes the most sense for you.
Knowing your turnover ratio is great, but you can unlock even more insight by turning that number into a timeline. That’s where Days Sales of Inventory (DSI) comes in. It’s also called Days of Inventory Outstanding (DIO), and it tells you the average number of days it takes for you to sell through your entire stock.
This simple calculation puts your turnover ratio into a real-world context that's incredibly easy to grasp. Here's the formula:
DSI = 365 Days / Inventory Turnover Ratio
Let’s go back to our electronics store, which had a turnover ratio of 6.
365 / 6 = 60.8 days
This tells us that, on average, a product sits on the shelf for about 61 days before someone buys it. This is a game-changer for planning cash flow, spotting slow-moving duds, and figuring out when to reorder. It takes your turnover ratio from an abstract number to an actionable deadline.
So you've calculated your inventory turnover ratio. The first question that probably pops into your head is, "Is this number any good?"
The honest-to-goodness answer? It depends.
There’s no magic number that works for every single business. A "good" turnover rate is completely tied to your industry.
Think about it this way: a high-end dealership selling luxury cars would go out of business trying to match the turnover rate of a grocery store selling bananas. The car dealer expects to move just a few high-ticket items a month. The grocer, on the other hand, needs to sell out of bananas every few days before they spoil.
This simple comparison gets right to the heart of it. Context is everything. What looks like stellar performance in one sector could be a five-alarm fire in another.
To figure out if your ratio is healthy, you have to see how it stacks up against others in your field. Different industries have their own unique supply chains, product lifecycles, and customer habits, all of which shape what a "normal" turnover rate looks like.
For instance, companies in the fast-moving consumer goods (FMCG) space live and die by thin margins and high volume. A healthy inventory turnover for them usually lands somewhere between 6 to 12 turns a year. Anything lower might signal they're overstocked, tying up cash and racking up storage fees. You can dig a bit deeper into how turnover rates vary by industry on Sortly.com.
Here’s a quick glance at what’s typical for a few common ecommerce sectors:
By looking at these benchmarks, you can get a much clearer picture of where your own business stands and start setting goals that actually make sense.
Beyond just your industry, your specific business model plays a huge role. An Amazon FBA seller and a direct-to-consumer (DTC) brand could be selling the exact same product but have completely different ideal turnover rates. It all comes down to their operational setup.
An Amazon seller is under pressure to keep turnover high to avoid those infamous long-term storage fees. A DTC brand with its own warehouse has a bit more breathing room. Understanding these nuances is key to setting goals that work for you.
When you're setting your targets, think about these factors:
Ultimately, finding the "right" turnover rate isn't about chasing some universal number. It’s about figuring out what’s both achievable and profitable for your corner of the market. It’s about setting a benchmark for your own operation and then consistently working to get better. This shifts your inventory turnover ratio from just another metric into a powerful tool for smart, strategic growth.
Your inventory turnover ratio isn’t just some number you calculate and forget. Think of it as a direct pipeline to your bank account. It tells the real story of how efficiently you’re turning products on your warehouse shelves into cash in your pocket. For any ecommerce business with growth aspirations, getting this right is non-negotiable.
A high turnover ratio is like a powerful financial engine for your business. When you sell through your stock quickly, you’re not just making sales—you're generating consistent cash flow. That means less of your capital is tied up in unsold boxes, freeing it up to pour back into marketing, new product development, or other big moves.
On the flip side, a low ratio can be a serious red flag. It’s a sign that your money is just sitting on shelves, collecting dust instead of earning a return. This sluggish movement doesn't just strain your finances; it quietly racks up costs and risks that can eat away at your profitability.
Picture your inventory as buckets of cash. With a high turnover, those buckets are constantly being emptied (sold) and refilled (restocked), keeping the money flowing. A low turnover means those buckets are stagnant, heavy, and frankly, expensive to maintain.
This has a direct domino effect on a few critical financial areas:
A healthy inventory turnover isn't about being busy; it's about being profitable. It directly influences your ability to maintain strong margins and optimize your working capital for sustainable growth.
Improving this metric is one of the most powerful levers you can pull for better financial health. For a deeper look at this, our guide on working capital optimization shows you how to make every dollar work harder for your business.
The image below gives you a bird's-eye view of how turnover rates vary across different industries, from groceries to cars.
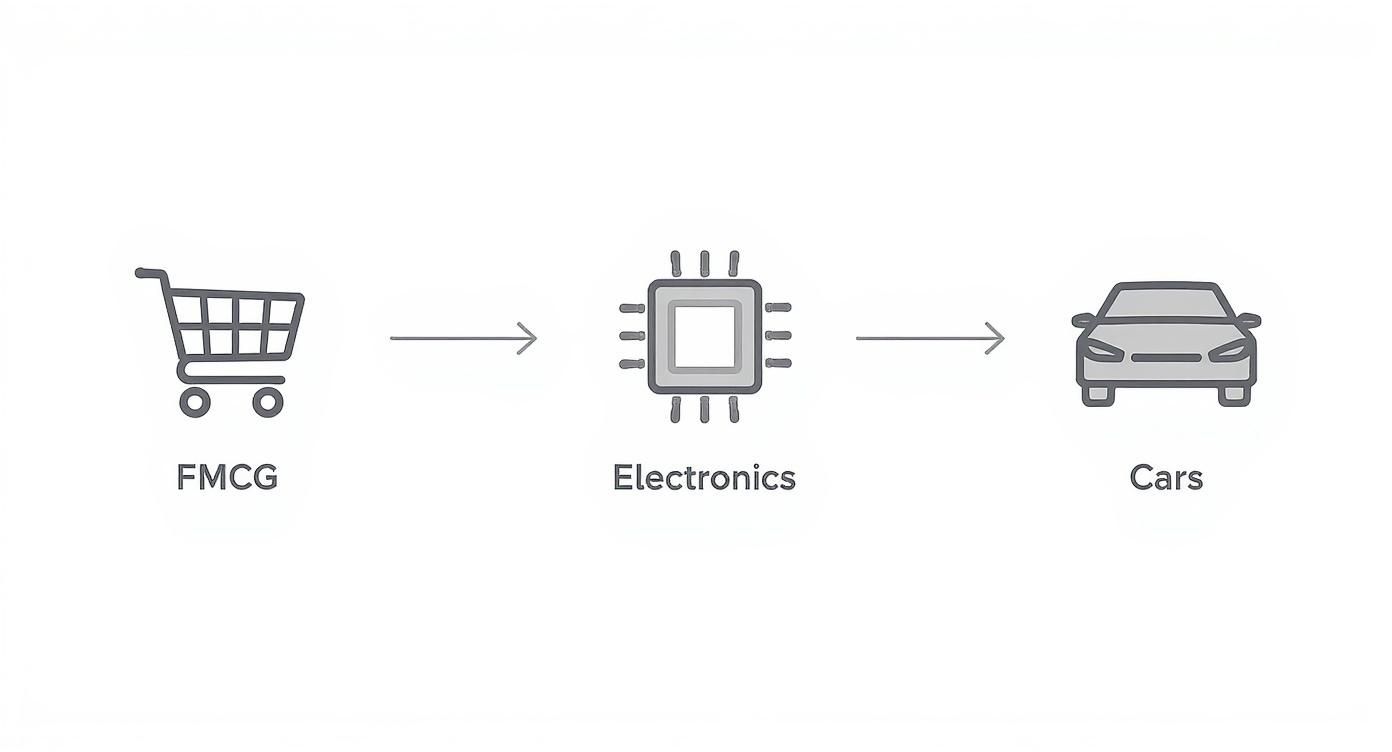
As you can see, what’s considered "fast" is all relative. It really hammers home the need to benchmark yourself against your specific industry, not some generic standard.
To make it even clearer, let's break down the tangible effects of a high versus a low turnover ratio. This isn't just theory; it's about real-world consequences for your business operations and finances.
Ultimately, a high turnover ratio signals a healthy, agile business that's in sync with its market. A low one often points to underlying issues in purchasing, marketing, or demand forecasting that need immediate attention.
Let’s put some real numbers to this. Imagine two online stores, "FastFashion" and "SlowStyle," and each starts the year with $50,000 worth of inventory.
By year's end, FastFashion has used its initial $50,000 investment to generate $400,000 in sales (at cost). SlowStyle, working with the exact same starting capital, only managed to support $100,000 in sales.
The difference in cash flow, profit potential, and growth capacity is massive. And it all stems from that one core metric. This is exactly how inventory turnover shapes your bottom line.
Okay, you get what inventory turnover is and why it matters to your bottom line. That's the first step. Now, it’s time to actually do something about it.
Improving this metric isn’t about guesswork or crossing your fingers. It’s about putting a series of smart, targeted strategies into play that fundamentally change how you manage your stock.
Boosting your turnover ratio is a powerful way to free up cash, slash carrying costs, and build a much more resilient ecommerce business. Think of this as a playbook—proven tactics you can start using today to turn your inventory from a liability into a high-performing asset.
The absolute foundation of great inventory turnover is knowing what your customers want before they do. Inaccurate forecasting is the number one reason brands get stuck with too much or too little stock, and both scenarios will wreck your ratio. It’s time to graduate beyond just looking at last year's sales.
Modern tools let you get much more granular, analyzing seasonality, market trends, and the ripple effects of your promotions. When you can anticipate demand more effectively, you can order just enough to hit your sales goals without tying up a boatload of cash in products that just sit there.
An accurate forecast is your best defense against dead stock. It allows you to align your purchasing decisions with real customer behavior, ensuring you invest your capital in inventory that is almost certain to sell.
This proactive approach is what stops the slow, costly buildup of products that drag your turnover rate through the mud.
Let's be real: not all your products fly off the shelves at the same speed. For the ones that are gathering dust, a well-planned pricing strategy is the kick in the pants they need. And no, this doesn't always mean profit-killing discounts.
Consider these tactical moves:
The whole point is to strategically juice demand and turn that stagnant inventory back into cash you can actually use.
Not all of your inventory is created equal. The ABC analysis is a powerful inventory management technique that forces you to acknowledge this reality. It works by categorizing products based on how much value they bring to your business.
Typically, you'll break your inventory into three buckets:
By sorting your inventory this way, you can focus your time and money where it counts most. You ensure your bestsellers are always ready to ship while you strategically manage—or get rid of—everything else. To see how this fits into a bigger picture, check out these inventory management best practices.
The time it takes for your supplier to get an order to your warehouse—the lead time—has a massive impact on how much stock you need to keep. Long, unpredictable lead times force you to hold extra "safety stock" just in case, which is a guaranteed way to lower your turnover ratio.
Start working on building stronger, more collaborative relationships with your suppliers. A simple phone call and open communication can lead to better terms, more reliable delivery schedules, and even faster shipping options.
When you can successfully negotiate shorter lead times, you can operate with a much leaner inventory. If you know you can get new stock quickly and predictably, you can keep less of it on hand without risking stockouts. This is one of the most direct and effective ways to boost your inventory turnover.
As you start working inventory turnover into your business reporting, a few questions almost always pop up. The formula itself is simple, but the metric has some nuances that can be tricky when you're first getting started.
Think of this section as your final debrief. We’ll tackle the most common “what ifs” and “how-tos” so you can walk away ready to use this metric with confidence.
It sounds a bit backward, but yes, your inventory turnover can absolutely be too high. A high number usually gets a round of applause—it signals strong sales and lean operations. But an exceptionally high figure can mean you're sailing a little too close to the wind.
An extremely high ratio is often a symptom of having too little inventory to meet demand. This is a one-way ticket to stockouts. When a customer lands on your product page only to see that dreaded "out of stock" message, they don't stick around. They head straight to a competitor. In fact, one survey found that 37% of shoppers will simply buy from another brand if their first choice is unavailable. That’s a lost sale and, very possibly, a lost customer for good.
An unusually high turnover rate can be a red flag for insufficient stock. While it looks good on paper, it often translates to missed sales opportunities and unhappy customers who are forced to shop elsewhere.
On top of that, a sky-high turnover might mean your purchasing strategy is inefficient. You could be placing a ton of small, frequent orders to keep inventory lean, but that approach has its own hidden costs. You're likely missing out on bulk purchasing discounts from suppliers and racking up way more in shipping and admin costs than you need to. The goal isn't just to move products fast; it's to do it profitably.
The sweet spot is a balanced turnover rate that keeps sales humming and costs low, without constantly risking a stockout on your bestsellers.
Seasonality is a huge one. If you don't account for it, it can completely throw off your inventory turnover calculations and give you a distorted picture of your business. For any brand with predictable peaks and valleys—like a company selling swimwear in the summer or holiday decor in the winter—using a simple annual average is flat-out misleading.
Imagine a gift shop that does most of its business in the fourth quarter. If they calculate their average inventory using only their stock levels on January 1st and December 31st, the number will be skewed. Their inventory on December 31st will be at its lowest point right after the holiday rush, which will artificially pump up the turnover ratio for the year. It'll look way better than reality.
To get a number you can actually trust, you need to smooth out those seasonal bumps.
Instead of a simple two-point average, try one of these methods:
This approach gives you a much truer sense of your inventory efficiency across the entire year, not just at two random points. It properly accounts for the inventory buildup before your peak season and the sell-down that follows, giving you a metric you can actually use to make decisions.
Manually tracking inventory in a spreadsheet might cut it when you’re small, but it quickly becomes a major bottleneck to growth. To really get a handle on your inventory turnover, you need tools that deliver real-time data and automation.
For small businesses that are starting to scale, modern accounting software often has some surprisingly solid inventory features built right in.
Once your business and product catalog really start to grow, you’ll need something more specialized. A dedicated Inventory Management System (IMS) is built for this exact purpose, giving you a whole suite of advanced features to optimize your stock.
Platforms like Cin7, Zoho Inventory, or NetSuite offer powerful capabilities, such as:
These systems provide the detailed data you need to run an ABC analysis, flag your slow-moving products, and make smart decisions that directly boost your turnover ratio. For even larger operations, an Enterprise Resource Planning (ERP) system integrates inventory into a single platform that covers every part of the business. Picking the right tool for your current stage is a critical step in turning inventory management from a chore into a competitive advantage.
At Million Dollar Sellers, we believe that mastering metrics like inventory turnover is what separates good e-commerce businesses from great ones. Our exclusive community is built for top-tier founders who are serious about scaling smarter and faster. If you're ready to connect with a network of proven 7-, 8-, and 9-figure sellers and gain access to the strategies that are working right now, we invite you to learn more. Discover the power of a true peer network at https://milliondollarsellers.com.
Join the Ecom Entrepreneur Community for Vetted 7-9 Figure Ecommerce Founders
Learn MoreYou may also like:
Learn more about our special events!
Check Events.svg)
.svg)
.svg)

.svg)