
Chilat Doina
June 4, 2026
Your dashboard says acquisition is working. Shopify orders are up, Amazon sales look healthy, and Meta still shows an acceptable return. Then cash gets tight, contribution margin shrinks, and finance tells you customer growth isn't nearly as profitable as marketing thinks it is.
That usually comes down to one problem. The customer acquisition cost calculation is too shallow.
Most brands track some version of ad spend divided by new customers. That's fine for a quick pulse check. It's not enough to run an e-commerce business with confidence. If you want a number you can budget against, use in board conversations, and trust when you scale, you need a fully loaded view of CAC, channel by channel, with Amazon handled separately instead of lumped into a blended average.
The fastest way to fool yourself on profitability is to treat CAC like a media-buying metric. It isn't. A proper customer acquisition cost calculation starts with the standard formula, but the actual work is deciding what belongs in the numerator.
Authoritative guides don't all draw the line in the same place. Some limit CAC to costs tied directly to acquiring new customers, while others recommend including indirect items like content creation, onboarding, overhead, and technology allocation for a truer view of acquisition economics, as noted by Maxio's CAC overview.
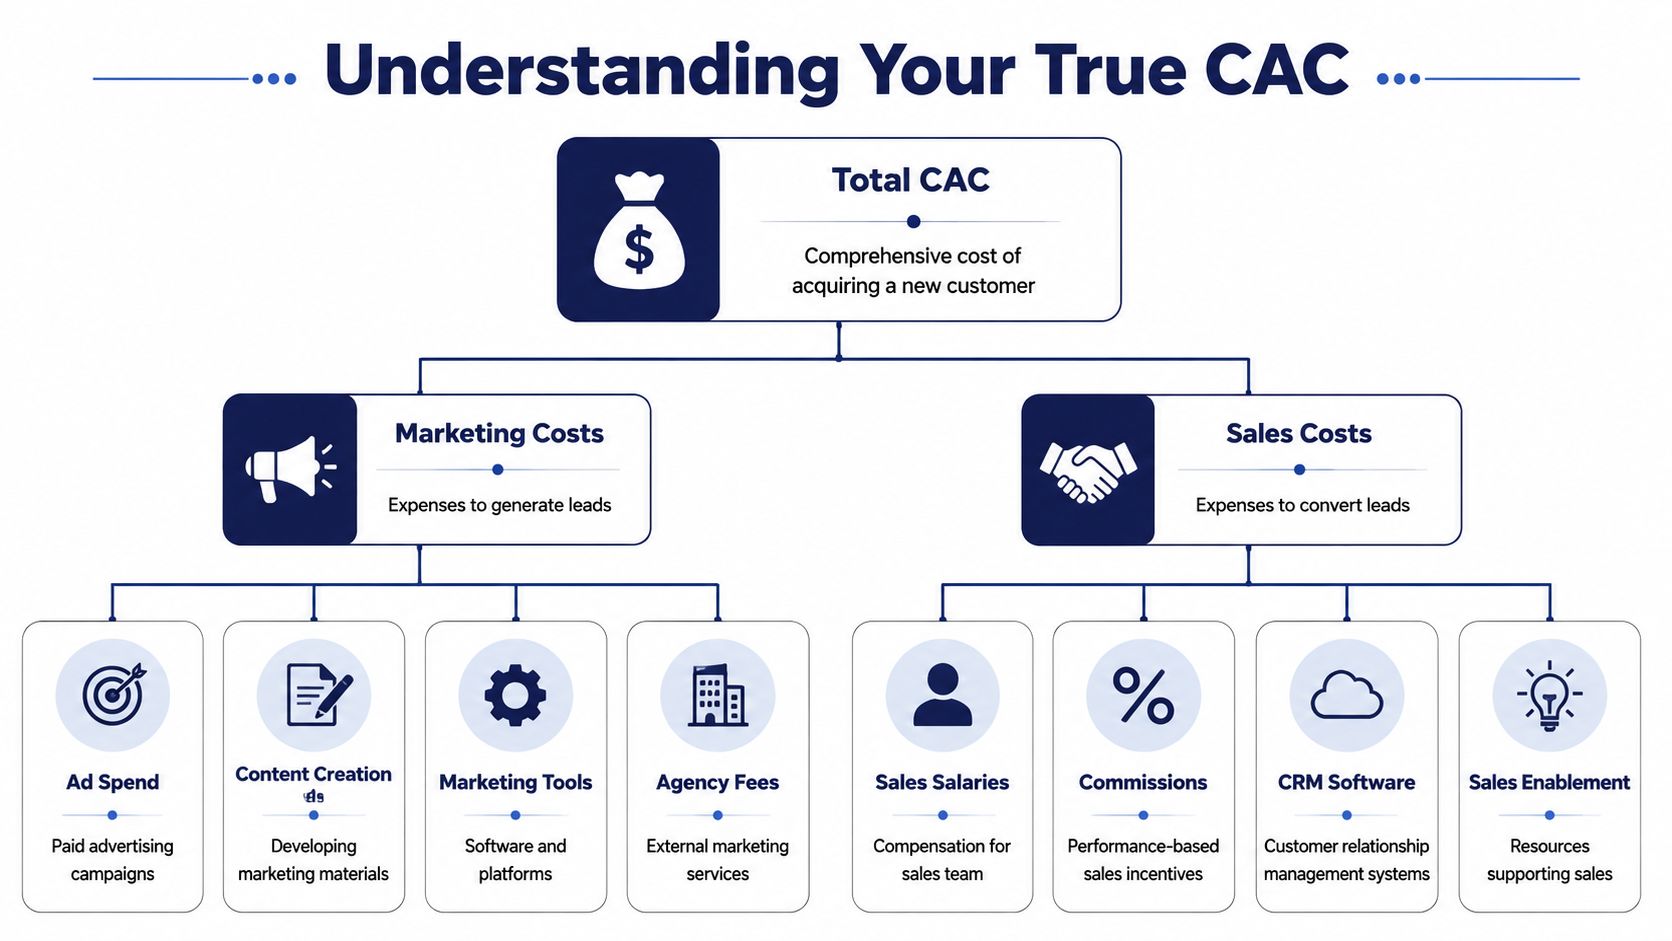
Founders usually remember paid media. They often miss the expenses sitting one layer deeper in the P&L.
A practical fully loaded CAC usually includes:
Practical rule: If the cost exists because you're trying to acquire new customers, it deserves a hard look before you exclude it.
Many operators get stuck at this point. They want a clean metric, so they strip CAC down to only ad spend. That creates a neat number and a bad decision framework. You'll approve channel scale that looks profitable in Ads Manager but fails once labor, tools, and support costs show up in the actual business.
You don't need one CAC number. You need at least two.
| View | What it includes | Why it matters |
|---|---|---|
| Media CAC | Direct ad spend only | Fast channel monitoring |
| Fully loaded CAC | All acquisition-related sales and marketing costs | Real financial decision-making |
I've found that operators move faster when both live side by side. Media CAC helps the growth team react quickly. Fully loaded CAC keeps leadership honest about whether scale is creating value.
If Amazon is a major part of your mix, it also helps to compare platform-specific acquisition economics with your wider unit economics framework, because marketplace traffic can make blended numbers look stronger than they really are.
For brands trying to improve Amazon efficiency specifically, this breakdown pairs well with practical strategies to lower CPA on Amazon, especially when ad costs, promotions, and marketplace fees start overlapping in ways a simple CAC formula won't capture.
The formula itself is simple. The discipline around it is where many organizations falter.
A foundational rule in customer acquisition cost calculation is that CAC equals total sales and marketing expenses divided by the number of new customers acquired in the same period, and Amplitude's guide gives a clear example: if a company spent $100,000 in a month and acquired 500 new customers, CAC would be $200 per customer in that month, per Amplitude's CAC guide.
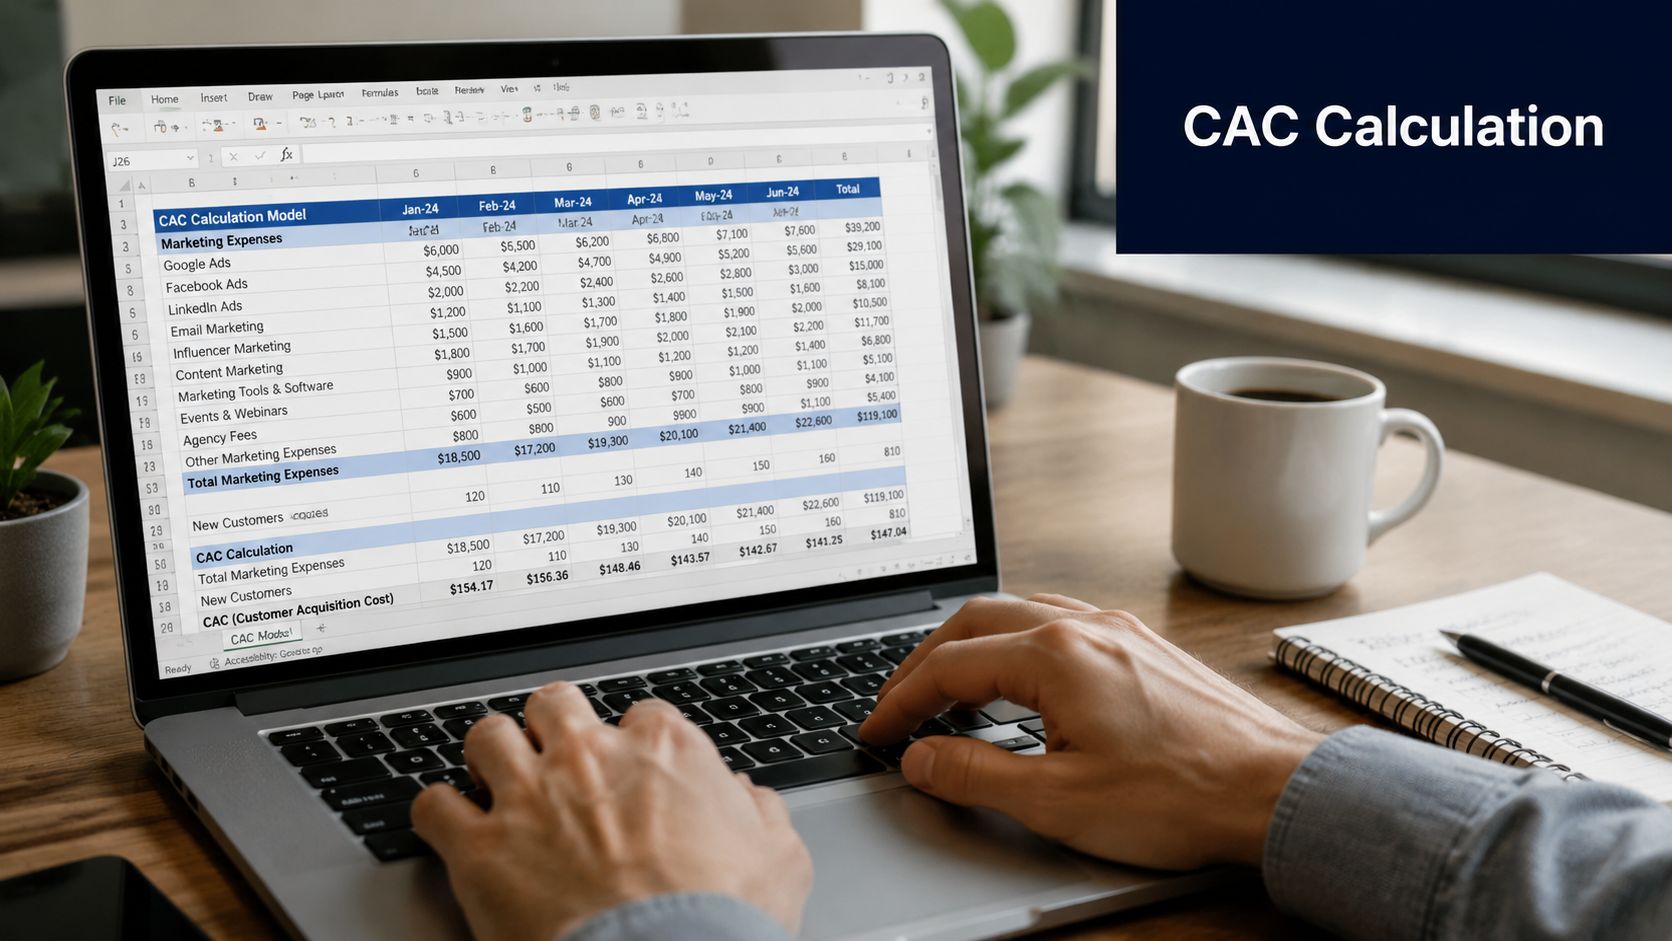
Don't build this as a marketing report. Build it like a finance operating sheet.
Use one tab for costs and one tab for new customers. Keep the date range identical across both. Monthly works for most brands because it aligns with payroll, retainers, software invoices, and ad platform billing.
Your spreadsheet needs these fields:
A clean layout looks like this:
| Period | Channel | Cost type | Amount | New customers | CAC |
|---|---|---|---|---|---|
| Month | Meta | Ad spend | Enter value | Enter count | Amount / New customers |
| Month | Ad spend | Enter value | Enter count | Amount / New customers | |
| Month | Blended | Salaries, tools, agencies, ads | Total value | Total new customers | Total costs / Total new customers |
The denominator has to be new customers acquired in the same period as the costs.
That sounds obvious, but it's where teams break the model. Marketing exports customer counts from one dashboard. Finance pulls costs from the P&L on a slightly different cutoff. Amazon is on settlement timing. Shopify is on order date. Suddenly the formula is technically right and operationally wrong.
If the date logic doesn't match, the CAC number is noise with formatting.
For DTC, define a new customer once and lock the logic. Usually that means first-time purchasers in Shopify or your source of truth. For omnichannel brands, you may need separate counts for DTC, Amazon, and retail-supported acquisition to avoid double counting.
A useful practice is to add three customer rows beneath the total:
That forces reconciliation before anyone starts celebrating “efficient” spend.
The spreadsheet should answer three questions fast:
For teams that want another founder-level reference point on building the model itself, this founder's guide to CAC is a useful companion because it keeps the focus on decision quality instead of dashboard cosmetics.
A blended CAC can look healthy while one channel burns cash.
That's the trap with company-wide averages. Existing guidance often stops at the formula and doesn't fully address how to compare CAC across paid social, Amazon, email, and affiliate when attribution is incomplete or channels have different payback periods. Yotpo also notes that a low blended CAC can mask an unprofitable paid channel, which is exactly why operators need segmentation, not just a headline average, in Yotpo's discussion of CAC formula limits.
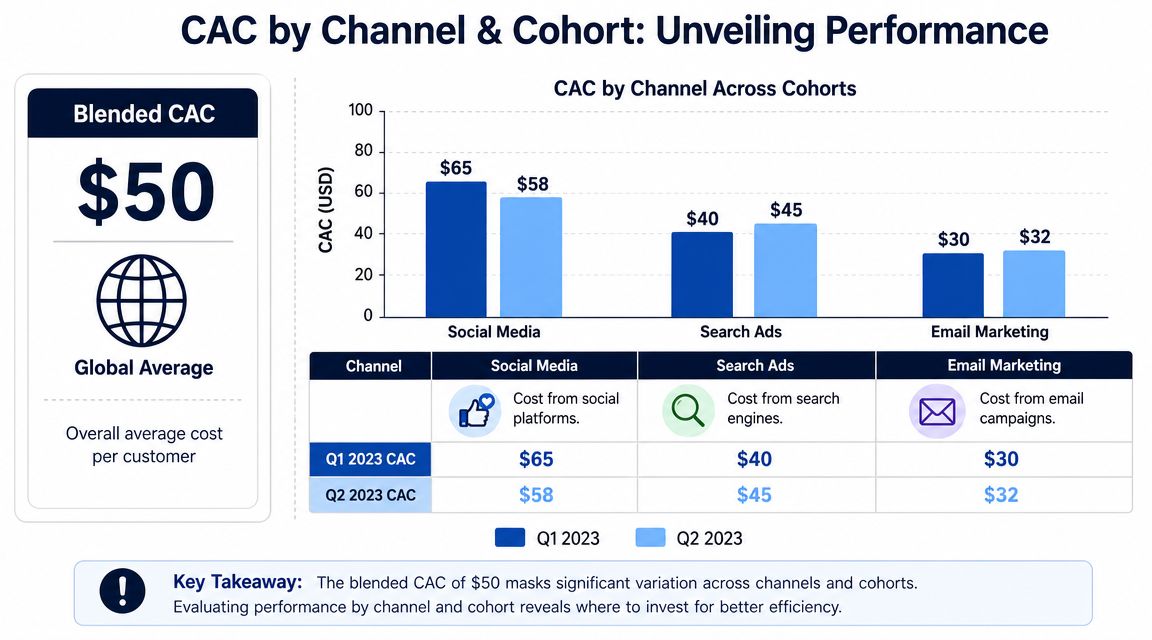
Blended CAC is useful for board-level reporting and high-level trend tracking. It's weak as an optimization tool.
The issue isn't just attribution. It's economics. Email might appear wildly efficient because it monetizes demand created elsewhere. Amazon may convert well because customers already know the brand. Paid social may be doing most of the heavy lifting at the top of funnel and look worse if you judge it in isolation. None of that means you should stop measuring by channel. It means you should measure with judgment.
Here's the practical way to split the view:
| Lens | Use it for | Watch out for |
|---|---|---|
| Blended CAC | Company-wide budgeting | Hides weak channels |
| Channel CAC | Media allocation decisions | Attribution gaps |
| Cohort CAC | Tracking efficiency over time | Delayed conversion windows |
Review channel CAC weekly if spend is moving fast. Review cohort CAC monthly. The weekly view helps buyers cut waste and push budget into channels that are converting now. The cohort view tells you whether acquisition quality is improving or getting worse.
A few examples of what cohort cuts reveal:
Don't ask whether one channel has the best CAC. Ask which channel produces acceptable CAC for the kind of customer it brings in.
You won't get perfect attribution. That's not a reason to avoid channel-level CAC.
Use what you can trust. Start with platform-level last-touch reporting for directional management. Reconcile that against backend new-customer data. Then classify channels into three buckets:
Email often belongs in the third bucket for mature brands. Amazon often belongs in the first two at the same time, depending on whether branded search, DSP, or external traffic is involved. Affiliate can swing either way depending on coupon behavior and incrementality.
The goal isn't theoretical purity. The goal is to stop one average from hiding where your real margin is coming from.
Amazon changes the customer acquisition cost calculation because the platform compresses traffic, conversion, and fee structure into one operating environment. If you treat Amazon CAC the same way you treat DTC Meta spend, you'll either undercount real acquisition costs or overstate what your ads are doing.
Most sellers default to PPC spend divided by orders. That can be useful as a tactical ad metric. It's not enough for founder-level decision-making.
On Amazon, your acquisition picture usually involves:
I don't include standard fulfillment and referral fees inside CAC by default if I'm trying to isolate acquisition efficiency. I do include them when I'm pressure-testing total contribution by channel. Those are two different questions, and operators get into trouble when they mix them.
Amazon rewards clean separation between ad efficiency and total channel profitability.
A practical setup is to maintain two views:
| Amazon view | What it answers |
|---|---|
| Acquisition CAC | What did it cost to generate a new Amazon customer |
| Contribution by order | After fees and fulfillment, did the order leave enough gross profit |
That second view matters because Amazon can produce strong conversion while still squeezing margin through fees and promo mechanics. If you want a deeper handle on the ad side specifically, this breakdown of Amazon advertising costs is useful when you're separating spend mechanics from broader channel economics.
Amazon makes CAC harder because not every order is a first-time customer. Some campaigns harvest existing demand. Others introduce the brand to new buyers. If you don't separate those behaviors, your CAC analysis gets muddy fast.
Many advanced sellers construct an Amazon-specific view based on:
The practical question isn't whether Amazon ads “work.” It's whether they are bringing in incremental customers at a cost structure that your product margin can support.
A strong operator also watches how Amazon promotions distort the picture. A coupon may improve conversion and lower apparent ad-driven acquisition cost while dragging down actual order profitability. A rank push may make sense strategically for a limited window, but it shouldn't be mistaken for steady-state CAC.
This walkthrough adds useful context before you build that model:
Before approving more Amazon spend, ask:
That checklist catches more bad scale decisions than another dashboard ever will.
CAC by itself doesn't tell you much. A high CAC can be fine in a category with strong repeat purchase behavior. A low CAC can still be bad if customers don't come back, churn quickly, or buy once on discount and disappear.
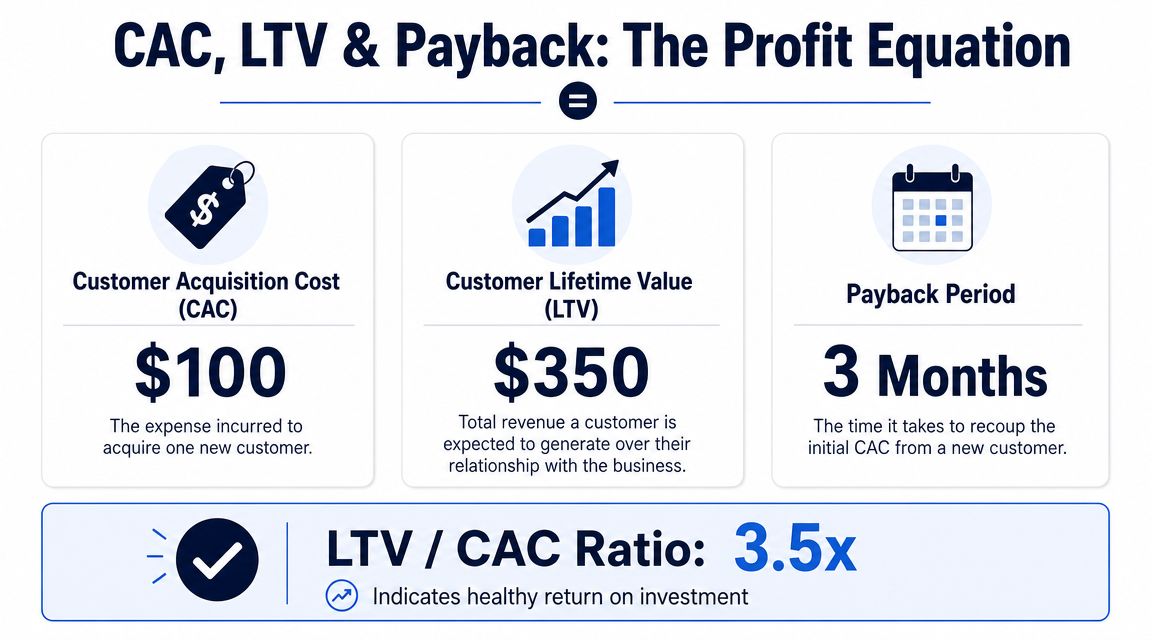
The benchmark most operators use is the 3:1 LTV-to-CAC ratio. Paddle describes this as a business aiming to generate three dollars of customer lifetime value for every one dollar spent to acquire that customer, and it also frames CAC at roughly 33% or less of average customer lifetime value as the same relationship in Paddle's CAC resource. That benchmark matters because once CAC rises above roughly one-third of LTV, growth can become uneconomic even if revenue is still climbing.
Don't use the ratio as a slogan. Use it as a filter.
If your LTV-to-CAC relationship is comfortably above that benchmark, you usually have room to scale, test, and absorb some acquisition volatility. If it's close to the line, you need tighter controls around channel mix, offer structure, and retention. If it's below the line, top-line growth can still look good while the business gets weaker.
The best CAC number in the room is useless if the customer never repays it.
LTV tells you whether the customer is worth acquiring. Payback period tells you whether you can afford the wait.
This matters most for inventory-heavy businesses and brands with long replenishment cycles. You may have a perfectly acceptable lifetime value relationship and still strain cash because recovery takes too long. That's why founders shouldn't stop at “is CAC profitable.” The sharper question is “how fast does gross profit from this customer cover the acquisition outlay.”
A simple operating framework:
For founders trying to connect CAC to broader break-even thinking, this guide to understanding e-commerce profitability is a useful complement because it forces the conversation beyond ad metrics and into actual financial durability.
The leadership view should fit on one page:
| Metric | What it tells you |
|---|---|
| Blended CAC | Cost to acquire a customer across the business |
| LTV to CAC | Whether growth is economically sound |
| Payback period | Whether growth is cash-flow-friendly |
That combination turns customer acquisition cost calculation from a marketing report into a capital allocation tool.
Most CAC problems aren't math problems. They're process problems.
A rigorous CAC calculation should be done over a fixed time window and include all acquisition-related spend that appears in the P&L, and Wall Street Prep points out the common failure mode: denominator mismatch, where customer counts come from a different system or date range than the cost data, making CAC misleading even when the formula itself is correct in Wall Street Prep's CAC explanation.
Here are the errors I see most often.
Use a simple governance rule. One owner defines the reporting window, one owner validates cost inclusion, and one owner signs off on the new-customer count.
Then build a recurring review around exceptions, not just totals:
| Problem | Fix |
|---|---|
| Date mismatch | Lock a single reporting calendar across finance and marketing |
| Missing costs | Reconcile CAC inputs against the P&L every period |
| Poor segmentation | Split blended, channel, and marketplace views |
| Bad customer counts | Use backend first-order logic and reconcile it monthly |
| Lazy optimization | Tie CAC review directly to channel budget changes |
A CAC number only helps if someone can act on it this week.
Founders often jump straight to cutting spend. That's rarely the best first move. Better operators improve the system around the spend.
A few reliable levers:
If you want a practical playbook that focuses on improving the number instead of just measuring it, this guide on how to lower customer acquisition cost is worth keeping in your operating stack.
The brands that scale cleanly don't treat CAC like a static KPI. They treat it like a live operating constraint. Every campaign, hire, tool, offer, and marketplace decision either improves acquisition efficiency or steadily erodes it. The sooner your reporting reflects that reality, the better your growth decisions get.
If you're building at a serious level and want to compare notes with operators who've already solved these problems across Amazon, DTC, and omnichannel, Million Dollar Sellers is where those conversations happen. It's an invite-only community of high-performing e-commerce founders who share the financial frameworks, channel insights, and real operating decisions most brands never get access to.
Join the Ecom Entrepreneur Community for Vetted 7-9 Figure Ecommerce Founders
Learn MoreYou may also like:
Learn more about our special events!
Check Events