Chilat Doina
November 24, 2025
When you hear "customer lifetime value" or CLV, what comes to mind? Too often, it’s treated as just another bit of business jargon. But in reality, CLV is a fundamental shift in how you think about your business—moving from chasing short-term sales to building long-term, profitable relationships.
It's not about what a customer spent yesterday. It’s about forecasting their future worth, giving you a powerful lens to make smarter decisions for tomorrow.

So many e-commerce brands fall into the trap of obsessing over daily sales numbers and customer acquisition cost (CAC). While you definitely need to watch those metrics, they only tell you part of the story.
A singular focus on getting new customers, without knowing their long-term potential, can lead you down a dangerous path. You end up spending a ton of money acquiring shoppers who buy once and then disappear. It’s the classic "leaky bucket" problem—you’re constantly pouring resources in just to stay afloat.
This is where CLV calculation changes the entire conversation. It forces you to move from a transactional mindset to a relational one. Instead of asking, "How do we get the next sale?" you start asking, "How do we create a customer who stays with us for years?" That pivot is what separates stagnant brands from those that achieve sustainable, profitable growth.
Once you get a handle on CLV, it provides an incredible framework for almost every strategic move you make. Knowing what a customer is truly worth over time lets you make smarter, more confident choices across your entire operation.
Think about how it reframes common business challenges:
By focusing on CLV, you are investing in the long-term health and profitability of your business. It's the ultimate north-star metric that ensures every dollar you spend is working to build a more resilient and valuable brand.
At the end of the day, a customer lifetime value calculation is much more than just an accounting exercise; it’s a strategic imperative.
It shines a spotlight on the true engine of your business: your loyal customer base. Mastering this metric allows you to move with precision, putting your resources where they’ll generate the highest return and building a brand that customers genuinely want to stick with. In a competitive world where acquiring new customers only gets more expensive, that's how you build a business that lasts.
Jumping into your first customer lifetime value calculation doesn't mean you need a PhD in data science or a subscription to some fancy analytics software. The best place to start is with the simple, historical model. It's straightforward, uses data you almost certainly have, and gives you a crucial baseline for what a customer is actually worth to your brand.
This approach boils CLV down to its most basic parts, making it accessible for any e-commerce brand ready to look beyond one-off sales numbers. It’s all about using past behavior to get a solid first guess at future value.
The traditional formula is a simple multiplication of three key metrics. Think of it as your first step in quantifying what really drives long-term revenue for your business.
To calculate your first CLV, you'll need to get a handle on a few core components of customer behavior. Each one tells a small part of a much bigger story about your relationship with your customers.
Here's a quick look at the building blocks for this calculation.
MetricWhat It MeasuresHow to Calculate ItAverage Purchase Value (APV)The typical amount a customer spends in a single order.Total Revenue / Total Number of PurchasesPurchase Frequency (F)How often the average customer makes a purchase from you in a given period.Total Number of Purchases / Number of Unique CustomersCustomer Lifespan (T)The average time a customer stays with your brand before churning.Average number of years a customer continues to purchase.
Putting these pieces together gives you that first, powerful estimate of customer value. This isn't some new-fangled metric; it’s a time-tested way for businesses, especially in e-commerce, to gauge the total revenue they can expect from an average customer.
For example, a customer who spends about $250 a year for two years might seem like a $500 customer. But if your average customer lifespan is five years, their estimated lifetime value is actually $1,250. That's a huge shift in perspective. If you want to see how other major players are using this, Shopify's blog has some great examples of how businesses adapt this formula.
Let's make this real. Imagine you run a direct-to-consumer brand called "Snack Provisions" selling gourmet snack boxes. You want to figure out your CLV using last year's data.
First, you pull the numbers from your sales dashboard:
Now, let's plug these into the formula's components.
With those numbers ready, the final calculation is a breeze:
CLV = $60 (APV) x 4 (F) x 3 (T) = $720
There you have it. This means that, on average, a new customer is projected to bring in $720 in revenue over their entire time with Snack Provisions.
The simple historical model is an awesome starting point, but it's not the final word. You have to know its strengths and its blind spots.
Key Takeaway: The real power of the simple CLV model is giving you a quick, directional snapshot of customer value. It's your first step toward smarter decisions on marketing spend and retention.
Its biggest pro is simplicity. You can knock this out in a spreadsheet with basic sales data, giving you a tangible number to anchor your strategy.
But it has some major limitations. This model assumes customer behavior never changes, which we all know isn't true. It doesn't account for shifts in buying habits, market trends, or the great work your team is doing to keep customers around longer.
Even more importantly, this basic formula is all about revenue, not profit. A customer who brings in a lot of revenue but also needs tons of support and returns half their orders isn't as valuable as they look. To get closer to the truth, you have to factor in your profit margins. Understanding the difference between top-line revenue and what you actually keep is critical, which is why you should also know what contribution margin is and how it affects your real profitability.
Think of this initial calculation as your launchpad. It gives you a vital baseline and sets the stage for more advanced methods—like predictive and cohort-based models—which we'll dig into next.
The simple historical CLV calculation gives you a solid starting point—a snapshot of past performance. But what if you could predict the future?
This is where CLV shifts from a backward-looking report card to a powerful forecasting tool. Predictive and cohort models are what get you there, offering a much deeper, more actionable view of customer value.
Predictive models use a customer's first few actions to forecast their long-term worth with surprising accuracy. Cohort analysis, on the other hand, groups customers by when they joined, revealing powerful trends in loyalty and spending over time.
Both methods help you understand not just what happened, but why it happened—and what’s likely to happen next. This flowchart gives you a quick way to decide which path makes the most sense based on how long you've been in business.
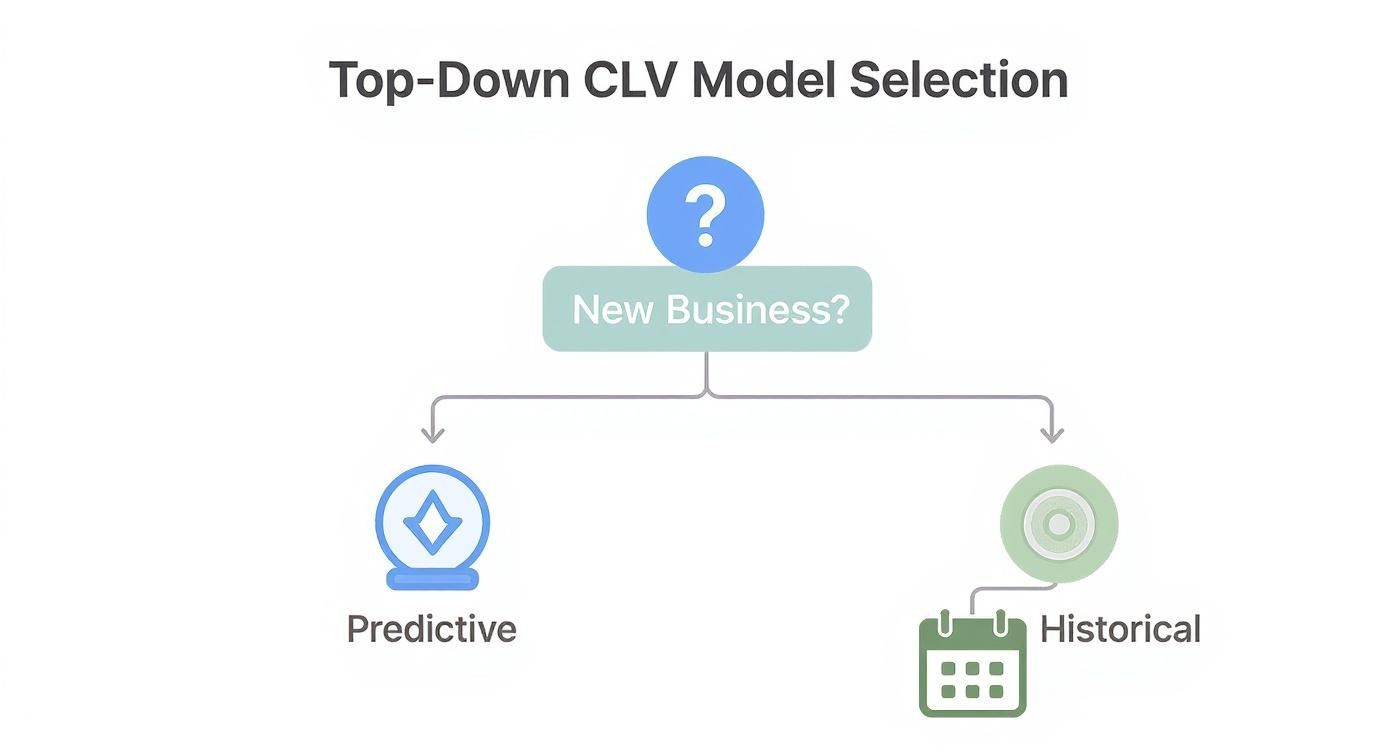
As you can see, newer businesses without much data really benefit from predictive models, while more established companies can get a lot of mileage out of historical analysis.
Predictive CLV is all about looking forward. Instead of relying on past averages, this method uses statistical models and machine learning to analyze those crucial early customer actions—their first purchase, the products they viewed, or how long they spent on your site—to project future spending. It's a lifesaver for new businesses that don't have years of data to lean on.
Think about it: two new customers each spend $50 in their first month. A historical model would call them even. But a predictive model might see that one customer browsed your most expensive product lines and used a referral code from a VIP. That's a strong signal they're on track to be a much more valuable customer down the road.
This approach lets you:
Predictive modeling turns your CLV calculation from a reactive report into a proactive game plan. It’s about making smarter bets on your customers based on their early signals, not just their transaction history.
While predictive models focus on the individual, cohort analysis is all about understanding group behavior. A cohort is just a group of customers who share a common trait. For CLV, the most common approach is grouping customers by the month or quarter they made their first purchase.
By tracking each cohort's spending over time, you can finally answer some critical questions:
Here's a quick example. A DTC coffee subscription brand is looking at two cohorts:
After six months, they see the February cohort has a 20% higher average order value and a 15% better retention rate. That insight is gold. It proves the partnership channel is delivering higher-quality customers, justifying a bigger investment in similar collaborations.
Both of these advanced models become infinitely more powerful when you start layering in financial data that goes beyond top-line revenue. A truly accurate CLV calculation has to account for profit.
There are two key metrics you need to incorporate:
Pulling this off requires more than a simple spreadsheet. You'll likely need to use SQL to query your database for cohort data or invest in a specialized analytics platform. When you're ready to get serious, check out the best predictive analytics software to find a tool that fits your needs. These methods provide the clarity you need to build a genuinely profitable and sustainable business.

Calculating your customer lifetime value is a huge step forward, but the number is practically meaningless on its own.
A $500 CLV sounds great, right? But what if it costs you $600 to acquire that customer? All of a sudden, you've got a very expensive problem on your hands. This is why the real magic happens when you connect CLV to your Customer Acquisition Cost (CAC).
This connection is the bedrock of a sustainable growth strategy. It shifts your perspective from just knowing what a customer is worth to truly understanding if your marketing engine is profitable. Without this context, you're flying blind, potentially pouring money into channels that are slowly bleeding your business dry.
Honestly, the relationship between what you spend to get a customer and what they spend with you over time is what separates the high-growth brands from the ones that eventually flame out.
The most powerful way to link these two metrics is through the CLV-to-CAC ratio. This simple calculation (just divide CLV by CAC) gives you a clear, immediate signal of your business's health and scalability. It tells you exactly how many dollars in lifetime value you get back for every single dollar you spend on marketing and sales.
Let's say your average CLV is $720 and your CAC is $240. Your ratio is 3:1. This is widely considered the gold standard for a healthy, scalable business. It means you’ve got an efficient model where you can cover acquisition costs, pay for overhead, and still generate a solid profit.
But what about other ratios?
Tracking this ratio is non-negotiable. It’s the ultimate measure of your marketing ROI and the clearest indicator of whether your business model is built for the long haul. It answers the most critical question you can ask: "Is our growth actually profitable?"
Calculating one overall CLV-to-CAC ratio for your entire business is a decent starting point, but it's also a classic vanity metric. It averages out all your customers—the amazing ones and the one-and-done duds—into a single, often misleading number.
The real, actionable insights come from segmentation.
You don't have just one type of customer, so you shouldn't have just one CLV. Your most valuable customers don't just appear out of thin air; they're often acquired through specific channels, attracted by certain products, or come from particular regions. The goal is to figure out which levers produce your best customers and then pull them harder.
This is where you need to get granular with your customer lifetime value calculation.
Breaking down your CLV and CAC by different segments is how you turn raw data into a concrete action plan. This process reveals which parts of your strategy are delivering profitable customers and which ones are just costing you money. Start by analyzing your ratio across these key dimensions.
By Acquisition Channel
By First Product Purchased
By segmenting, you transform CLV from a simple metric into a powerful diagnostic tool that shows you exactly where your profit is coming from. This approach is essential if you want to effectively reduce customer acquisition cost by focusing only on the channels and tactics that deliver real, long-term value.
Figuring out your customer lifetime value is a huge step, but let's be honest—the number itself doesn't make you any money. Its real power comes alive when you start using that data to make smarter decisions across your entire business. This is where your analysis jumps off the spreadsheet and becomes a real engine for growth.
Data is only valuable when it leads to action. Armed with your CLV insights, your marketing, product, and customer service teams can finally stop guessing and start moving with precision, focusing their efforts where they'll have the biggest financial impact.
One of the first places you'll want to apply your CLV data is your marketing budget. When you have a crystal-clear picture of what different customer segments are actually worth over time, you can stop obsessing over simplistic metrics like cost-per-click and start acquiring genuinely profitable customers.
For instance, maybe your analysis shows that customers from organic search have a CLV of $900, but those from paid social media campaigns top out at $400. Right away, you know you can confidently pump more resources into SEO and content marketing, because the long-term payoff is massive. It also means you can build smarter ad campaigns that specifically target lookalike audiences of your high-value customers, making every dollar you spend on paid acquisition work harder.
Your CLV data is an absolute goldmine for your product team. It gives you a direct line of sight into which products or features are creating your most loyal, high-spending fans. By segmenting CLV based on a customer's first purchase, you can pinpoint the "gateway" products that kickstart those long-term, valuable relationships.
Imagine your numbers reveal that customers who buy your premium skincare bundle have a 3x higher CLV than those who just grab a single, entry-level item. That’s a powerful signal. It justifies creating new product lines or features just for this loyal segment, because you know the investment will come back to you through higher retention and spending. This is how you align your development roadmap directly with customer value.
A robust customer lifetime value calculation is your strategic compass. It guides every team to focus on the activities that attract and retain your most profitable customers, ensuring sustainable growth for your brand.
The numbers back this up big time. Improving customer retention by just 5% can crank up profits anywhere from 25% to 95%. We also know that existing customers spend, on average, 31% more per order than new buyers. One online clothing retailer found that after factoring in all their costs, their net CLV was $1,590 per customer—a critical number for planning any future growth.
Let’s be real: not all customers should be treated the same. Your CLV calculation lets you identify your VIPs—that small slice of customers who drive a huge chunk of your revenue. You need to protect these relationships at all costs. You wouldn't want to lose a customer worth $2,000 over a simple shipping mix-up, right?
Once you've segmented your customers, you can build an exceptional experience for your top tier:
After crunching the numbers, many businesses look for tools to put these ideas into practice. For example, exploring email marketing platform features can give you practical ways to personalize communication and boost retention, which directly feeds back into a higher CLV. These targeted strategies don't just keep your best customers around; they turn them into your biggest advocates.
To go deeper on this, check out our full guide on increasing customer lifetime value.
Even once you've got the formulas down, real-world questions always pop up when you start putting customer lifetime value calculation into practice. Let's dig into some of the most common hurdles e-commerce brands hit when they move from theory to action.
These are the kinds of practical snags that can stall your progress, but with the right perspective, you can push through them confidently.
For the vast majority of e-commerce brands, recalculating CLV quarterly is the sweet spot. This keeps you agile enough to see the effects of new marketing campaigns or shifts in customer behavior without bogging your team down with constant analysis.
If you’re running a subscription business with super predictable revenue, you might get away with a semi-annual review. The real key is to trigger a recalculation any time you make a significant strategic change.
Think about moments like these:
Running the numbers after these events gives you a much clearer picture of how they're really impacting long-term customer value.
A 3:1 ratio is the gold standard for a reason—it’s a strong indicator of a healthy, sustainable business. It simply means that for every dollar you put into acquiring a customer, you get three dollars back over their lifetime. That's the kind of balance that lets you cover all your costs, pour fuel on the growth fire, and still turn a healthy profit.
But, as always, context is king.
A 1:1 ratio is a definite red flag. It means you’re basically breaking even on every new customer, which is a recipe for stagnation. On the flip side, a ratio of 5:1 or higher might look amazing, but it could mean you're being too conservative. You might be leaving growth on the table by underinvesting in marketing.
It's less about a single number and more about the trend. Track this ratio over time and see how it stacks up against others in your niche to get a true feel for what "healthy" looks like for you.
This is the classic chicken-and-egg problem for new brands. You need data to calculate CLV, but you're too new to have much data. The good news? You don't have to wait, and this is exactly where predictive models shine.
By looking at what a new customer does in their first 30 to 90 days—what they buy, how they browse, whether they used a discount—you can make a surprisingly accurate forecast of their future value. If even that feels like a stretch, you can start with conservative benchmarks from your industry for things like customer lifespan. For instance, if you're in the subscription box game, you could assume a two-year lifespan to start and then adjust as your own data starts rolling in.
The single most important thing is to just start. Don't wait for perfect data. Get a baseline calculation going with what you have now, and commit to refining its accuracy as your business grows.
At Million Dollar Sellers, we know that mastering metrics like CLV is what separates good e-commerce businesses from great ones. Our exclusive community is built for top entrepreneurs who are ready to move beyond the basics and scale their brands with proven, data-driven strategies shared by 7-, 8-, and 9-figure founders.
If you’re ready to learn from the best in the business, see if you qualify to join us at https://milliondollarsellers.com.
Join the Ecom Entrepreneur Community for Vetted 7-9 Figure Ecommerce Founders
Learn MoreYou may also like:
Learn more about our special events!
Check Events