Chilat Doina
November 19, 2026
The ad platform says the campaign returned 2.9x last month. The bank account says you spent $40,000 and collected about $9,000 in cash. Both figures are technically right, and the distance between them is where most DTC brand marketing decisions go wrong.
The gap isn't an accounting trick. Platform revenue includes orders that would have happened anyway, ignores the discount that closed the sale, and stops counting at the add-to-cart event rather than the moment cash clears. This guide treats payback and incrementality as the operating core of DTC marketing, not as an audit you run once something breaks. It also deals with a question that barely existed three years ago: what happens when a customer asks an AI assistant what to buy instead of typing a search.
Say you launch a skincare line on your own storefront. One post lands, the first production run sells out in nine days, and you commit to double the next batch. Month two goes quiet. Not dead, just quiet: 400 first orders turn into 60 repeat orders, and the ad account needs the same daily spend to hit the same volume it hit in launch week.
The difference between that and selling through a retailer is ownership. A retailer rents you shelf space and keeps the customer record, the reorder behaviour and the data on who bought what. Your own storefront gives you the storefront, the email list, the purchase history and the returns data. What it doesn't give you is foot traffic. You buy that, visit by visit.

A rented shop in a busy mall comes with customers walking past the window. An owned store on a side street comes with a list you built and a bill for every person you persuade to walk in. DTC marketing is the second model, and the bill arrives every day.
That's why the discipline gets judged on orders, contribution margin and repeat behaviour rather than impressions. An audience you can reach for free is worth more than a bigger one you have to keep buying. The first order is the cheapest thing to measure and the most expensive thing to get, and most models break in the seven days after delivery rather than in the ad account. The sequence covered in this guide to turning store traffic into loyal buyers starts there, with the unboxing and the first email, not with another creative test.
The category scaled fast enough to attract everyone. U.S. DTC ecommerce sales grew 56.6% year over year in 2018 and reached roughly 3.4% of total U.S. ecommerce retail sales, then hit an estimated $14.28 billion in 2019, with 2020 forecast at $17.75 billion, up 24.3%, against 13.2% growth for U.S. ecommerce overall, according to Practical Ecommerce's review of U.S. DTC sales. From 2016 to 2019 the category grew at roughly three to six times the rate of overall ecommerce, then moderated as more brands piled into the same auctions.
That moderation is the whole story. More brands bidding on the same attention pushes the price of a first order up while the value of a repeat order moves far more slowly, which turns the three jobs above from a growth strategy into a solvency requirement. Brand advertising can be judged on recall and consideration. DTC marketing gets judged on whether the cash came back.
Four numbers belong on one screen. Only one is a ratio the ad platform reports for you.
| Metric | How to Calculate It | Planning Benchmark | Common Mistake |
|---|---|---|---|
| Customer acquisition cost (CAC) | Total sales and marketing spend divided by new customers | Median about $38 for brands under $5M revenue, $52 at $5M-$20M, $61 above $20M | Leaving out creative, agency and tool costs |
| ROAS (return on ad spend) | Platform-attributed revenue divided by ad spend | Margin-bound; not a profit measure on its own | Treating platform ROAS as profit |
| LTV:CAC ratio | Realized contribution margin per customer divided by blended CAC | 3:1 used as a planning benchmark | Building LTV from top-line revenue |
| Cash payback period | Months until cumulative contribution margin covers CAC | Set by the business, for example within 60 days | Counting projected lifetime revenue |
CAC is total sales and marketing spend divided by new customers. Include creative production, agency retainers and tools in the numerator; otherwise, the calculation measures media cost, not acquisition cost. Median CAC varies with brand revenue: Mage Loyalty's analysis of DTC marketing economics reports about $38 for brands below $5 million in annual revenue, $52 between $5 million and $20 million, and $61 above $20 million. The same analysis reports average acquisition cost rising from $13 in 2013 to $29 in 2022, while the average value of a repeat sale moved from $28 to $39.
Revenue can make a campaign look healthy while the order loses money. Subtract gross margin costs, returns, fulfilment, payment fees and post-purchase support before judging the result. The analytics model finance and growth teams share starts with contribution margin per order, not revenue. Build the calculation by channel, including first-order contribution margin, expected repeat margin by cohort and cumulative cash payback.
Set a maximum CAC based on the contribution a customer can generate before the payback window closes. If a customer generates $90 of cumulative contribution margin in the first 12 months and the business requires 60-day payback, acquisition spend must be recovered through contribution generated within those 60 days. Later revenue may improve lifetime value, but it does not cover an earlier cash obligation.
Practical rule: judge a channel by cash returned inside the payback window, not by the multiple shown in the ad platform.
ROAS and payback can move in opposite directions. Rising ROAS alongside longer payback may indicate that a campaign is attracting cheaper but weaker customers through discounts, low-intent placements or creative that draws one-time buyers. Falling ROAS with stable payback can be healthier if customers buy at full price and return.
Calculate from spend through contribution, then reconcile platform conversions against an incrementality test. How to calculate customer acquisition cost provides a walkthrough of the arithmetic. Attribution can credit a campaign for demand that would have converted without it, so platform-reported revenue alone cannot establish whether marketing generated incremental orders.
| Channel | Main Role | Cost Driver | Signal to Track |
|---|---|---|---|
| Paid social (Meta, TikTok) | Create demand and first orders | Auction prices rise as competition grows | New-customer CAC by creative |
| Paid search | Capture existing intent | Keyword competition and brand terms | Branded versus non-branded CAC |
| Creators and affiliates | Build trust through demonstration | Fixed fees or commission per sale | Code-level incremental orders |
| Email and SMS | Drive repeat purchase | Content and platform cost, low media cost | Incremental contribution from holdout tests |
| Organic search and content | Compound discovery over time | Production time rather than media spend | Non-paid new customers per month |
| Marketplaces and retail | Extend reach beyond the brand site | Commission and fulfilment fees | Margin per unit after fees |
No single line does all the work, and none of them gets expensive in the same way. Paid social manufactures demand from people who weren't looking, so you pay whatever the auction charges that week, and the auction gets crueller every time a new brand enters your category. Paid search sits at the other end: you're buying intent that already exists, and the cost depends on how many competitors are bidding over the same keywords plus how much of your own branded traffic you're forced to defend.
Creators price differently again. A fixed fee or a commission per sale means cost per order is a function of how well the demonstration converts, not of auction pressure. Email and SMS cost almost nothing per message, so the expense is content production and the platform fee, and the discipline is in not over-mailing a list you paid for. Social commerce now carries real volume: U.S. social-commerce sales were projected to reach $87.02 billion in 2025, up 21.5% year over year, according to EMARKETER figures reported by StatisticsGlobal. Organic content pays in production hours rather than media spend and compounds slowly, which is why it survives budget cuts that kill auctions.
Creator deals only look cheap until you read the brief. Running them from a structured ecommerce creator campaign playbook, with usage rights, exclusivity windows and code-level tracking agreed before the first post, keeps the cost per incremental order visible.
Litmus test for any channel: strip out branded search and returning customers, then ask what new-customer CAC is left.
Store and marketplace demand isn't a retreat from DTC, it's a reach and trust channel with its own economics. In 2024, 31% of Gen Z consumers preferred buying fashion and accessories in physical stores, while 41% preferred a hybrid in-store and digital path, according to research from 2 Visions reported by Quad. Judge those orders on margin per unit after commission and fulfilment fees, against the same payback ceiling you apply to paid media, and don't call the demand incremental until a holdout or geo read says so.
If paid social is your engine, test exactly one new channel at a time and leave it live for at least one full purchase cycle before judging it. A channel that looks broken at 30 days often pays back at 75. Cut anything whose payback misses the target on the blended numbers, not on the platform's, and resist the temptation to split the budget evenly across five new bets. Even splits hide which channel failed.
The category you chose sets how much retention work is even available, so start with the benchmark for your product type.
| Category | 90-Day Repeat Rate | Main Retention Lever |
|---|---|---|
| Supplements and food | 34% | Subscription replenishment and reorder reminders |
| Beauty | 24% | Routine-based bundles and sampling |
| Apparel | 17% | Loyalty rewards and second-purchase incentives |
| Home goods | 11% | Complementary products and post-purchase guidance |
Those four figures come from a benchmark dataset covering several hundred DTC brands, and they explain why identical marketing budgets produce wildly different businesses. A replenishable product can build a subscription and a reorder reminder that carries the acquisition cost. A home goods brand gets one shot per customer per year at best, so average order value and complementary products have to do the work that replenishment does elsewhere.
Bain & Company research cited by Harvard Business Review, via Darkroom's retention analysis, indicates that a 5% increase in customer retention can increase profits by roughly 25% to 95%, because repeat orders avoid the full cost of acquisition and lift purchase frequency. Retention is a contribution-margin problem, not an engagement score. Segment by first-purchase cohort, acquisition channel, product and margin, then track repeat-purchase rate, time to second order, and contribution margin after discounts and fulfilment.
Category reality check: a replenishable product can carry a paid acquisition model that an infrequent-purchase product never will, however good the creative is.
The temptation is to treat attributed email and SMS revenue as incremental. It usually isn't. Keep a randomized holdout out of win-back, replenishment and loyalty sends, and compare incremental contribution margin, not reported revenue, against the messaging, discount and platform costs. A flow that reports $40,000 and holds back $9,000 of genuine lift is a $9,000 flow.
Retention offers built on deeper discounts often buy a repeat order and lose the margin that justified it. In 2024, 49% of U.S. adults said rising prices caused them to shop DTC brands less often, according to Mintel's U.S. Direct-to-Consumer Retailing Market Report, so the retention lever worth pulling is usually convenience and routine, not a bigger percentage off. Pull the 90-day repeat rate for your last two acquisition cohorts and compare it with the row above that matches your product. If your number sits well under the category rate, the problem is in the first 30 days after delivery, and no win-back sequence fixes that. More of the structural work is set out in these customer retention strategies for ecommerce teams.
Two records of the same month rarely agree. Ad platforms credit sales that may have happened anyway, privacy limits obscure paths across devices and channels, and finance records orders when cash moves. In a 2025 industry survey, 65% of respondents identified proving marketing impact or ROI as a major challenge, up from 57% in 2023. The same survey found that the most-used KPIs were conversion rate at 75%, CAC at 63%, LTV at 54% and AOV at 50%, according to Digiday's State of DTC Marketing 2025.
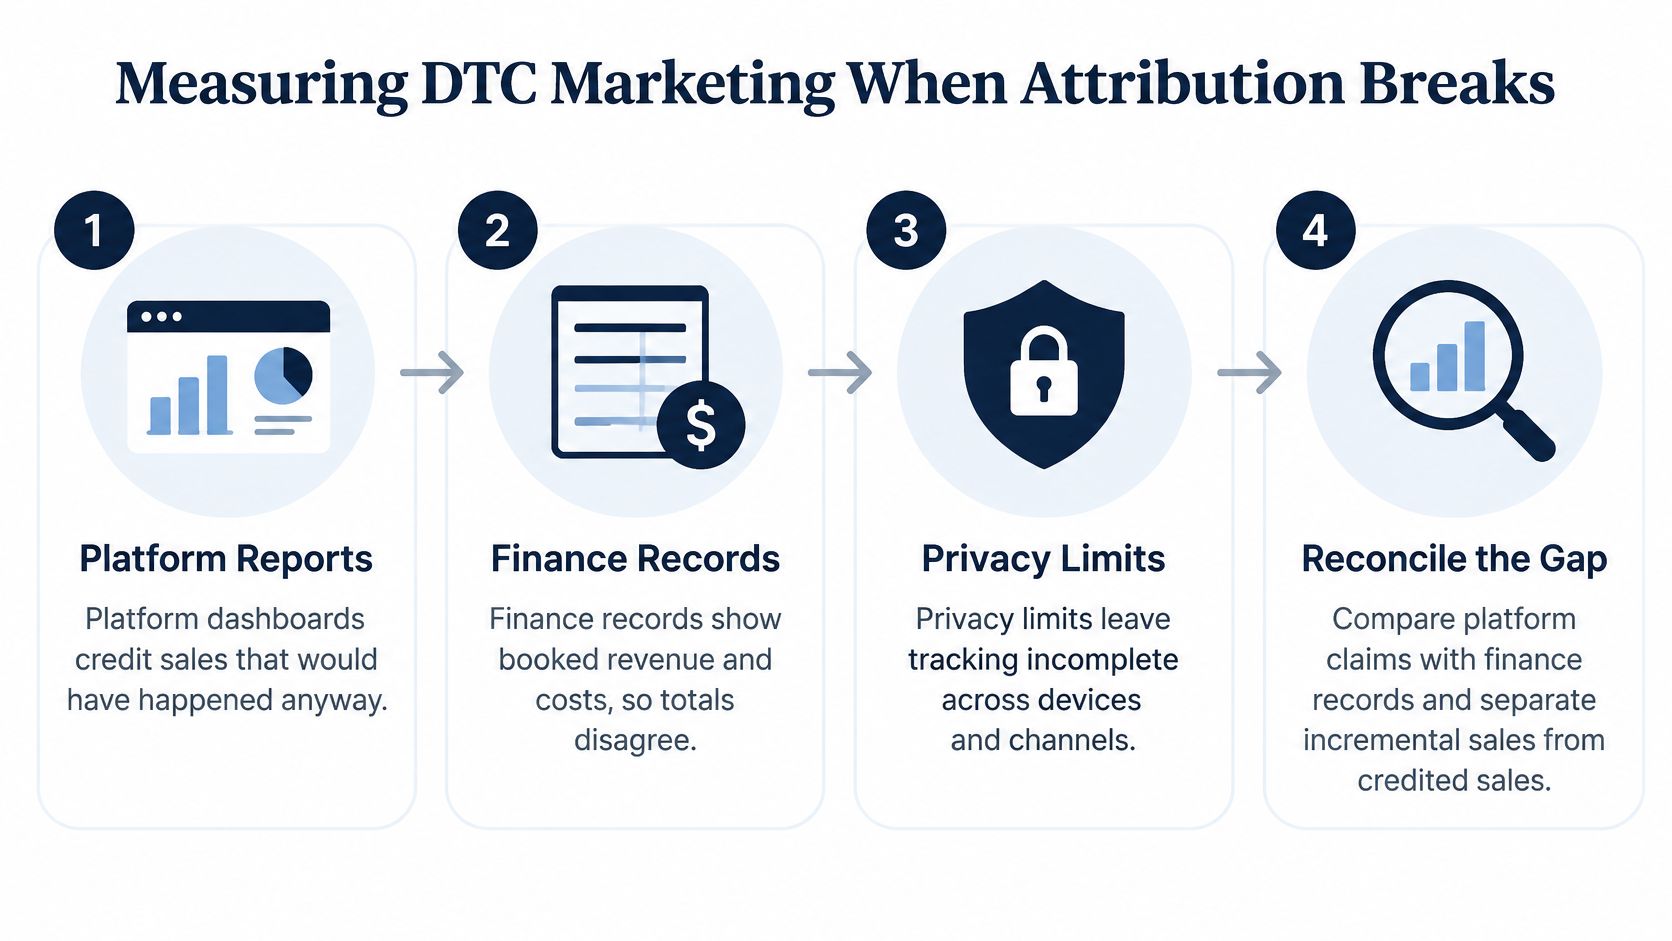
The operating question is whether marketing creates incremental contribution and pays back within the business's cash constraints. Reconcile revenue, calculate blended CAC, then use controlled tests to separate demand created from demand captured. That gives finance and marketing a shared basis for allocating spend, even when no attribution system can assign every order cleanly.
First-party data is increasingly important to campaign outcomes, but collecting more does not automatically improve payback. Use it to connect customer acquisition to repeat behavior and contribution, and document where matching or measurement remains incomplete. For a practical framework, see this guide to ecommerce analytics.
Paid media is no longer the only door into a purchase decision. Recent global data shows 24% of consumers have used generative AI instead of a search engine for product research, rising to 41% among consumers aged 18 to 34, and 55% trust generative-AI tools or shopping agents for at least some shopping decisions, increasing to 75% among 18 to 34-year-olds, according to the Bazaarvoice Shopper Experience Index 2025.

The founder-level question isn't how to use AI to write ads. It's how to make the product legible, trustworthy and correctly described when a shopper asks an assistant what to buy. Performance marketing ran on a simple logic: budget buys visibility. Conversational discovery doesn't work that way, because the shopper defines the context in far more detail than any keyword, and the brand that wins is the one whose product facts are the most credible answer to the question.
AI-influenced demand often leaves no click and no referral. Track branded search lift, direct traffic and post-purchase survey answers ("where did you first hear about us") as the practical proxies, and compare them month over month alongside blended CAC. When a channel produces customers who arrive already researched and ready to buy, the conversion rate on that traffic should look different from cold social traffic, and that difference is the evidence worth building on.
The trade-off is uncomfortable for teams built around auction buying. Reputation and information quality may end up deciding more purchases than budget does. Ratings and reviews stop being a conversion-rate tool and start being part of how the brand gets found at all.
Bring one page to the budget meeting. For each channel, show blended new-customer CAC, the incremental share from its latest geo test or audience holdout, and whether cumulative contribution covers CAC within the business's payback window.
Pause any channel above the ceiling, or one whose holdout group purchased at nearly the same rate as the exposed group. Keep spending where first-order contribution and observed repeat margin cover CAC within the window, after discounts, returns, fulfilment and fees. For a paused channel, require a fresh incrementality read before reopening it. An improved platform ROAS alone is not enough.
Move freed budget into one new test rather than splitting it evenly, and keep the test live for a full purchase cycle. If paid social is the only channel above the ceiling, cut that line and schedule the review for when the payback window closes. Record the ceiling and pause list in the budget document, then share them with whoever approves spend.
Million Dollar Sellers brings together founders and P&L owners, not gurus or info marketers. Its members can discuss channel performance in terms of holdout results and budget decisions, rather than relying on impressions alone. If the ceiling seems too strict for your revenue band, compare it with benchmarks for what a good customer acquisition cost looks like before cutting spend.
A clear payback ceiling makes the next meeting more concrete: each channel either earns its budget through incremental contribution or faces a pause. For ecommerce founders who own the P&L and want peer discussion grounded in operating decisions, Million Dollar Sellers is an invite-only community.
Join the Ecommerce Community for Founders Scaling from 7 to 9 Figures
Learn MoreYou may also like:
Learn more about our events!
Check Events