
Chilat Doina
September 17, 2026
Most ecommerce advice starts with a dashboard. Add more events, connect another platform, create another report, then congratulate yourself on becoming data-driven. That approach fails when the underlying events are incomplete, ownership is unclear, and attribution receives credit for sales that would have happened anyway.
Analytics for ecommerce should function as an operating layer for decisions about inventory, advertising, product mix, retention, and margin. Page views and sessions are inputs, not business outcomes. A clean purchase event tied to contribution margin is more useful than a visually impressive report filled with traffic that nobody can act on.
The commercial stakes are significant. The global ecommerce analytics market was estimated at $22.4 billion in 2025 and is projected to reach $58.1 billion by 2033, implying a 12.6% compound annual growth rate, as online sellers rely more heavily on data for attribution, conversion optimization, merchandising, and retention analysis (Webtonic's ecommerce analytics statistics). The brands that benefit won't necessarily collect the most data. They'll govern it better, interpret it more cautiously, and connect it to decisions that protect cash flow.
Most founders don't have a traffic problem first. They have a measurement problem. When a team sees weak sales, it often responds by buying another analytics tool or commissioning another dashboard, even though the existing implementation may not distinguish a browser refresh from a meaningful customer action.
More data doesn't automatically create more clarity. If campaign names vary between Meta, Google Ads, email, and the warehouse, the reporting layer has to guess which records belong together. If refunds and returns never reach the revenue model, a campaign can look productive while damaging contribution margin. If the purchase event fires inconsistently, every downstream metric becomes suspect.
Practical rule: Never optimize a metric you can't define, reconcile, and assign to an owner.
Vanity metrics describe attention. Operating metrics describe economic consequences.
Sessions, impressions, reach, and page views can help diagnose demand and user experience, but they don't tell you whether the traffic produced profitable orders. The useful questions are more demanding:
The distinction matters because official commerce reporting has made online retail measurable at macroeconomic scale. The U.S. Census Bureau's quarterly retail e-commerce series recorded $340.2 billion in U.S. retail e-commerce sales in Q2 2026, up 3.8% from Q1 2026 (NovaData's ecommerce statistics summary). Ecommerce is no longer an experimental side channel. It's a business category with enough scale to support rigorous forecasting and benchmarking.
A seven-figure or eight-figure operator should treat data definitions like supply-chain specifications. “Revenue” must mean the same thing in the finance report, ad platform export, customer cohort table, and executive dashboard. “New customer” needs a written rule. “Return” must be represented as an economic adjustment, not hidden in an operations spreadsheet.
That discipline is more valuable than adding another visualization. For teams working with resale or marketplace data, a focused resource on secondhand sales metrics can help frame the difference between transaction activity and the performance measures that support better decisions.
Profitability rarely hides inside a single KPI. It emerges when you connect acquisition cost, order economics, customer behavior, and product margin in the same model.
Start with revenue per visitor, not raw traffic. It combines the quality of incoming demand with the store's ability to convert and monetize that demand. A channel that sends fewer visitors but produces stronger revenue per visitor can deserve more budget than a channel that wins on volume.
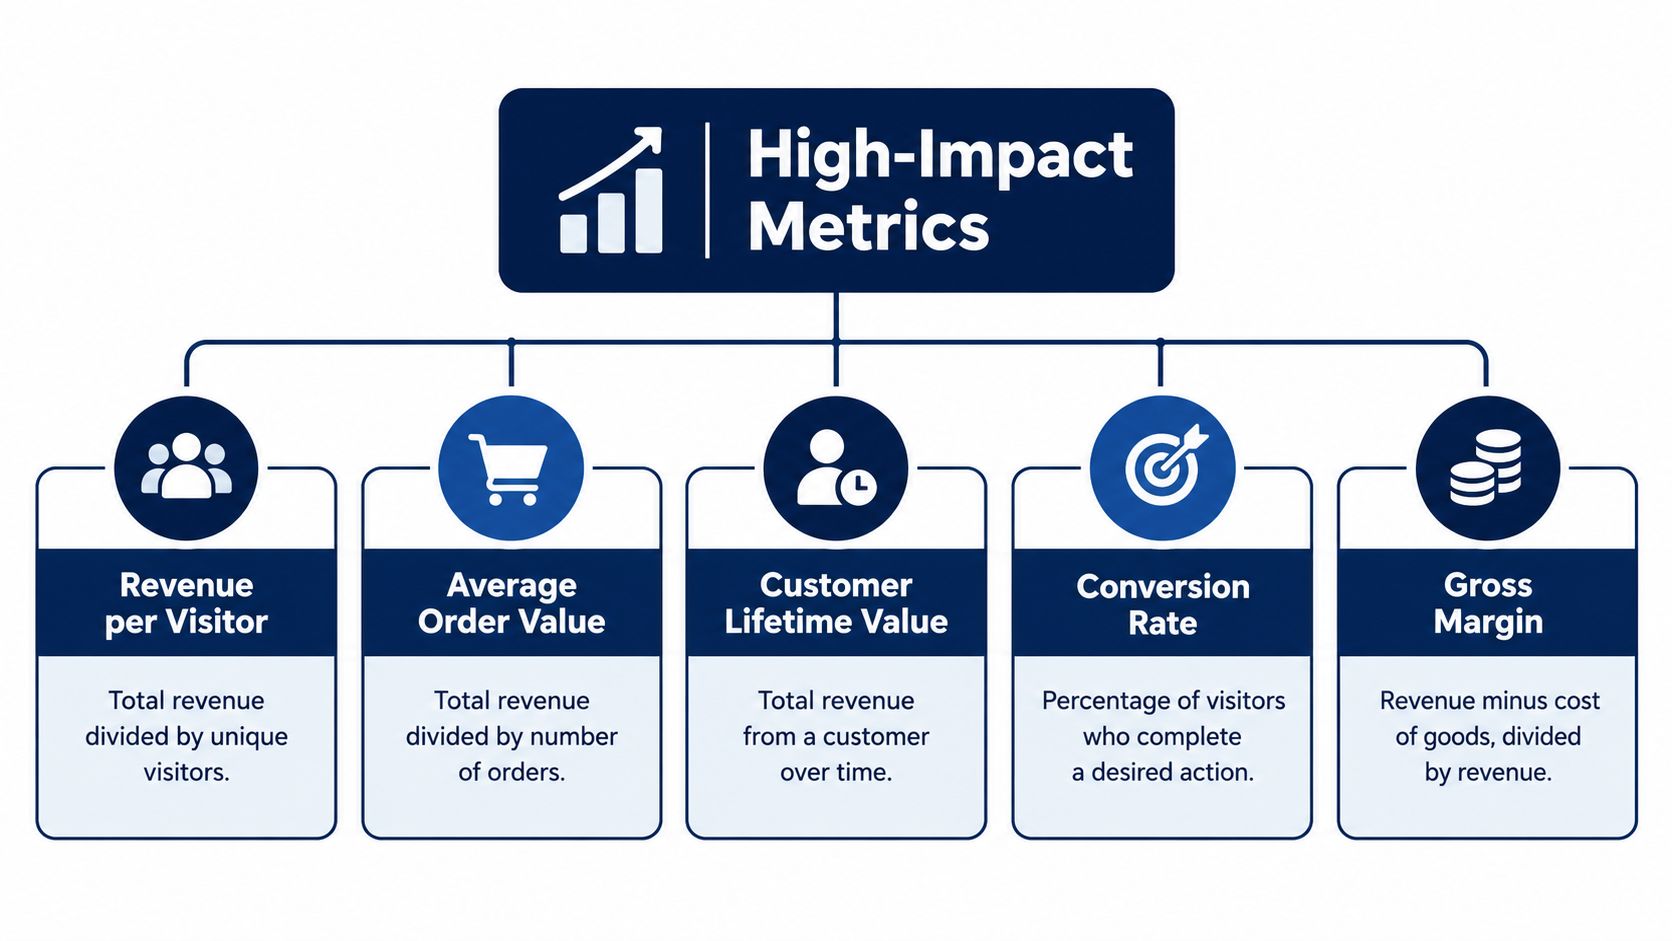
Average order value is useful only when paired with contribution margin. Bundles and upsells can increase order size, but an expensive-to-ship bundle or a heavily discounted promotion may reduce profit per order. Calculate AOV alongside product cost, fulfillment, payment processing, discounts, and expected returns.
Customer acquisition cost should be calculated by channel and customer type. Blended CAC can conceal a weak prospecting program when returning customers make up much of the reported revenue. Separate new-customer spend from retention spend, then compare first-order contribution with the expected value of future purchases.
Customer lifetime value is a forecast, not a fact printed by a software tool. Build it from observed cohort behavior and deduct the costs that affect real cash generation. A high-revenue customer who returns products frequently may be less valuable than a smaller spender with consistent repeat orders.
Contribution margin per channel should sit above ROAS in the decision hierarchy. ROAS assigns revenue to advertising. Contribution margin asks what remains after variable costs. The latter determines whether scaling creates cash or consumes it.
A useful funnel follows meaningful transitions:
Track each transition by device, product, landing page, customer status, and acquisition source. A declining purchase rate can come from poor traffic, an uncompetitive offer, payment friction, shipping surprises, or a broken event. The funnel helps isolate the location, but qualitative evidence from support tickets, reviews, and cancellation responses explains the cause.
Aggregate retention reports smooth together customers acquired under different prices, products, seasons, and traffic sources. Cohort analysis preserves those differences. Group customers by acquisition period, first product, channel, and customer status, then monitor reorder behavior and net value over time.
A cohort that buys at a high AOV but never returns may be less attractive than a cohort with lower initial order value and stronger repeat behavior. ecommerce KPI guidance complements the financial model, especially when teams need to connect sales, profitability, conversion, customer value, and operational performance.
For teams evaluating advertorial or listicle funnels, advertorial conversion data can provide useful context for structuring funnel analysis. Treat any external benchmark as directional. Your own margin and cohort data should decide whether a funnel deserves more investment.
Client-side pixels remain useful, but they shouldn't be the only source of truth. Browser restrictions, consent choices, ad blockers, cross-device behavior, and platform-specific modeling all create gaps between what happened and what a browser report claims happened.
A durable setup captures the event at the point of action, sends a controlled copy to a server-side endpoint, stores the raw record in a warehouse, and then distributes validated fields to reporting and advertising systems.
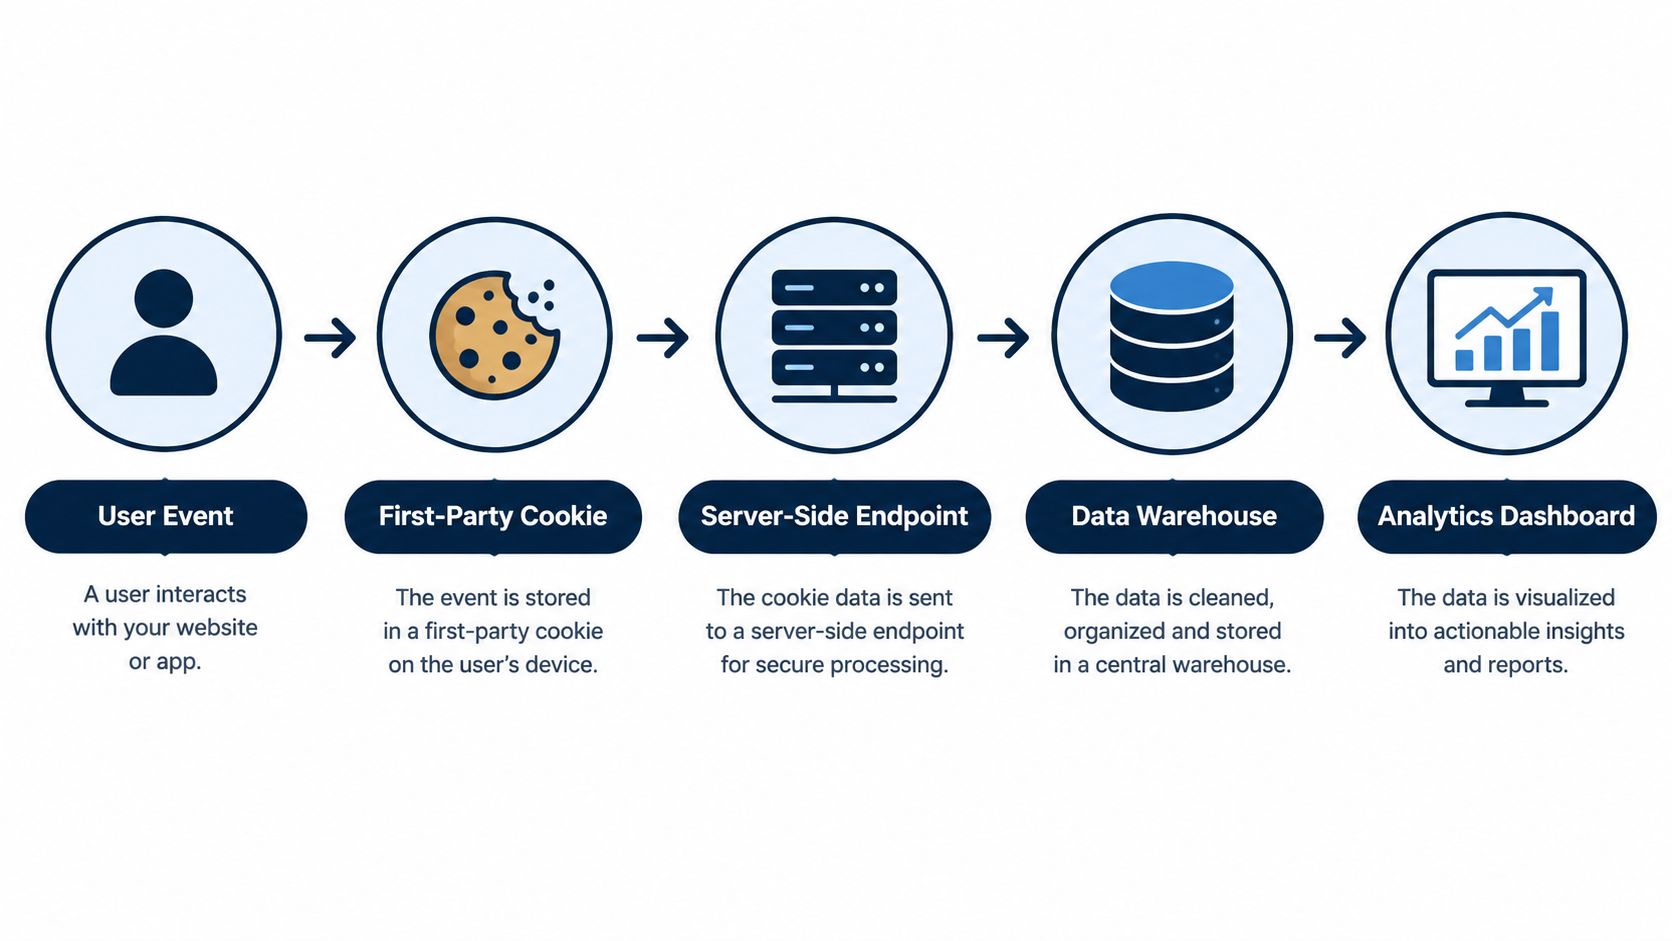
Begin with an event dictionary. Define the required fields for product views, cart additions, checkout starts, purchases, refunds, cancellations, and returns. Include identifiers, timestamps, product information, price, discount, currency, consent state, and order status where appropriate.
GA4 can provide baseline event reporting, but implementation quality matters more than the interface. Validate that the purchase event fires once, contains the correct order value, includes line items, and remains consistent across payment flows. Test confirmation pages, express checkout, failed payments, partial refunds, and post-purchase adjustments.
Server-side tracking should receive events from the ecommerce platform or backend rather than depending entirely on a browser tag. Send validated purchase and refund data to the warehouse first. From there, route approved fields to systems such as Meta Conversions API or Google's enhanced conversion tools, subject to consent and applicable privacy requirements.
This architecture doesn't make attribution perfect. It gives you stronger control over what was recorded, when it was recorded, and how the record gets reconciled. A warehouse also lets analysts reprocess raw data when definitions change instead of accepting whatever a vendor's current dashboard displays. A practical primer on data warehouse architecture is useful when deciding where raw events, transformed tables, and reporting models should live.
Authenticated identity, such as an account login or a permissioned email relationship, can connect sessions across devices more reliably than anonymous browser identifiers. Zero-party data, such as a customer's stated preferences or intended use case, can enrich that identity when the customer voluntarily provides it.
Adoption remains difficult. The share of brands using exclusively first-party data for personalization rose only 6% between 2021 and 2022, according to Forbes Agency Council coverage of first-party data. That slow progress is a warning against treating first-party strategy as a campaign. It requires consent management, clear value exchange, reliable identity rules, and disciplined activation.
A dashboard should answer, “What decision changes today because this number moved?” If it can't, it belongs in an appendix or should be removed.
The CEO needs a compact view of net revenue, contribution margin, cash exposure, inventory risk, and customer quality. The media buyer needs spend, new-customer acquisition, contribution by channel, and the latest incrementality read. Operations needs sell-through, inventory velocity, inbound timing, fulfillment exceptions, and return patterns. Each role needs a different slice of the same governed data.

A daily dashboard should surface exceptions rather than encourage passive browsing. Highlight unusual changes in orders, conversion, payment success, refunds, stock availability, and channel spend. Every alert needs a named owner and a next action.
A founder shouldn't spend the morning scanning dozens of charts. The report should answer whether demand is healthy, whether the business can fulfill it, whether paid growth is economically sound, and whether a technical issue is distorting the numbers.
The weekly review needs a channel-level view that separates:
Keep the commentary next to the numbers. A lower conversion rate after a price increase means something different from a lower conversion rate after a checkout failure. Customer reviews, support conversations, stockouts, and competitor pricing provide the context that event streams can't supply.
The monthly report should connect cohorts, product profitability, inventory, and cash requirements. Review which first-purchase products create repeat behavior, which SKUs generate returns, and which channels acquire customers with durable value. The operations team should see these findings before purchase orders are committed.
Teams building role-specific reporting can use a performance metrics dashboard framework to organize views around decisions rather than around the capabilities of a chosen BI tool.
The strongest reporting cadence is deliberately boring. It produces the same definitions each period, flags material changes, records the decision made, and allows the team to inspect whether that decision worked.
Last-click attribution is easy to read and dangerous to over-trust. It typically rewards the touchpoint closest to purchase, even when that touchpoint mainly captured demand created by other channels.
Attribution models answer a descriptive question: which interactions received credit under a particular rule? Incrementality testing answers a causal question: would the outcome have changed without the marketing activity?
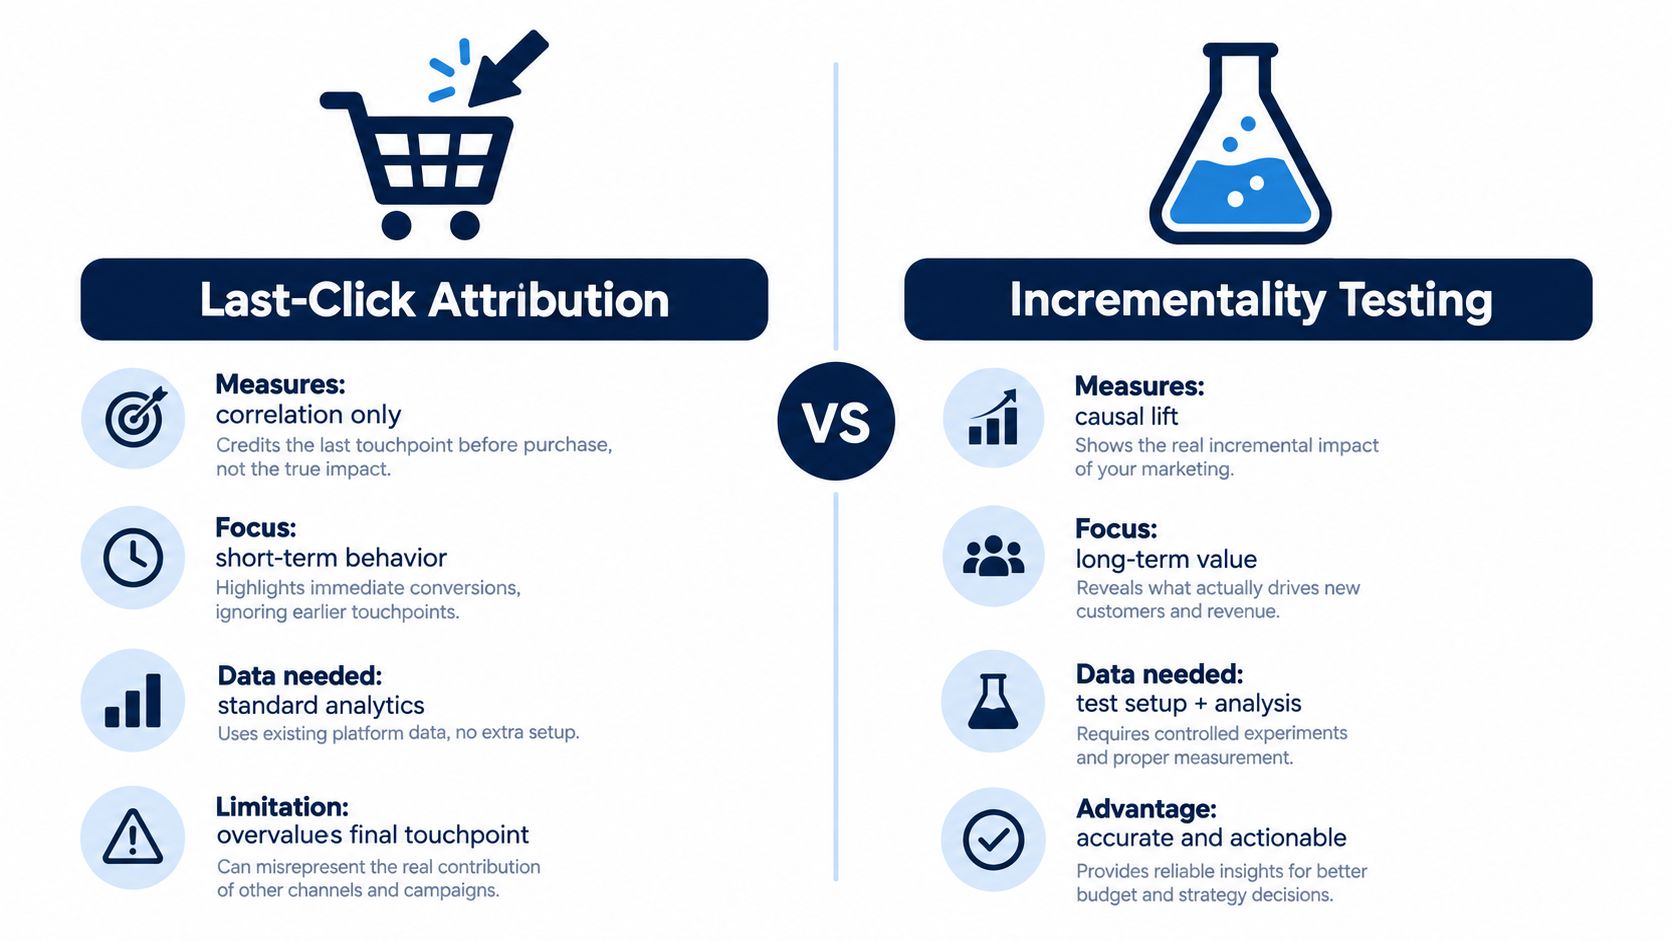
A branded search ad can receive the final click from a customer who already encountered a product through social content, email, marketplace discovery, or direct navigation. Turning off branded search may not remove the full revenue attributed to it. The dashboard reports association. It doesn't establish what the ad caused.
Treat platform attribution as directional. Use it to monitor changes, compare creative and audience behavior, and identify questions for testing. Don't use it as unquestioned proof that every credited order is incremental.
A practical geo-holdout test follows a controlled process:
The measurement window matters because customers don't always purchase immediately after exposure. Industry guidance recommends a 6–8 week window for geo-holdout testing so delayed conversions aren't excluded, and describes the method as the gold standard for reducing selection bias and isolating causal impact (Common Thread Collective's incrementality framework).
Incrementality testing isn't a replacement for every report. It calibrates the reports you already use. If a channel consistently receives substantial platform credit but produces weak causal lift, reduce its role in budget decisions. If a channel appears inefficient in last-click reporting but produces measurable lift in controlled tests, its contribution deserves a different interpretation.
The disciplined operator builds a feedback loop. Model performance guides daily action, while periodic causal tests correct the model's assumptions.
The most expensive analytics failure is often an unowned definition. Software can't resolve a disagreement between finance, marketing, and operations about what revenue means or which campaign name belongs to a sale.
Governance sounds administrative because it involves dictionaries, naming conventions, permissions, and reconciliation. In practice, it determines whether a media buyer can trust channel performance, whether finance can reconcile reported revenue, and whether a founder can make a budget decision without commissioning a manual investigation.
Implementation data shows the imbalance clearly. Page views are tracked in 97% of setups, while purchase events are tracked in only 48%, leaving many stores unable to connect traffic reliably to revenue (InfoTrust's retail and ecommerce analytics commentary). Tracking what is easy instead of what is economically important creates a polished blind spot.
A governance owner should maintain the event dictionary, approve schema changes, monitor missing fields, and reconcile platform orders with finance records. Marketing should own campaign taxonomy. Engineering or analytics should own collection quality. Finance should approve the revenue and margin definitions used for executive reporting.
| Governance Failure | Business Impact | Required Fix |
|---|---|---|
| Inconsistent campaign names | Spend and conversions can't be grouped reliably across platforms | Create a controlled naming taxonomy and validate every campaign before launch |
| Missing purchase or refund events | Traffic can't be connected to net commercial outcomes | Test the full order lifecycle, including refunds, cancellations, and partial adjustments |
| Fragmented data ownership | Teams publish conflicting versions of revenue, CAC, or ROAS | Assign one accountable owner for each critical metric |
| No product and cost identifiers | Reports show sales without dependable margin analysis | Standardize SKU, product, cost, discount, and fulfillment fields |
| Unlogged schema changes | Historical comparisons break without explanation | Keep a change log and version event definitions |
A single source of truth doesn't mean every employee needs the same dashboard. It means every dashboard draws from the same approved definitions and reconciled tables. Store raw events separately from transformed business logic, document exclusions, and show data freshness directly in the report.
Run routine reconciliation between the ecommerce platform, payment processor, advertising platforms, warehouse, and finance system. When numbers disagree, record the reason instead of adjusting a spreadsheet. Trust grows when the team can explain variance.
More dashboards rarely solve a scaling problem. Profit improves when measurement connects acquisition with customer quality, product economics, inventory, operations, and causal evidence.
Before expanding a campaign with attractive reported ROAS, review new-customer share and contribution margin. Then check cohort quality, returns, inventory availability, and any relevant holdout test. That sequence can reverse the initial decision. A campaign may merit more spend, less spend, or a different product offer once the business examines what follows the attributed order.
Reliable customer and product records show which first-purchase products lead to repeat orders and which create avoidable service costs. Inventory velocity can guide purchase timing and supplier negotiations. Channel-level margin can stop the team from increasing demand for products that operations cannot fulfill profitably.
Logistics measurement deserves the same discipline as marketing measurement. Python-based workflows can connect order, inventory, fulfillment, and delivery records in a flexible environment. Teams building that capability can use this guide to Python analytics for logistics for practical direction.
The operating model improves when analysts turn findings into decisions, rather than another report.
The advantage does not require a perfect customer model or elaborate forecasting before basic tracking works. Sequence the work:
The ecommerce analytics market's projected expansion reflects how measurement is becoming embedded in online retail operations. The operators who gain the most will not be the ones with the largest dashboard collection. They will be able to explain why a number changed, how it affects profit, and which action should follow.
Million Dollar Sellers gives serious ecommerce operators access to a peer network, strategy sharing, and practical insights from founders running Amazon, DTC, and omnichannel brands. If you are rebuilding measurement for profitable scale, visit Million Dollar Sellers to learn how the community supports decisions around analytics, growth, and execution.
Join the Ecom Entrepreneur Community for Vetted 7-9 Figure Ecommerce Founders
Learn MoreYou may also like:
Learn more about our special events!
Check Events