


Stay Updated with Everything about MDS
Thank you! Your submission has been received!
Oops! Something went wrong while submitting the form.
Chilat Doina
September 18, 2025
Diving into your sales data is more than just crunching numbers. It’s about collecting the right metrics, spotting trends, and translating those discoveries into real-world strategies that actually grow your revenue and make customers happier. The goal is to understand what people are buying, when they’re buying it, and why they might be leaving their carts behind. This is how you build a smarter, more profitable e-commerce business.

In a jam-packed e-commerce market, running your business on gut feelings is a recipe for disaster. It's like trying to navigate a new city without a map. The most successful online stores don't just glance at their revenue; they use sales data as their primary strategic tool. Adopting this data-first mindset isn't just a nice-to-have anymore—it’s absolutely essential for sustainable growth.
The digital marketplace is growing at an incredible rate. Global e-commerce sales are expected to reach $7.5 trillion by 2025, a massive jump from $5.7 trillion in 2023. With 85% of global consumers now shopping online, the fight for every click and conversion is more intense than ever. These numbers paint a very clear picture: if you don't understand your data, you're falling behind. You can find more insights about what's next for digital commerce on cimulate.ai.
Real sales analysis isn't about looking at a daily sales report and calling it a day. It’s about asking smarter questions to uncover the stories your numbers are trying to tell you. When you get good at this, the possibilities open up.
A classic mistake I see is businesses treating all their customers the same. Your data will almost always show that a small group of loyal customers drives a huge chunk of your revenue. Focusing on keeping those high-value relationships strong is a game-changer for long-term profitability.
Let’s imagine an online clothing store sees a sudden spike in abandoned carts. On the surface, it just looks like lost sales. But when they dig into the data, they find a pattern: most of the abandoned carts are coming from customers in one specific state, and they're all dropping off at the shipping stage.
This insight prompts them to look closer at their shipping costs for that region, and they realize the rates are way higher than average. After finding a new local carrier and offering a more reasonable flat-rate shipping fee, they slash their cart abandonment rate in that area by 30%. That’s a direct boost to their bottom line, all because they turned a confusing data point into a decisive action.
To get any real value out of your sales data, it all needs to live in one place. You simply can't spot reliable trends or make smart decisions when your information is spread across a dozen different platforms and messy spreadsheets. The goal here is to create a single source of truth (SSoT)—one central, trusted hub that gives you a complete view of your entire business.
Think about it. Your data is probably everywhere right now: your Shopify store, your CRM, Google Analytics, your ad platforms. A true SSoT pulls all of that together. It even means integrating data from your payment processors, as understanding payment gateway solutions is crucial for capturing every last transaction detail accurately.
Bringing all your data under one roof might sound daunting, but the concept is simple. You're just trying to see the full story of what's happening in your business.
Most e-commerce brands will need to pull from these key sources:
Getting this right is becoming non-negotiable. The global data analytics market is expected to balloon to $72.4 billion by 2025, up from just $28 billion in 2021. That massive jump shows just how critical these unified data systems are for staying competitive. You can see more on the data analytics market growth on cognitivemarketresearch.com.
Once you've gathered all your data, you have to clean it. This step is critical. "Dirty data"—information riddled with errors, duplicates, and inconsistencies—will lead you to completely wrong conclusions. It's the number one reason data projects fail.
Think of data cleaning like prepping ingredients before you cook. If you don't wash the vegetables or trim the fat, the final dish is going to be a mess, no matter how good your recipe is. It's the exact same principle here. Clean data is the foundation of every single reliable insight.
Focus on fixing the most common problems first. Standardize your formats for things like dates and addresses so everything matches. Find and merge duplicate customer profiles that pop up across different systems. Then, figure out a consistent way to handle missing information—do you fill the gaps with averages, or just remove those records from certain analyses?
Doing this groundwork up front is what separates guessing from knowing. It ensures every decision you make is based on solid, accurate information.

Now that your data is clean and organized, the real fun begins. But this is also where many e-commerce brands get stuck, drowning in a sea of charts and graphs. It’s a classic trap.
The secret isn’t tracking everything; it’s tracking the right things. We need to cut through the noise and zero in on the key performance indicators (KPIs) that actually signal your business's health. Forget vanity metrics like social media likes or total website visits—they feel good, but they don't pay the bills. Let's focus on the numbers that drive action and directly pad your bottom line.
One of the most powerful yet simple metrics to start with is your Average Order Value (AOV). This number tells you exactly how much customers spend, on average, every time they place an order. It's a direct reflection of their purchasing habits and how well your upselling and cross-selling efforts are working.
The calculation is refreshingly simple:
So, if you brought in $50,000 last month from 1,000 separate orders, your AOV is a solid $50. A rising AOV is a fantastic sign, showing that customers are adding more to their carts. If that number feels stuck, it might be the perfect time to test out product bundles or a more prominent "you might also like" feature.
Next up is a number you absolutely have to know: your Customer Acquisition Cost (CAC). This tells you precisely what you're spending to bring a new customer through the door. Without it, you're essentially flying blind with your marketing budget.
Here’s how you find it:
Let's say you spent $5,000 on Google and Facebook ads last quarter and acquired 250 brand-new customers. Your CAC would be $20. Knowing this is critical for judging the profitability of your campaigns. If your CAC starts creeping up, it can quickly chew through your margins, so keep a close eye on it.
The final piece of this core trio is Customer Lifetime Value (CLV). This isn't just about a single sale; it's a projection of the total revenue you can expect from a single customer over their entire relationship with your brand. It shifts your mindset from short-term transactions to long-term health.
A business that understands CLV will always outperform one that only chases the next sale. It’s the difference between building a loyal community and just running a transaction machine. A high CLV is the ultimate indicator of a strong brand and a sustainable business model.
While a truly precise CLV formula can get complicated, a basic calculation gives you a powerful starting point:
A high CLV is a clear signal that people love your products and keep coming back for more. In a healthy business, your CLV should be significantly higher than your CAC. When you start looking at these numbers together, they paint a complete picture of your store's performance.
To take your analysis a step further, understanding your profit on each sale is essential. Our guide on understanding gross margin is the perfect next read to connect these dots.
To help you stay focused, here's a quick rundown of the most important sales metrics you should be tracking. These are the numbers that provide actionable insights, not just feel-good stats.
By keeping a close watch on these specific metrics, you can make smarter, data-backed decisions that will genuinely move the needle for your business.
With your data cleaned up and your key metrics identified, it’s time to put on your detective hat. This is the fun part—where you go beyond just looking at reports and start asking the right questions to find those hidden gems in your sales data. You don't need a Ph.D. in data science for this, just a healthy dose of curiosity and a few solid techniques.
Let's walk through some powerful, yet surprisingly simple, methods you can use to start making sense of your sales data today. Think of these as the tools that help you understand the "why" behind the numbers.
Trend analysis is essentially your wide-angle lens for viewing sales performance. By plotting your sales data over time—whether that’s weeks, months, or even years—you can quickly spot crucial patterns. This is how you see things like seasonality, overall growth (or decline), and the real impact of your marketing efforts.
It's often the less obvious trends that are the most valuable. For instance, an online gift shop obviously expects a sales spike in February for Valentine's Day and again in December. But what if you dig deeper and notice a smaller, but consistent, sales lift every August? Maybe it's "back to school" shoppers grabbing dorm decor. Now that's an insight you can act on next year with a targeted campaign.
This process is a journey, really. You start by looking back to figure out what happened, then diagnose why it happened, and finally, you can start making educated guesses about what's coming next.
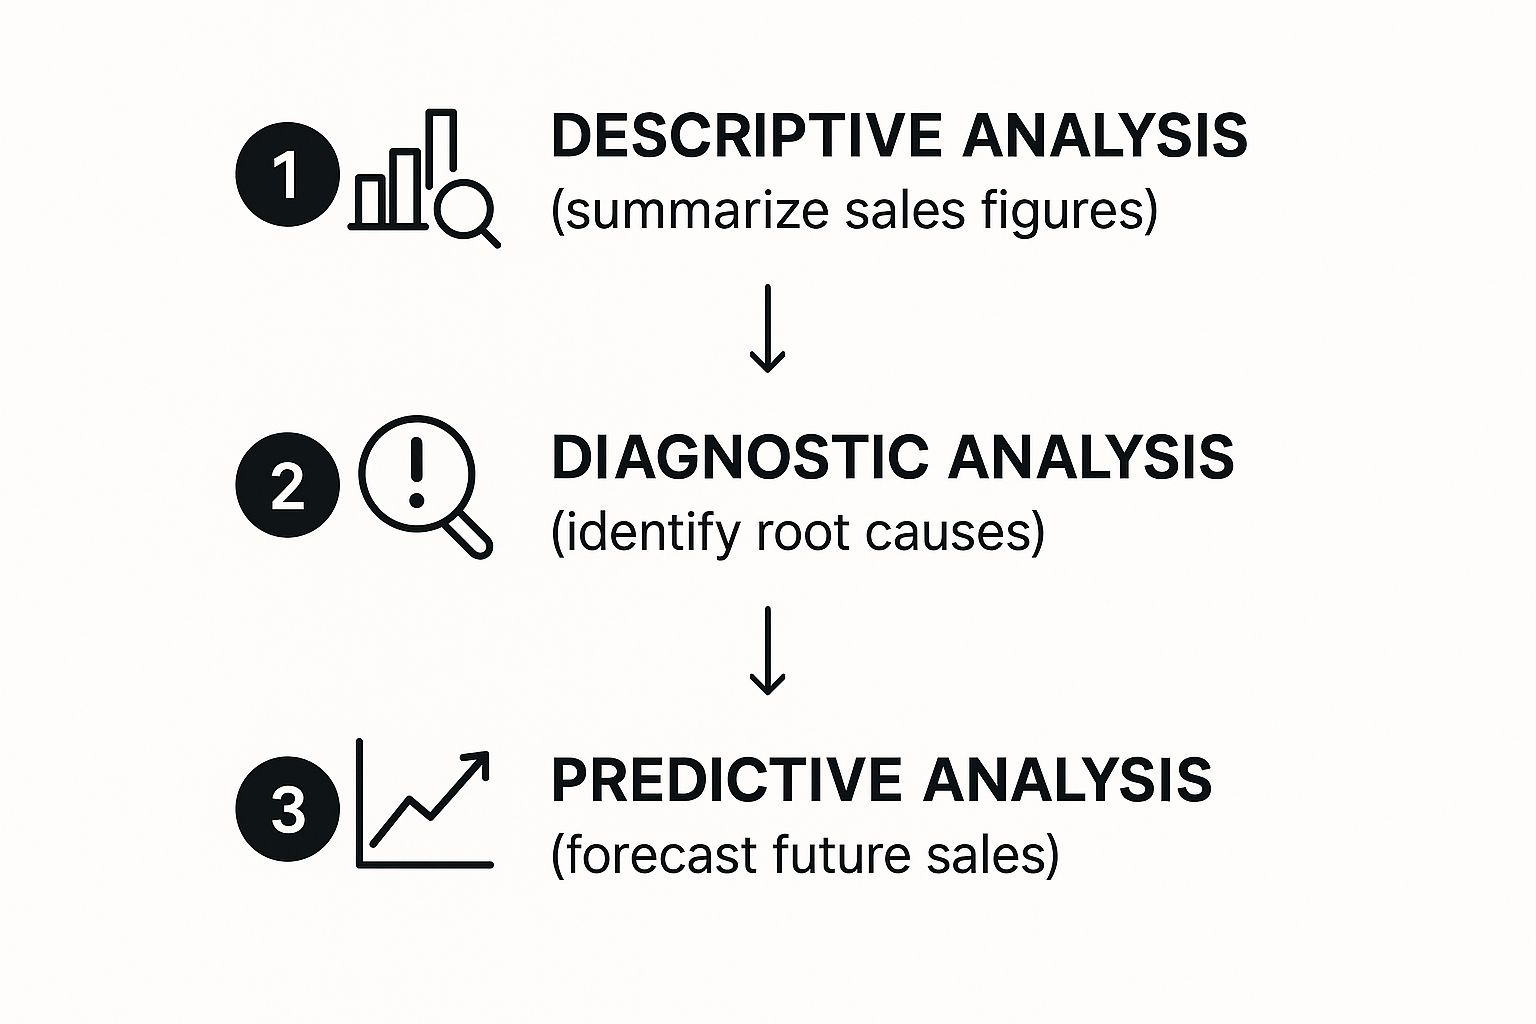
This flow from descriptive to diagnostic and then predictive analysis is the core of turning raw data into a strategic advantage.
Let’s be honest: not all products are created equal. Some are superstars, and others are just taking up valuable digital shelf space. A solid product performance analysis helps you figure out which is which.
But don't just look at units sold. I've seen plenty of stores where a high-volume product actually has razor-thin profit margins, making it far less valuable than a slower-moving item with a hefty gross margin.
You need to know:
A classic mistake I see is merchants pouring all their ad spend into their single best-selling product. Often, their second or third-best seller has a much better profit margin and a more dedicated customer base. Shifting focus to that product can be a game-changer for profitability.
Your customers aren't one big, uniform blob. They're individuals with different habits and motivations. Customer segmentation is the practice of grouping them based on shared characteristics—like their purchase history, location, or how much they spend. This is how you stop shouting into the void and start having meaningful conversations.
For example, you could easily create segments for:
Once you have these groups defined, the possibilities are endless. Send an exclusive early-access offer to your VIPs. Hit your one-time buyers with a compelling "we miss you" discount. It's all about targeted action.
This level of detail is no longer a "nice to have." The buying process is more complicated than ever. In the B2B world, for example, it’s estimated that by 2025, an average of 7.4 decision-makers will be involved in a purchase, and nearly 70% of the buyer's journey happens before they even talk to a salesperson. You can discover more insights on B2B buyer behavior on spotio.com. While that's a B2B stat, the lesson is universal: understanding your specific customer segments is absolutely critical to connect with them effectively.

Finding that "aha!" moment in your data is exhilarating, but it's just the starting line. An insight gathering dust in a report is worthless. The real magic happens when you turn that discovery into tangible business growth.
This is where all your hard work pays off. You're creating a direct connection between what the numbers are telling you and the decisions you make about marketing, product development, and pricing. It's about translating screen-deep data into a healthier bottom line.
Think of your insights as a roadmap. Each one points directly to a specific problem or a hidden opportunity. The final, critical piece of the puzzle is building practical playbooks so you can move from discovery to execution without missing a beat.
Let's get real. Say your analysis keeps flagging a stubbornly high cart abandonment rate—a classic e-commerce headache. Digging deeper, you see most people bail the second they see the shipping costs. That’s not just a statistic; it's a giant, blinking sign telling you to rethink your entire shipping strategy, and fast.
Armed with this knowledge, you can develop targeted strategies to reduce cart abandonment and boost sales. This might mean A/B testing a free shipping threshold, trying to negotiate better rates with your carriers, or simply offering a clear, flat-rate option. The point is to respond with a specific, measurable action driven by the data.
Now, let's flip the script. What if your data highlights a customer segment with a sky-high Customer Lifetime Value (CLV)? These are your VIPs, your brand evangelists. The insight here isn't just that they spend more money; it's that they are the foundation of your store's stability.
So, what does the playbook look for them?
The brands that win don't just look at data; they build systems where data constantly feeds their next move. It's a perpetual loop: analyze, act, measure, and repeat. This fosters a culture of constant improvement driven by hard evidence, not just gut feelings.
This can't be a one-and-done project. To get lasting value, you have to weave this process into the fabric of your daily operations. Establishing a framework for data-driven decision making is non-negotiable for any e-commerce brand that wants to scale in today's market. Find out more at https://milliondollarsellers.com/blog/data-driven-decision-making.
Treat every new marketing campaign, product launch, or pricing tweak as an experiment. Start with a clear hypothesis based on your data, define what success looks like in concrete terms, and then meticulously measure the results. This disciplined approach ensures your analysis produces more than just interesting reports—it builds a smarter, more resilient business that adapts and thrives.
Diving into your sales data can feel like you're trying to drink from a firehose, especially when you're just starting out. It's completely normal to have questions pop up as you begin connecting the dots. Here are a few of the most common ones I hear from e-commerce owners, along with some straight-up advice to get you analyzing with confidence.
Don't overcomplicate this. When you're just starting, stick with the tools you probably already know.
Microsoft Excel or Google Sheets are more than powerful enough for foundational analysis. Seriously. You can sort, filter, and create pivot tables to get a solid summary of your data and spot early trends without getting bogged down by a new, complex platform.
Your e-commerce platform's built-in analytics are also a goldmine. Whether you're on Shopify or BigCommerce, their dashboards are a fantastic starting point for tracking core metrics. Once you get your feet wet, then you can start exploring dedicated business intelligence (BI) tools like Tableau or Microsoft Power BI for more sophisticated visuals.
The honest answer? It depends on your sales volume and what you're trying to accomplish right now.
As a general rule, a deep-dive analysis should happen at least monthly. This cadence is perfect for reviewing broader trends, checking your performance against goals, and making strategic tweaks for the upcoming month.
But for your day-to-day operations, you'll want to keep an eye on key metrics like daily sales, conversion rates, and traffic. This lets you catch any weird dips or spikes immediately. And if you're running a big promotion like a Black Friday sale? You should be checking your data daily—or even hourly—to make quick decisions that can make or break your campaign.
I see it all the time: 'analysis paralysis.' People get so lost in the numbers and making perfect charts that they never actually do anything. Remember, the goal isn't just to look at data; it's to pull out actionable insights that will actually grow your business.
Another huge mistake is working with "dirty" data. If your data sources are a mess, any conclusion you draw from them will be flawed. This can lead to some seriously bad business decisions. Always, always start with a clean, validated dataset.
Absolutely. This is where the magic happens, and it's a process called sales forecasting.
A simple but surprisingly effective way to start is with trend analysis. Just look at your historical sales data to project what's coming next. The key is to account for seasonality. You know you're going to see a spike during the holidays, so factor that predictable pattern into your forecast.
If you want to get more advanced, you can use techniques like regression analysis, which looks at how different variables (like ad spend or website traffic) impact sales. The good news is that many modern analytics tools have forecasting features built right in, automating the heavy lifting and giving you much more sophisticated projections. This is how you turn your old data from a simple report card into a strategic roadmap for the future.
Ready to join a network of top e-commerce entrepreneurs who use data to build 7, 8, and 9-figure brands? Million Dollar Sellers is an exclusive community where the world's best sellers share their playbooks. Apply for your invitation at Million Dollar Sellers.
Join the Ecom Entrepreneur Community for Vetted 7-9 Figure Ecommerce Founders
Learn MoreYou may also like:
Learn more about our special events!
Check Events.svg)
.svg)
.svg)

.svg)