
Chilat Doina
November 1, 2026
You're staring at a dashboard where revenue is up, ad platforms are all reporting wins, and the bank account tells a different story. Amazon wants more spend to hold rank. Paid social wants fresh creative. TikTok Shop wants creator fees. Your own site wants traffic you now have to buy twice. That's the normal state of marketing strategy in e commerce once you're past the first product that worked. The fix isn't another channel. It's judging every channel by contribution profit after ad cost, fees, fulfillment and returns, then funding only what clears that bar.
Channel mix follows your business model. Take a founder who splits a modest budget across Amazon Ads, Meta, Google, TikTok Shop and Pinterest in the same month. No channel gets enough spend to exit the learning phase, creative gets recycled into placements it was never designed for, and every dashboard looks mediocre. Four weak channels cost more than one strong channel earns.
Online retail is too large for that kind of drift. The U.S. Census Bureau quarterly e-commerce release tracks e-commerce as a large and steadily growing share of total U.S. retail sales. At that scale, channel selection is a capital allocation decision. Each channel needs an owner, a contribution profit target, and a stop rule for when ad cost eats the margin.
Pick the row closest to where most of your revenue comes from today, not where you hope it comes from next year. Treat the Core KPI column as your first scorecard. If you can't pull that number weekly, you're not ready to scale that model.
Lead channels and core KPIs by business model
| Business model | Lead channels | Growth lever | Core KPI | Margin trap |
|---|---|---|---|---|
| Amazon-led brand | Sponsored Products, Brand Store, Amazon DSP | Search rank and reviews | TACoS (total ad spend as a share of total sales) | Ad-driven volume hides thin margin |
| DTC brand | Paid social, search, email and SMS, owned site | Owned audience and repeat orders | Customer acquisition cost and repeat purchase rate | Acquisition cost rises faster than order value |
| Omnichannel brand | Owned site, marketplaces, retail partners, social | Shared inventory and consistent pricing | Contribution margin by channel | Price conflict between channels |
| Social-first brand | TikTok Shop, creator content, paid social | Creator-driven demand | Contribution margin after creator fees | Low customer ownership and weak attribution |
An Amazon-led brand lives on search rank. Sponsored Products defends placement, reviews defend conversion, and TACoS shows whether ads buy profitable growth or rent sales that vanish the week you pause spend. A DTC brand faces the reverse math. You own the email and SMS list, but you pay full price for every first click, so repeat purchase rate decides whether acquisition cost ever pays back.
An omnichannel brand wins on consistency. Price, stock status and delivery promise have to match everywhere, or retail partners and marketplaces undercut your own site and you end up paying twice for the same order. A social-first brand moves fastest and owns the least. Creator content can build demand overnight, but the reach is rented and the attribution is weak, which is why choosing a startup social media platform deserves real analysis on audience fit and return before you commit budget you'll have to defend every month.
Practical rule: Fund the row you are, test the row you want to become, and never fund both at full weight.
Before you add a channel, answer three questions in numbers. Where does the next dollar of revenue come from? Who owns the customer after purchase, you or the platform? Which channel loses contribution margin first when ad costs rise? A channel you can't answer for is an expense looking for justification.
Think of the buyer's path as a relay race. No single channel runs the whole track. Each one carries the shopper for one leg and either hands off cleanly or drops the baton, and your budget should follow where the drops happen.
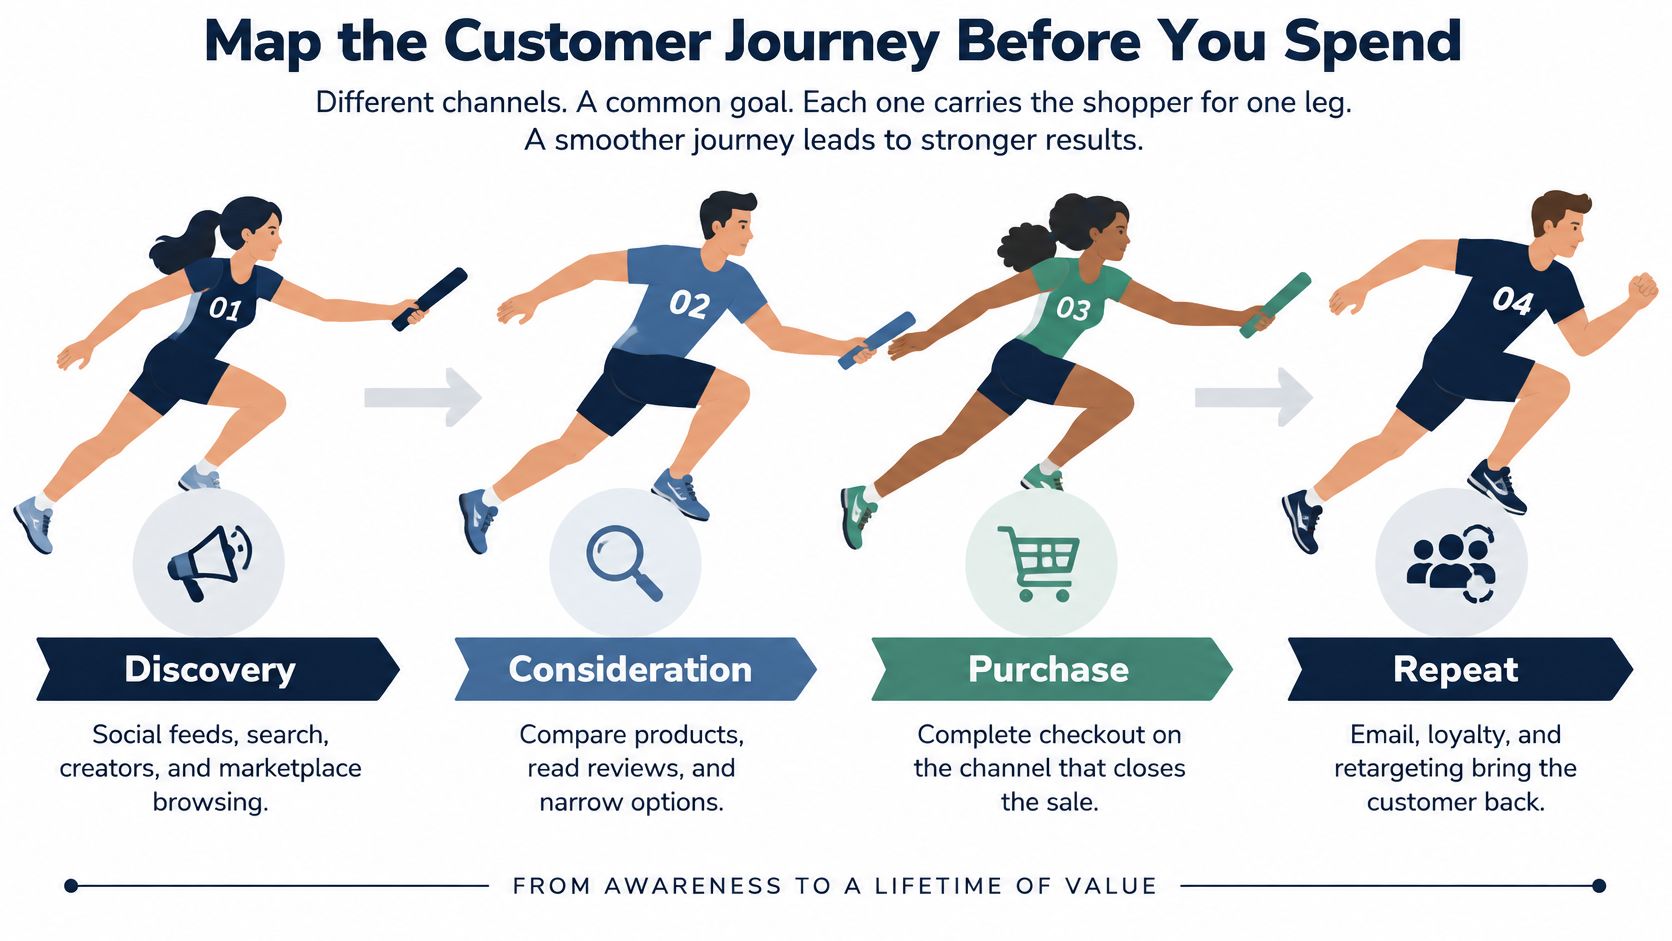
Discovery is first sight. Social feeds, search results, creator videos and marketplace browsing do this job, and you measure them by reach and assisted visits, not last-click sales. A shopper who first sees you in a creator video may not buy for two weeks. That doesn't make the video useless. It makes it a first leg.
Consideration is where trust gets built or lost. Reviews, comparison content, product questions and clear specifications move a browser toward the cart, so add-to-cart rate is the honest measure here. Thin product pages and sparse reviews leak buyers you've already paid to reach.
Purchase happens on a product page and checkout, where shipping cost, payment options and total price close or kill the order. For many brands that closing surface isn't their own site. DHL eCommerce's 2024 trends report found that 97% of global online shoppers purchased through online marketplaces in its survey of 12,000 shoppers across 24 countries. If that's your reality, judge your marketplace listing like a checkout, because for the buyer it is one.
Post-purchase is the leg most brands underfund. Delivery updates, email and SMS flows, and well-timed review requests turn a first order into a second one, measured by repeat rate. A structured view of the ecommerce sales funnel stages and handoffs helps you assign each stage an owner instead of letting every team claim the same sale.
Watch out for the reporting trap that distorts all of this. Last-click attribution credits whichever touch came final, usually branded search or a retargeting ad, and starves the discovery channels that created the demand. Brands then cut the top of the relay and wonder why the finish line goes quiet a quarter later.
Do this exercise before your next budget meeting. Pull your last 50 orders and map what you can see of each path to these four stages. Mark the stage where the most buyers disappear. That single mark tells you more about where to spend than any platform's recommended budget ever will.
Revenue can climb while profit falls, and it happens unnoticed. You raise spend, orders follow, the top line looks healthy, and meanwhile fulfillment, returns and ad costs eat the difference. The scorecard below exists to catch that early.
Core e-commerce marketing KPIs and their health checks
| KPI | Formula | What it tells you | Healthy check |
|---|---|---|---|
| ROAS | Attributed revenue / ad spend | Platform-level ad efficiency | Above the break-even ROAS from contribution margin |
| Contribution margin after ads | Revenue minus COGS, fulfillment, fees, returns and ad spend | Real profit per order | Positive for each channel, not only in total |
| Customer acquisition cost | Total acquisition spend / new customers | Cost of winning a buyer | Below first-order contribution, or recovered by repeat orders |
| Conversion rate | Orders / sessions | Health of pages and checkout | Stable or rising by traffic source |
| Repeat purchase rate | Customers with two or more orders / all customers | Retention strength | Rising across monthly cohorts |
| LTV to CAC | Lifetime contribution per customer / CAC | Room to spend on acquisition | Around 3:1 as a starting benchmark |
Contribution margin after ads sits first in importance even though ROAS is what platforms show you. It's the only figure that deducts cost of goods, fulfillment, fees, returns and ad spend together. ROAS is platform-reported revenue divided by spend. It ignores what the product cost you, so a campaign can report a strong ROAS while every order loses money.
Put customer acquisition cost next to first-order contribution. If CAC is higher than what the first order earns after costs, that customer must buy again just to pay back the spend, and you should know exactly how often that happens. For subscription and replenishment products, retention strategies for Shopify subscription brands show how pause options, delivery flexibility and win-back flows protect that second order you're counting on.
LTV to CAC extends the same logic. A ratio around 3:1 is a common starting benchmark, not a law. Below it, you're likely overpaying for growth. Far above it, you may be underinvesting and leaving profitable volume to competitors.
A healthy blended average can hide one channel that loses money on every single order.
Run two review rhythms. Check ROAS and conversion rate weekly, because they catch broken pages and fatigued creative fast. Review contribution margin and cohort repeat rates monthly, because returns and second orders need time to settle. The full set of key performance indicators for ecommerce operators helps you keep those cadences separate.
Finally, never judge blended numbers alone. Your email program can print profit while a paid channel bleeds, and the total still looks fine. I would require positive contribution by channel before any channel gets more budget. Blended health is the result. Channel-level profit is the cause.
Diversification sounds like resilience. Often it's just more places to lose money slowly. I'd challenge any plan that adds a channel for safety without first pricing what that safety costs.
Discovery increasingly happens on platforms you don't own. The image below captures the operational reality behind that, one operator juggling devices, orders and channels at once.

In DHL eCommerce's 2024 online purchasing report, 67% of online shoppers globally used social media for shopping inspiration in 2024, across a survey of 12,000 shoppers in 24 countries. You can't ignore social discovery. You also can't pretend it's free margin.
Social channels create demand but weaken customer ownership. The platform holds the relationship, attribution gets murky, and repeat purchases often need another paid touch. Marketplaces extend reach fast, but commissions, fees and price transparency compress your pricing power. Your owned site keeps the customer data and margin structure, yet each buyer costs more to win because you fund all the traffic yourself.
AI shopping assistants complicate measurement further. Their referrals often arrive looking like direct or unattributed traffic, so default reports understate or misplace their role. Judge them with holdout tests and cohort-level conversion, not with assumptions borrowed from search reporting.
Before you call any channel profitable, deduct the full load:
The video below walks through how operators think about this channel pressure in practice.
For many scaled brands, concentrating on the two or three channels with the best incremental contribution beats spreading thin across every platform. Fewer channels means deeper creative testing, cleaner inventory planning and support teams who aren't learning five returns policies. Concentration is a risk you can measure. Sprawl is a cost you usually can't.
A shopper asks an AI assistant for "a lightweight carry-on that fits underseat storage and survives weekly travel." The assistant doesn't weigh your brand story. It compares structured fields: dimensions, materials, price, delivery window, return policy. Products whose data reads cleanly get recommended. Products with gaps get skipped, and the listing a competitor filled in properly takes the order.
Treat product data as the new shelf space, because that is where the demand already sits. DHL's 2025 e-commerce trends report, drawing on a survey of 24,000 shoppers across 24 markets, found that 7 in 10 consumers want AI-powered shopping features. Visitors who arrive through assistants tend to show up with a shortlist already formed, so the cost of a missing attribute is no longer a weak listing. It is an invisible one.
Five steps make a listing recommendable and measurable:
AI referrals often surface as direct or unattributed traffic, so the default report will understate what this channel earns. Let cohorts and holdout tests deliver the verdict, and treat clean product data as a margin asset rather than a content chore.
Start with one worked example. Say a brand earns $60 of contribution on a first order after product cost, shipping, fees and returns. Its break-even acquisition cost is $60 per new customer. Every dollar of CAC above $60 must be recovered by repeat orders, on a timeline you can fund.
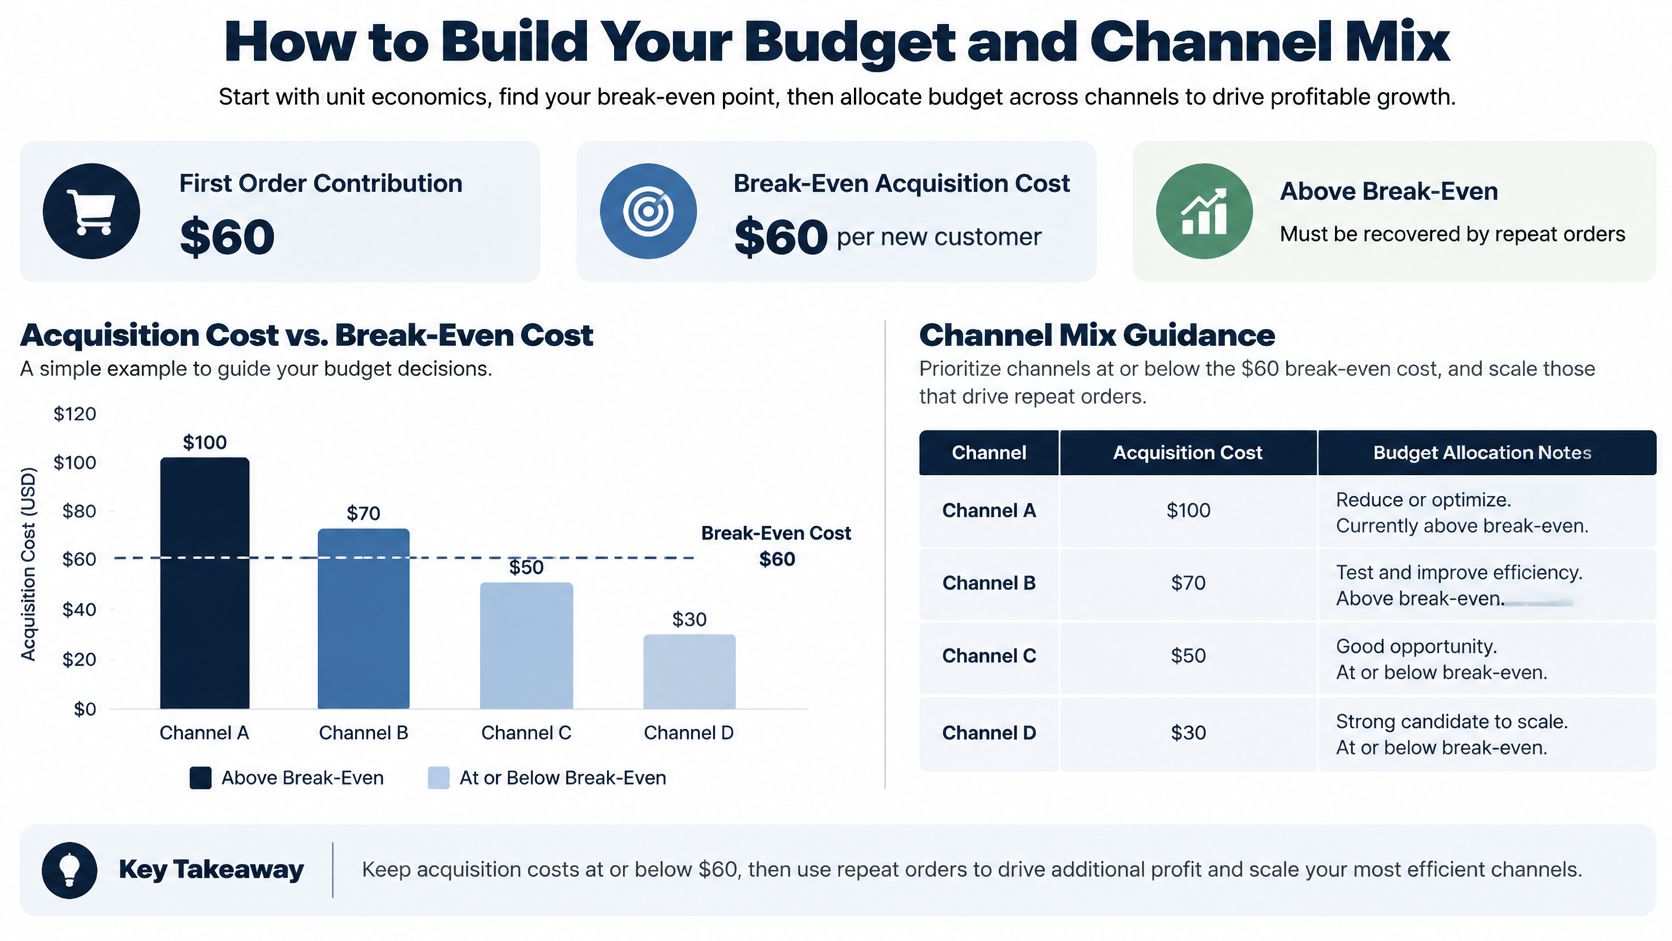
Build the budget in this order:
Starting budget split by growth stage
| Growth stage | Acquisition | Retention | Testing | Brand and content |
|---|---|---|---|---|
| Launch (first six months of sales) | 50-60% | 10-15% | 20-25% | 5-10% |
| Growth (proven channel, rising orders) | 60% | 15-20% | 10% | 10% |
| Scale (stable margin, repeat base) | 50-55% | 20-25% | 5-10% | 10-15% |
The acquisition values for the growth and scale rows are set so each row totals roughly 100%. At launch you're buying information, so testing earns a large share. At growth you press the proven channel hardest. At scale your repeat base is an asset, retention spend rises, and brand content protects pricing power you'd otherwise defend with discounts.
Acquisition numbers fall apart when buyers meet surprises late. Baymard's cart abandonment research attributes abandonment to extra costs, including shipping, taxes, and fees, for 40% of U.S. online shoppers, while 20% cite delivery that is too slow and 12% say they could not calculate the total order cost upfront. Paid traffic created the intent. Late cost disclosure destroyed it, and your blended CAC paid for the lesson.
So display an estimated delivered price and arrival window on product and cart pages. Test free-shipping thresholds against gross margin, not against conversion alone. Segment offers by geography and basket value, and pass the same delivery promise into ad and landing page copy so the click and the checkout tell one story.
Budget rule: If shipping cost isn't inside your CAC calculation, your CAC calculation is fiction.
Measure incremental profit per session, checkout completion, shipping-subsidy cost, cancellation rate and repeat purchase rate together. Transparency can lower headline conversion among low-intent visitors while improving contribution, because you stop subsidizing orders that were never profitable. Treat the table ranges as starting points to test, not fixed rules. Your contribution data outranks any generic split, including this one.
Checkout friction isn't a design opinion. It's measurable leakage. Baymard's checkout usability benchmark finds that the average U.S. ecommerce checkout displays 23.48 form elements by default, while usability testing indicates an effective flow can be reduced to approximately 12 elements, and 17% of U.S. online shoppers abandoned an order during the previous quarter because checkout was too long or complicated. Baymard also estimates improved checkout design can produce an average conversion-rate increase of 35%.
Work the fixes in priority order, and name the metric that should move for each one:
Run a holdout. Keep part of your traffic on the old flow while the rest gets the new one, then compare contribution margin per session, not revenue per session. Instrument abandonment by step, traffic source and device before you launch, or you'll know something changed without knowing what caused it.
One caveat belongs beside every test result. Urgency timers, aggressive exit discounts and stretched delivery promises can lift completion while pulling in low-quality orders that return at higher rates and contact support more often. Track the test cohort's returns and support tickets before you declare a win.
I would start with the cheapest fix, which is usually field removal, since it needs no new tooling and the benchmark gap between 23.48 elements and roughly 12 says most checkouts carry obvious dead weight. A shorter checkout that holds margin discipline beats a clever checkout that buys completion with discounts.
You can finish these six actions within one quarter, and each one produces a number or a decision you keep:
Pressure-testing numbers like these works better with operators running similar P&Ls. Million Dollar Sellers is one optional place to do that. Unlike general founder organizations such as YPO or EO, MDS focuses entirely on ecommerce operators, and its members are brand founders and leaders, not gurus or info marketers.
If your channel mix needs a sharper profit test than platform dashboards give you, Million Dollar Sellers connects you with Amazon, DTC and omnichannel founders who share real contribution numbers, budget splits and test results in private. Bring your break-even CAC and your worst-performing channel, get direct feedback from operators at your level, and leave with a mix you'd defend in your own P&L.
Join the Ecom Entrepreneur Community for Vetted 7-9 Figure Ecommerce Founders
Learn MoreYou may also like:
Learn more about our special events!
Check Events