Chilat Doina
April 2, 2026
Key Performance Indicators, or KPIs, are the vital signs of your ecommerce business. They’re specific, measurable numbers that cut through the noise and tell you exactly how you're tracking toward your biggest goals.
Think of them as clear signals that show you what’s working, what’s broken, and where the real opportunities are hiding.

Trying to grow an ecommerce brand on gut feelings alone is like trying to fly a 747 with a blindfold on. It’s a recipe for disaster. That’s where key performance indicators for ecommerce come in—they are your cockpit dashboard, giving you the precise data you need to fly straight and gain altitude.
We're going to skip the boring, surface-level definitions and dive into how top-tier Amazon and DTC sellers actually use KPIs to make profitable decisions. You'll learn which metrics matter most for your business stage, what they're really telling you, and how to track them without getting lost in spreadsheets.
The ecommerce world is exploding. Projections show the global market is set to hit $1.84 trillion by 2029, climbing at a solid 8.22% each year. For serious brands, getting a handle on these numbers isn't just about tracking progress. It’s about carving out your piece of a massive, fast-growing pie.
This guide is your roadmap. It's about turning numbers on a screen into a real-world engine for scaling your brand, whether you’re just getting started or running a nine-figure operation.
Relying on intuition is a quick way to burn through your ad budget and leave money on the table. KPIs give you cold, hard facts, letting you make decisions based on data, not just educated guesses. To really get started, it helps to understand the bigger picture of digital marketing performance metrics.
When you pick the right KPIs, you unlock some serious advantages:
At the end of the day, mastering your KPIs means you're always in the driver's seat. You’re steering your business with confidence, backed by data you can trust.

Trying to make sense of your business by looking at a giant, jumbled list of key performance indicators for ecommerce is a recipe for disaster. You'll get so lost in the weeds that you completely miss the big picture. It's information overload.
The smart move is to organize your metrics into a framework that actually tells you a story. A simple and incredibly effective way to do this is by grouping your KPIs into four core business functions.
Think of them as the four pillars holding up your entire ecommerce operation. When you look at them together, you get a stable, complete picture of your company’s health.
To help you visualize this, here’s a quick breakdown of the pillars and the kinds of metrics that fall under each one.
PillarFocus AreaExample KPIsSalesRevenue, profitability, and transaction health.Gross Revenue, Average Order Value (AOV), Gross Margin, Conversion RateMarketingCustomer acquisition, channel performance, and advertising efficiency.Customer Acquisition Cost (CAC), Return on Ad Spend (ROAS), Traffic by SourceCustomer ExperienceLoyalty, satisfaction, and long-term customer value.Customer Lifetime Value (LTV), Repeat Customer Rate, Net Promoter Score (NPS)OperationsInventory, fulfillment, and backend process efficiency.Inventory Turnover, Order Fulfillment Time, Order Accuracy Rate, Return Rate
Now, let's unpack what each of these pillars really tells you about your business.
This one is the most straightforward—it’s all about the money. Sales KPIs are the bottom-line numbers that tell you if you're actually making a profit and growing.
They answer the most basic questions: Are we making sales? How much are customers spending per order? Is our revenue heading in the right direction? This pillar is the ultimate measure of whether your business engine is working.
For instance, looking at total revenue alone isn't enough; you have to know how profitable each sale is. To really get a handle on this, you need to understand the fundamentals of unit economics for your ecommerce brand.
If the sales pillar shows you the result, the marketing pillar tracks how you got there. These KPIs measure everything you do to fuel the sales engine, from building brand awareness to bringing in new customers.
This is where you see if your ad spend, content, and email campaigns are actually paying off. It helps you answer critical questions like: Where are our customers coming from? Which channels are giving us the best bang for our buck? What does it cost us to land a new customer?
Without solid marketing performance, the sales pillar has nothing to support it.
In today's crowded market, just having a good product won't cut it. The Customer Experience pillar is all about the health of your brand’s relationship with your buyers. These metrics track satisfaction, loyalty, and your ability to turn a one-time shopper into a repeat buyer.
These metrics look past the single transaction to measure long-term health. They tell you if customers stick around, if they love your brand enough to tell their friends, and how much they’re worth over their entire relationship with you.
A strong performance here is a huge advantage. It leads to more predictable revenue and means you don't have to spend as much on marketing to keep growing.
Finally, we have the Operations pillar. This is the engine room—it covers everything that happens behind the scenes from the moment a customer clicks "buy" to the moment their package arrives.
These KPIs track your backend efficiency, covering things like inventory management, how fast you pack and ship orders, and whether you're sending out the right products.
Lousy operations can sink a business, no matter how great your marketing is. Stockouts, shipping delays, and wrong orders lead to angry customers and kill your reputation. Smooth, efficient operations are the invisible backbone that makes a fantastic customer experience possible.
Alright, let's move from big-picture concepts to the numbers that actually move the needle. This is where we break down the most critical key performance indicators for ecommerce that have a direct impact on your bottom line.
Think of each metric less like a number on a spreadsheet and more like a vital sign. A low Average Order Value isn't just a number; it’s a flashing light telling you to rethink your upselling game. A high Customer Acquisition Cost is a red flag screaming that your marketing dollars are being burned. This is how you turn raw data into decisions that fuel real, sustainable growth.
Your Conversion Rate is the bedrock of ecommerce analytics. It’s simply the percentage of your website visitors who end up making a purchase. It's the purest test of how well your entire store—from product pages and pricing to your checkout flow—convinces people to click "buy."
A low conversion rate tells you there’s friction somewhere. Maybe your site is sluggish, your navigation is a maze, or your value prop just isn't landing. On the flip side, a high rate means you've built a smooth, compelling path from browser to buyer.
Formula: (Number of Sales / Number of Visitors) x 100 = Conversion Rate (%)
Example: If your store had 50,000 visitors and 750 sales last month, your conversion rate would be 1.5%.
According to 2026 data from Shopify, the average conversion rate for ecommerce businesses sits around 1.4%. But if you can hit 3.3%, you’re in the top 20% of all stores—a performance jump of over 135%.
Average Order Value (AOV) tells you the average amount a customer spends every time they complete an order. While conversion rate tracks how many people are buying, AOV tells you how much they’re buying in one go.
Getting your AOV up is one of the most efficient ways to increase revenue without having to chase more traffic. Think about it: if one store has an AOV of $50 and another has an AOV of $80, the second store makes an extra $30,000 from the exact same 1,000 customers. This metric forces you to get smart about upselling, cross-selling, and product bundling.
Formula: Total Revenue / Number of Orders = Average Order Value
Example: If you brought in $100,000 from 2,000 orders, your AOV is $50.
Customer Acquisition Cost (CAC) is the reality check for your marketing budget. It tells you exactly how much you have to spend, on average, to win a single new customer. It pulls in all your sales and marketing expenses—ad spend, agency fees, even salaries—and divides it by the number of new customers you brought in.
A low CAC means your marketing is efficient and on-target. A rising CAC is a warning that your channels are getting tired or too expensive, signaling it's time to rethink your strategy.
Formula: Total Sales & Marketing Costs / Number of New Customers Acquired = Customer Acquisition Cost
Example: If you spent $10,000 on marketing and gained 400 new customers, your CAC is $25.
While CAC is the cost to get a customer in the door, Customer Lifetime Value (CLV) is the total amount of money you can expect to make from that customer over their entire relationship with your brand. This metric is the ultimate gauge of customer loyalty and the long-term health of your business.
Focusing on CLV forces a shift in mindset from chasing one-off sales to building lasting relationships. A high CLV means customers love your stuff, keep coming back, and become the bedrock of your profitability. After all, keeping a customer is way cheaper than finding a new one.
Learning how to calculate customer retention rate is a key first step to getting a handle on your CLV.
Cart Abandonment Rate is the percentage of shoppers who add items to their cart but bail before finishing the purchase. A high rate here is like having a leaky bucket—you're losing sales at the final, most crucial step.
This KPI is a direct report card on your checkout experience. The usual suspects for a high abandonment rate are surprise shipping costs, a clunky checkout form, or not offering enough trusted payment options. The industry average hovers around a painful 70%, meaning seven out of every ten shoppers who add to their cart leave without buying. Even small improvements here can claw back a ton of lost revenue.
Formula: (1 - [Number of Completed Purchases / Number of Carts Created]) x 100 = Cart Abandonment Rate (%)
Example: If 1,000 shopping carts were created but only 300 led to a sale, your abandonment rate is 70%.
To really get what's going on behind these numbers, you have to get comfortable with the raw data. When you analyze your ecommerce data, you start to spot the hidden trends that unlock real growth. Getting these core metrics right gives you the clarity to make smarter decisions and keep your business moving forward.
Not all ecommerce KPIs are useful all the time. In fact, their importance shifts dramatically as your business grows. A startup just fighting for its first sale and a nine-figure brand fine-tuning its global supply chain are playing two completely different sports.
Focusing on the wrong metrics at the wrong time is like using a satellite map to navigate a parking lot—it’s just noise.
The trick is to match your KPIs to your current business stage. By zeroing in on the numbers that truly matter right now, you can make smarter decisions that push you toward your next goal. We'll break this down into three phases most brands go through: Launch, Growth, and Scale.
When you're in the Launch stage, your mission is brutally simple: prove your business model actually works. You have to validate that you’ve built something people want and that your website can convince them to buy it. Forget about sophisticated retention models or inventory turnover for now.
Your entire focus should be on the foundational numbers that confirm you have product-market fit.
At this point, you're just collecting the first bits of data that will eventually form your entire strategy. The goal is survival and validation, not perfection.
This decision tree gives you a simple playbook for what to do when those early KPIs point to a problem.
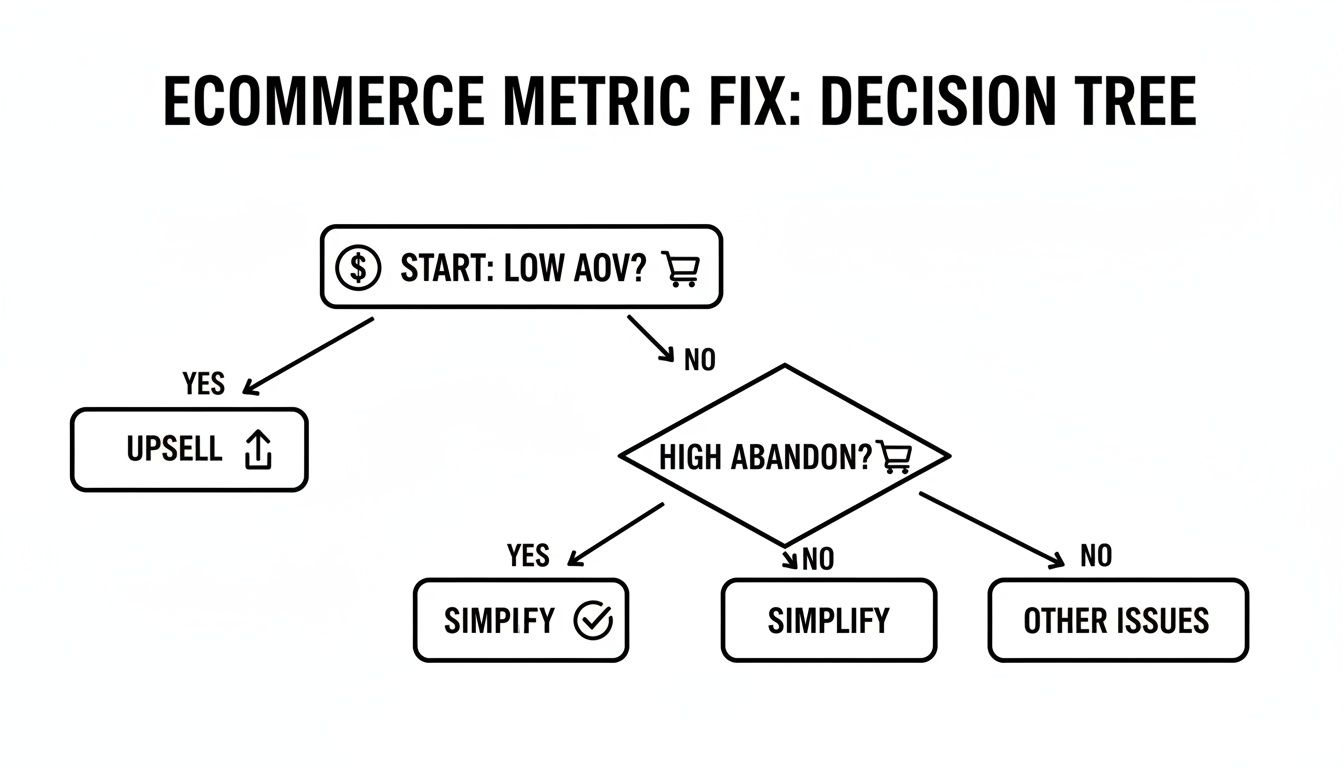
As you can see, the flowchart helps you respond quickly. If your Average Order Value is low, you need to work on upselling. If cart abandonment is high, it's time to simplify your checkout.
Once you've proven the model and revenue is flowing consistently, you’ve hit the Growth stage. The game changes from pure survival to building a profitable, repeatable engine for growth. Your focus shifts from just making sales to making profitable sales and getting customers to come back.
This is where the relationship between your metrics gets really interesting, especially the tug-of-war between what it costs to get a customer and what they're worth to you over time.
At this stage, you transition from "Can we sell this?" to "Can we sell this profitably and sustainably?" The CLV-to-CAC ratio becomes your north star.
Most seasoned operators aim to keep a CLV-to-CAC ratio of at least 3:1. In plain English, for every dollar you spend bringing a new customer in the door, you should get at least three dollars back from them over their lifetime. For Million Dollar Sellers running complex omnichannel and Amazon businesses, this ratio is everything. As you scale, ad spend climbs, and you have to know your unit economics are solid.
For example, a seller spending $25 per customer acquisition has to be confident each customer will generate at least $75 in lifetime value to keep the business healthy. You can find more on this in expert guides covering B2B marketplace metrics.
When you cross into the Scale stage, you've got a proven, profitable business. Now the challenges get more complex. It's all about operational excellence, expanding your market share, and squeezing every last drop of efficiency out of the business.
Your KPI dashboard gets a lot more granular. You’ll start obsessively tracking metrics like:
For brands selling across multiple platforms, channel-specific KPIs become non-negotiable. An Amazon-heavy seller will live and die by their Total Advertising Cost of Sale (TACOS) and Inventory Performance Index (IPI). A DTC brand, on the other hand, might be more fixated on email engagement and subscription churn rates.

Knowing your key performance indicators for ecommerce is a solid first step. But the real magic happens when you turn that raw data into a tool that helps you make smart, fast decisions. That's what an action-oriented dashboard is all about—it’s less of a report and more of a command center for your entire operation.
Think of it as the difference between a library and a pilot's cockpit. A library has every piece of information imaginable, but you have to go digging for it. A cockpit shows the pilot only the most critical data needed to fly the plane, telling them instantly if they're on course or heading for trouble. That’s what your dashboard should do for your business.
It doesn’t matter if you’re using Shopify Analytics, Google Analytics, or a specialized BI tool. The software is just the container. The real value comes from how you set it up. A truly effective dashboard is built on clarity, a sharp focus on the metrics that actually move the needle, and visualizations that make trends impossible to ignore.
A great dashboard should give you answers to your biggest questions in seconds. You ought to be able to glance at it and know immediately: Are we on pace to hit our revenue target? Is our ad spend actually making us money? Are our customers coming back?
To get there, every single element on your dashboard needs to earn its spot.
Putting together a visual guide is a fantastic starting point. You can explore more layouts and ideas in our post on creating a performance metrics dashboard to see how different designs can tell different stories about your business.
The most powerful dashboards don’t just report what happened—they help you decide what to do next. This is where "action triggers" come into play. These are simply predefined thresholds that kick off a specific response when a metric crosses them.
An action trigger is a simple "if-then" rule for your business. It transforms KPI monitoring from a passive activity ("Hmm, our conversion rate is down") into an active, systemized process that prevents small problems from escalating into crises.
For example, you could set a trigger that says: "If the weekly conversion rate drops by more than 15% compared to the four-week average, the marketing team must immediately audit the site for technical glitches or broken user journeys."
Here are a few other real-world examples:
By establishing these clear rules, you take all the guesswork and hesitation out of the equation. Your dashboard no longer just shows you what’s happening; it tells you exactly what to do about it. This is how you build a disciplined, data-driven culture where the whole team knows how to respond the moment a key indicator starts to shift.
Working with data is powerful, but it's also a minefield. Getting your ecommerce KPIs set up is a fantastic first step, but here’s the hard truth: measuring the wrong things can be even more dangerous than measuring nothing at all. You can end up chasing ghosts while your business grinds to a halt.
By getting wise to the most common traps, you can learn from others' mistakes. This keeps your focus locked on the numbers that genuinely move the needle on growth. Let's walk through the biggest pitfalls and how you can sidestep them.
This is the oldest and most common trap in the book. Vanity metrics are the numbers that look great on a slide deck but don't actually have a direct connection to your revenue or the health of your business. Think social media likes, a flood of new page views, or that one viral video that didn't result in a single sale. They feel good, but they don't pay the bills.
The antidote is actionable metrics, which tie directly to a real business outcome. For example, celebrating 10,000 likes on an Instagram post is pure vanity. But celebrating a 3.2% conversion rate from an Instagram ad that brought in $5,000 in sales? That's actionable.
The real test is simple: can this number help you make a decision that impacts your bottom line? If the answer is no, you’re probably looking at a vanity metric. Always, always prioritize the numbers that connect directly to sales, profit, and customer value.
Having endless data at your fingertips can feel like a superpower, but it often leads to analysis paralysis. This is that frustrating state of overthinking where you never actually make a decision. You spend all your time digging through reports and building out complex spreadsheets, but you fail to act on any of it.
The fix is to simplify. Instead of trying to track dozens of KPIs at once, just stick to the handful that are truly critical for where your business is right now. Build a clean, simple dashboard that shines a spotlight on these core numbers and use your action triggers to decide what to do next. Clarity beats complexity every single time.
Looking only at blended, store-wide averages is another classic mistake. A site-wide conversion rate of 2% might sound okay, but it’s hiding a much more interesting story. What if new visitors are only converting at 0.8%, while your loyal returning customers convert at a whopping 5%? What if traffic from Google Ads converts twice as well as your traffic from Facebook?
Without slicing up your data, you miss these crucial details.
By breaking down your data this way, you uncover specific opportunities and problems that were completely invisible in the averages. This allows you to make much smarter, more targeted improvements that have a real impact.
Once you start digging into your data, a ton of practical questions inevitably pop up. Let's tackle some of the most common ones we hear from sellers trying to make sense of their numbers.
There’s no single right answer here—it all depends on the metric. A good way to think about it is in different tiers of urgency. Some numbers you need to watch like a hawk, while others you only need to check in on monthly or even quarterly.
We always recommend a tiered rhythm: a quick daily glance at sales and ad metrics, a more thorough weekly review with your team, and a deep-dive monthly strategy session where you connect the dots across all your KPIs.
Everyone wants that one magic number, but the truth is, the most important KPI changes depending on your current focus. If you just launched your store, Conversion Rate is king. It's the ultimate validation that your product is desirable and your site actually works.
Once you're scaling, the CLV-to-CAC ratio often becomes the main event. It’s the clearest measure of whether your growth is both sustainable and profitable.
Stop hunting for a single "best" KPI. Instead, get obsessed with the fundamental formula of ecommerce: Traffic x Conversion Rate x Average Order Value = Revenue. Knowing how to pull these three levers together is way more powerful than focusing on any one metric in isolation.
While everyone’s chasing sales and profit, where you sell completely changes which metrics you need to live and breathe.
Amazon sellers have to master the platform's own set of rules. That means obsessing over KPIs like Total Advertising Cost of Sale (TACOS) to see if your ads are actually lifting your total sales, not just ad-attributed ones. You also have to watch your Inventory Performance Index (IPI) like a hawk to avoid nasty FBA fees and storage limits, and track your Buy Box percentage.
DTC brands have a different battle. Since they own the entire customer journey, they need to be laser-focused on Customer Acquisition Cost (CAC) for each marketing channel, Customer Lifetime Value (CLV), and the performance of their email and SMS lists. They're on the hook for generating 100% of their own traffic and keeping those customers coming back.
Don't overcomplicate it. You don't need a fancy, expensive business intelligence tool right out of the gate. Just start with the analytics already built into your platform, like Shopify Analytics or the Business Reports inside Amazon Seller Central.
Even better, fire up a simple Google Sheet. In the first column, list your top 5-7 most important KPIs (think Sessions, Orders, Conversion Rate, AOV, Revenue). Then, once a week, take 15 minutes to manually plug in the numbers. This simple act forces you to actually look at your data, and you’ll be amazed at how quickly you start spotting trends, wins, and problems that need your attention.
At Million Dollar Sellers, we know that mastering your data is a non-negotiable for scaling to 7, 8, and 9 figures. Our exclusive community is where elite ecommerce entrepreneurs share the exact strategies they use to turn KPIs into profitable action. Apply for membership today.
Join the Ecom Entrepreneur Community for Vetted 7-9 Figure Ecommerce Founders
Learn MoreYou may also like:
Learn more about our special events!
Check Events