
Chilat Doina
August 19, 2025
The profit margin formula is one of the most important numbers you can know in your business. It cuts through the noise to show you what percentage of your revenue you're actually keeping as profit.
The basic calculation is pretty simple: divide your profit by your revenue, then multiply by 100 to get the percentage.

Think of profit margin as your company’s financial health score. It’s not just some abstract number for your accountant; it’s a gut check on how well your business turns sales into real, spendable cash. A healthy percentage tells you you're doing a good job managing costs and pricing your stuff right.
Here’s an analogy: imagine your business is a car. Revenue is the fuel you pump into the tank, but the profit margin is its miles per gallon. A gas-guzzler might look powerful, but it’s burning through cash and isn't built for the long haul. A high-revenue business with a tiny profit margin is the same—all show, no go. Getting a handle on this is your first step to figuring out how to increase profitability.
A healthy profit margin is the foundation of a resilient business. It provides the necessary cushion to reinvest in growth, weather economic downturns, and ultimately build long-term value for stakeholders.
To really get the full picture, you can't just look at one number. You need to peel back the layers and understand a few different types of profit margins. We're going to break down three of the most critical ones:
Beyond just profit margin, it's also smart to calculate your rate of return to get a complete overview of your financial performance. Each of these numbers tells a different part of your business's story.
The first, and most crucial, piece of the profit margin puzzle is your gross profit margin.
Think of it as a quick health check on your core business model. It answers one simple question: after paying for the direct costs of making your product or delivering your service, how much cash is left over from each sale?
This layer strips away all the other business expenses—like marketing, salaries, or rent—to give you a crystal-clear look at your production efficiency. It's a direct reflection of your pricing strategy and how tightly you control your costs of goods sold (COGS). A healthy gross margin means your core offering is profitable right out of the gate.
The formula is pretty straightforward: subtract your COGS from your total revenue, divide that number by your total revenue, and then multiply by 100 to get a percentage. This shows you exactly how efficiently you turn revenue into actual profit. For most businesses, a median gross profit margin lands somewhere between 30% and 50%, but this can swing wildly depending on the industry. To get a feel for your specific sector, you can check out Salesforce's analysis on gross profit margin benchmarks.
Let's make this real. Imagine you run a small neighborhood bakery that brought in $50,000 in revenue last quarter.
First, you need to tally up your COGS—the direct costs tied to actually baking your goods. This would include things like:
Add those up, and your total COGS comes to $25,000. Now we can plug these numbers into the formula.
Gross Profit Margin = [(Total Revenue - COGS) / Total Revenue] x 100
Here’s a quick table to walk through the calculation for our bakery.
There you have it. The bakery has a gross profit margin of 50%.
What does this actually mean? It means for every single dollar the bakery makes in sales, 50 cents is left over. That's the money available to cover all other operating expenses (rent, marketing, admin salaries) and, hopefully, leave a nice net profit at the end.

So, your gross margin tells you if a product is profitable on its own. That's a great start, but it’s only half the story. It completely ignores the day-to-day costs of just keeping your business alive.
This is where the operating profit margin comes in, and it's a game-changer. Think of it as the efficiency engine of your financial dashboard. It shows you how good you are at managing the core of your business—the actual operations.
We get to this next layer by digging deeper and factoring in your operating expenses (OpEx). These are all the costs that are absolutely necessary to keep the lights on and the doors open, but aren't directly tied to making your product. We're talking about things like the rent for your office or warehouse, your marketing budget, and the salaries you pay your team.
By pulling these costs into the equation, the operating profit margin gives you a much sharper picture of how well your company actually generates profit from its main activities. This is all before outside factors like interest payments and taxes muddy the waters.
The calculation is a simple step up from what you did for gross profit. The formula is: (Operating Income / Revenue) x 100.
Your operating income is just your gross profit minus all those operating expenses. This includes the big stuff often lumped into "selling, general, and administrative" (SG&A) costs. For a more detailed look, you can dig into the specifics of operating margin.
A strong operating profit margin signals a well-oiled machine. It means you’re not just selling products at a good price—you’re also running your daily operations efficiently and keeping costs in check.
Let’s go back to our bakery to see how this plays out. We know the bakery had a gross profit of $25,000. Now, let's factor in its operating expenses for the quarter:
The bakery's total OpEx comes to $16,000. We subtract that from the $25,000 gross profit, which leaves us with an operating income of $9,000.
Now for the magic number. The operating profit margin is 18% ($9,000 operating income / $50,000 total revenue).
This number is huge. It means that after paying for ingredients and the costs of running the shop, the bakery keeps 18 cents of every single dollar it earns. If that number feels low, it’s a massive red flag telling you it’s time to learn how to improve operational efficiency and get your bottom line healthy again.

Alright, we've peeled back the first two layers of profitability. Now we get to the one that really matters: the net profit margin.
This is the famous "bottom line," the final number that tells you exactly what percentage of your revenue is left after every single expense has been paid. We’re talking about COGS, operating expenses, and all the non-operational costs that operating margin ignores, like interest on loans and corporate taxes.
It’s the truest measure of a company’s financial health from top to bottom. It’s the number that investors and CEOs obsess over because it shows how good a business is at turning sales into actual, take-home profit.
The formula for net profit margin is the most comprehensive one we’ve looked at. You just divide your net income (total revenue minus all expenses) by your total revenue, and then multiply by 100. Simple, yet powerful.
Let's finish up with our bakery example. We already know its operating income was $9,000. To find the net income, we have to subtract the last few costs:
Taking those out leaves the bakery with a net income of $6,000. Now, we just plug that into the formula.
With $50,000 in revenue, the bakery’s net profit margin is 12%. This means for every dollar that comes in the door, the bakery keeps 12 cents as pure profit.
The net profit margin is the ultimate report card for your business. It doesn’t just show how efficiently you run your day-to-day operations; it reveals your total financial health and how well you manage everything from debt to taxes.
What’s considered "good" really depends on your industry. Financial services and tech companies often see margins above 15%, while sectors with tight margins, like grocery stores, might only hover between 1% and 5%.
Knowing where you stand against your industry’s benchmark is critical for judging your own performance. For a deeper dive into these differences, you can find a solid breakdown on how to calculate profit margin across different sectors.
Looking at each profit margin by itself is helpful, but the real magic happens when you analyze them together. This is where you get the true story of your business's financial health.
Think of it like a three-stage water filter. Each stage removes different impurities, turning cloudy water (your revenue) into pure, drinkable water (your net profit). If the flow slows down at any point, you know exactly where the blockage is.
It's the same with your margins. A huge gap between your gross and operating margins screams high overhead. Sure, your products are profitable on their own, but daily costs like rent, marketing, and salaries are eating away at that success.
Then, if you see an even wider gap between your operating and net margins, you've got a problem with non-operating expenses. This could be anything from hefty interest payments on a loan to a surprisingly large tax bill. This comparative view turns a bunch of numbers into a powerful diagnostic tool.
To make this even clearer, here's a simple breakdown of the three main profit margins, what they include, and what they reveal about your business.
Each formula gives you a different piece of the puzzle, showing you where your money is really going.
Getting the inputs right for these formulas is everything. So many people trip up on the small stuff, which can throw off their entire analysis.
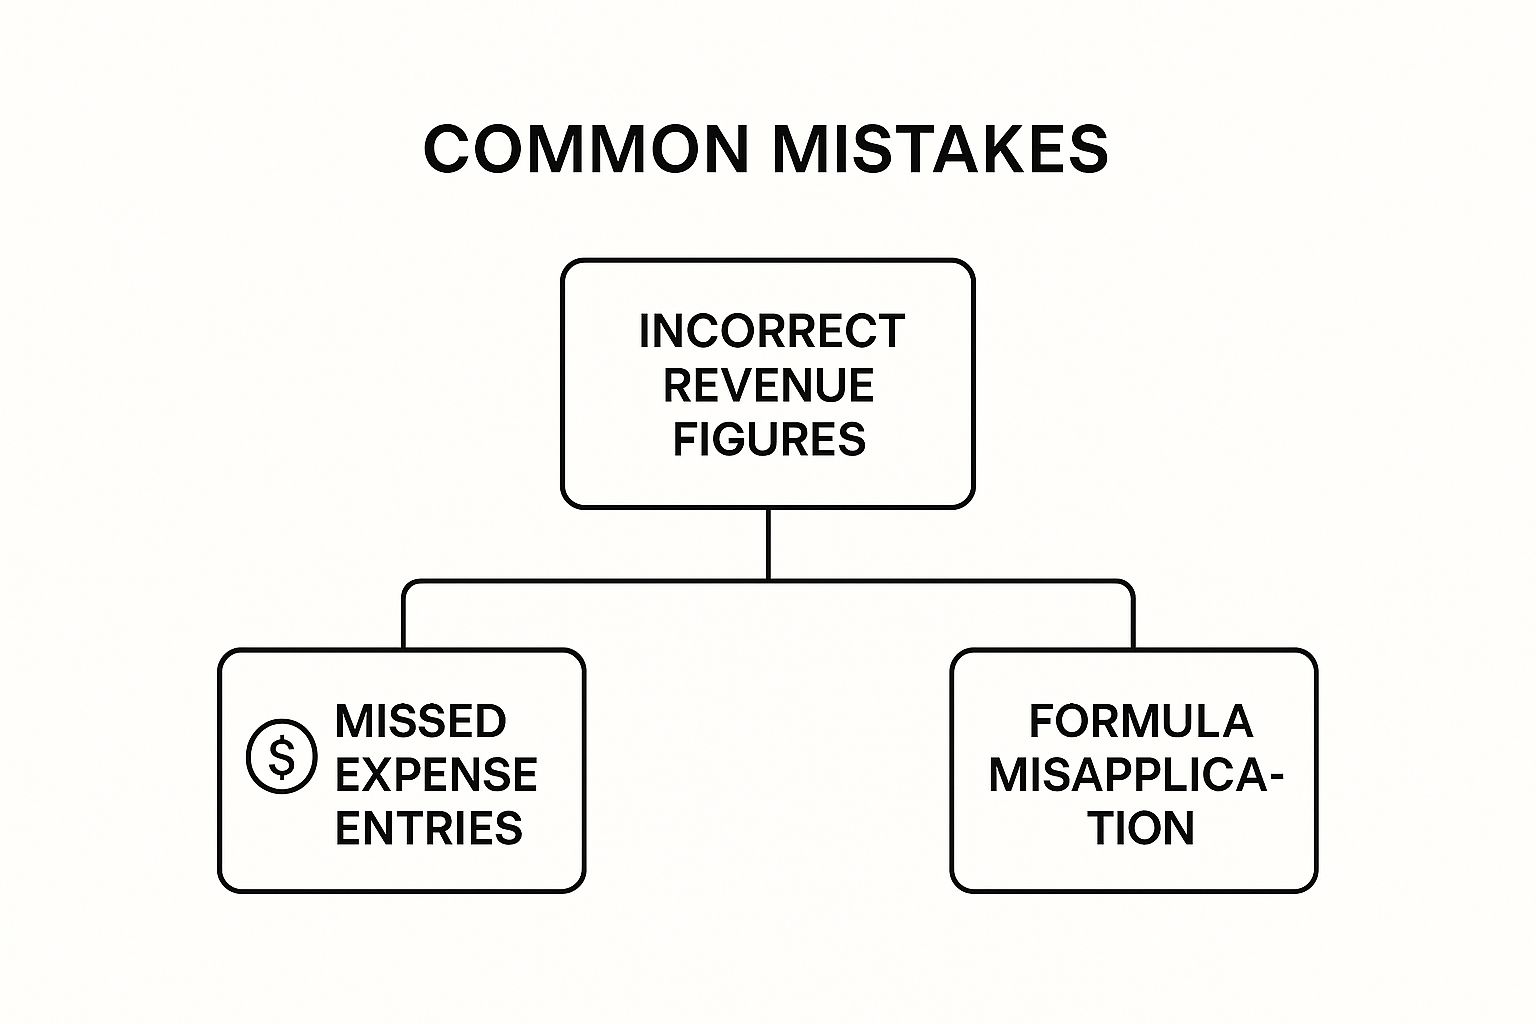
As you can see, the most common mistakes come from using the wrong revenue figures, forgetting to include certain expenses, or just mixing up the formulas.
Analyzing all three margins together allows you to pinpoint weaknesses with precision. A high gross margin is great, but it doesn't mean much if exorbitant operating costs leave you with a 2% net margin.
This level of detail is absolutely essential when it comes to pricing. For example, knowing you have strong gross margins gives you a lot more room to play with your ecommerce pricing strategies, letting you run promotions or offer discounts without torpedoing your overall profitability.
Knowing the profit margin calculation formula is one thing. Applying it correctly is a whole other ball game, and it’s where a lot of entrepreneurs trip up. A simple slip of the finger on a calculator can ripple out, leading to bad pricing strategies, wonky inventory orders, and a completely skewed view of your business's health.
Getting these numbers right isn't just about math—it's about making sure the story your financials tell you is the true one.
One of the easiest mistakes to make is putting a cost in the wrong bucket. It happens all the time. Someone accidentally lumps a Facebook ad campaign into their Cost of Goods Sold (COGS) or counts a direct manufacturing cost as a general operating expense.
This might seem like a small detail, but it can throw your numbers way off. One wrong move and you’ll get a completely misleading picture of your product’s profitability (gross margin) or how efficiently you’re running your business (operating margin).
Another classic pitfall is pulling data from different time periods. You can't compare last month’s revenue against last year’s quarterly expenses and expect to get anything useful. It just doesn't work. Make sure every piece of data—revenue, COGS, and operating costs—is from the exact same timeframe, whether it’s a month, a quarter, or a full year.
It's not just about getting a number; it's about getting the right number. Precision is everything if you want to make sound financial decisions.
Finally, resist the urge to compare your margins directly to a business in a totally different field. A 10% net margin might be fantastic for a high-volume grocery store, but it could be a sign of major trouble for a software company. Context is key. Without it, your analysis is just numbers on a page.
Alright, you've got the formula down. But knowing how to plug in the numbers is one thing; understanding what they really mean for your business is another. Let's tackle a couple of the most common questions that come up.
This is the million-dollar question, isn't it? The honest answer is, it completely depends on your industry.
A high-volume grocery store might be thrilled with a 5% net profit margin. On the other hand, a software company with low overhead could be aiming for 20% or even higher. The key is to stop comparing apples to oranges. Benchmark your numbers against your direct competitors, not businesses in totally different fields.
A "good" margin is simply one that's healthy for your specific industry and gives you the fuel you need for sustainable growth.
Boosting your margin isn't just about cranking up sales. It’s about being smarter with your money and operations.
Here are a few places to start:
It's a classic trap: a business can have a fantastic gross margin but still be bleeding cash because its operating expenses are through the roof. This happens when a company is great at making its product but inefficient at actually running the business, leading straight to a negative net profit.
This is exactly why you need to look at all three margins—gross, operating, and net—to get the full story of your company's financial health.
At Million Dollar Sellers, top e-commerce founders share the exact strategies they use to optimize margins and scale their brands. Learn more at https://milliondollarsellers.com.
Join the Ecom Entrepreneur Community for Vetted 7-9 Figure Ecommerce Founders
Learn MoreYou may also like:
Learn more about our special events!
Check Events