Chilat Doina
November 22, 2025
Inventory turnover is the metric that tells you how many times your business sells and replaces its entire stock of inventory over a specific period.
Think of it as a speedometer for your products. A higher number means things are flying off the shelves, while a lower number signals a much slower pace. It’s a crucial vital sign for your business's operational efficiency and overall sales performance.

Let's use an analogy. Imagine your inventory is like the food in your kitchen pantry. Some items, like milk and bread, you buy and use up constantly. Others, like that fancy jar of saffron, might sit there for months. Inventory turnover is simply the measure of how quickly you're cycling through everything in that pantry.
A high turnover rate is a great sign. It points to strong sales and smart inventory management, much like a popular restaurant that needs fresh ingredients delivered every single day. This means your cash isn't getting stuck in products that are just gathering dust. Instead, that money is constantly flowing back into the business, ready to be put to work again.
On the flip side, a low turnover rate can be a serious red flag. It often means you've overstocked items that aren't selling, tying up precious cash in "stale" goods. This is the business equivalent of a pantry full of expired cans—wasted space, wasted money, and a huge missed opportunity to stock what your customers actually want.
Getting a handle on your turnover rate is fundamental because it tells a powerful story about your business's health. It goes way beyond a simple sales count, giving you a much deeper look into how well your entire operation is humming along. This one number connects your purchasing, marketing, and sales efforts, showing you exactly how effectively they're all working together.
It's a key performance indicator used by businesses worldwide, calculated with a straightforward formula: Cost of Goods Sold (COGS) divided by Average Inventory.
For example, if a business has $400,000 in COGS and an average inventory value of $45,000, its turnover ratio is about 8.89. This means it sells through its entire inventory almost nine times a year, or roughly every 41 days.
At its core, inventory turnover reveals how well you are converting your investment in products into sales revenue. It's a direct reflection of demand, purchasing accuracy, and your ability to manage your most significant asset—your stock.
To give you a quick reference, here's a breakdown of the core concepts we're discussing.
ConceptWhat It Tells YouWhy It's ImportantInventory TurnoverHow many times you sell and replace your entire inventory in a period.A high-level indicator of sales velocity and operational efficiency.Sell-Through RateThe percentage of units sold from a specific batch of inventory.Great for measuring the success of a single product or promotion.Days of InventoryThe average number of days it takes to sell your entire inventory.Puts turnover into a more intuitive, time-based context.GMROIHow much gross profit you earn for every dollar invested in inventory.Connects inventory performance directly to profitability.
These metrics all paint a part of the picture, but turnover is the cornerstone.
It's really easy to get inventory turnover mixed up with other similar-sounding metrics. While they all measure how your inventory is performing, they each tell a different part of the story and give you a unique lens to view your operational success.
Think of it this way: inventory turnover is the strategic, big-picture view. It assesses the efficiency of your entire inventory system over a longer period, like a quarter or a full year. Mastering this concept is the first real step toward building a more profitable and resilient ecommerce business.
Alright, now that you know what inventory turnover is, let's get our hands dirty and actually calculate it. This isn't just some number for your accountant to worry about; it's a vital sign for your business health that you can calculate yourself.
There are two main ways to do this. One is the gold standard, and the other is a decent backup. Let's break them down.
The best and most accurate way to calculate your turnover ratio is by using your Cost of Goods Sold (COGS). Think of it this way: you're comparing the cost of the inventory you sold with the cost of the inventory you were holding. It's a true apples-to-apples comparison, which is why it's the preferred method.
The formula itself is refreshingly simple. You only need two numbers from your financial reports.
Inventory Turnover Ratio = Cost of Goods Sold / Average Inventory
So, where do you find these numbers?
For a more detailed walkthrough, this guide on mastering the inventory turnover ratio calculation is a great resource.
While the COGS method is king, some businesses use total sales revenue instead. It's a less precise approach because you're comparing revenue (which includes your profit margin) to inventory that's valued at cost. This mismatch can make your turnover ratio look a little better than it actually is.
The formula looks like this: Inventory Turnover = Net Sales / Average Inventory
This can work for a quick, back-of-the-napkin estimate if your COGS data isn't handy. But for serious internal analysis or benchmarking against competitors, you'll want to stick with the COGS method.
To make the choice clearer, here’s a quick comparison of the two methods.
MethodFormulaBest ForKey AdvantageCOGS MethodCOGS / Average InventoryInternal analysis, investor reporting, and accurate benchmarking.Provides a true, cost-based comparison for maximum accuracy.Sales MethodNet Sales / Average InventoryQuick, high-level estimates when COGS data is unavailable.Simple to calculate if you only have sales and inventory figures.
Ultimately, while the Sales method has its place for quick checks, the COGS method gives you the unvarnished truth about your inventory efficiency.
Let's walk through an example to see it in action. Imagine you run an online store selling premium coffee beans and you want to calculate your turnover for the last year.
First, you grab your financial statements.
Now, just plug those numbers into our standard formula:
$500,000 (COGS) / $60,000 (Average Inventory) = 8.33
Boom. Your inventory turnover ratio is 8.33. This means your coffee business sold through its entire stock of inventory about 8.3 times over the course of the year.
A ratio of 8.33 is a solid metric, but it can feel a bit abstract. What does it really mean for your day-to-day operations? This is where Days Sales of Inventory (DSI) comes in.
DSI (also called Days of Inventory on Hand) translates your turnover ratio into a simple number: the average number of days it takes you to sell your entire inventory.
The formula is a piece of cake:
DSI = 365 Days / Inventory Turnover Ratio
Using our coffee brand example:
365 / 8.33 = 43.8 days
This tells us that, on average, it takes your business about 44 days to sell through its inventory. Now that's a number you can work with. It's much more intuitive and directly answers the crucial question: "How long is my cash tied up in products just sitting on the shelf?"
So, you've crunched the numbers and have your inventory turnover ratio. Now what? Is that number good, bad, or just… a number?
The honest answer: it completely depends on your industry. There's no single magic number that defines success for every ecommerce brand. A ratio that would be fantastic for a fast-fashion store could spell disaster for a high-end furniture maker. Context is absolutely everything.
Before we dive into benchmarks, let's refresh on the core calculation. It's the starting point for any meaningful comparison.
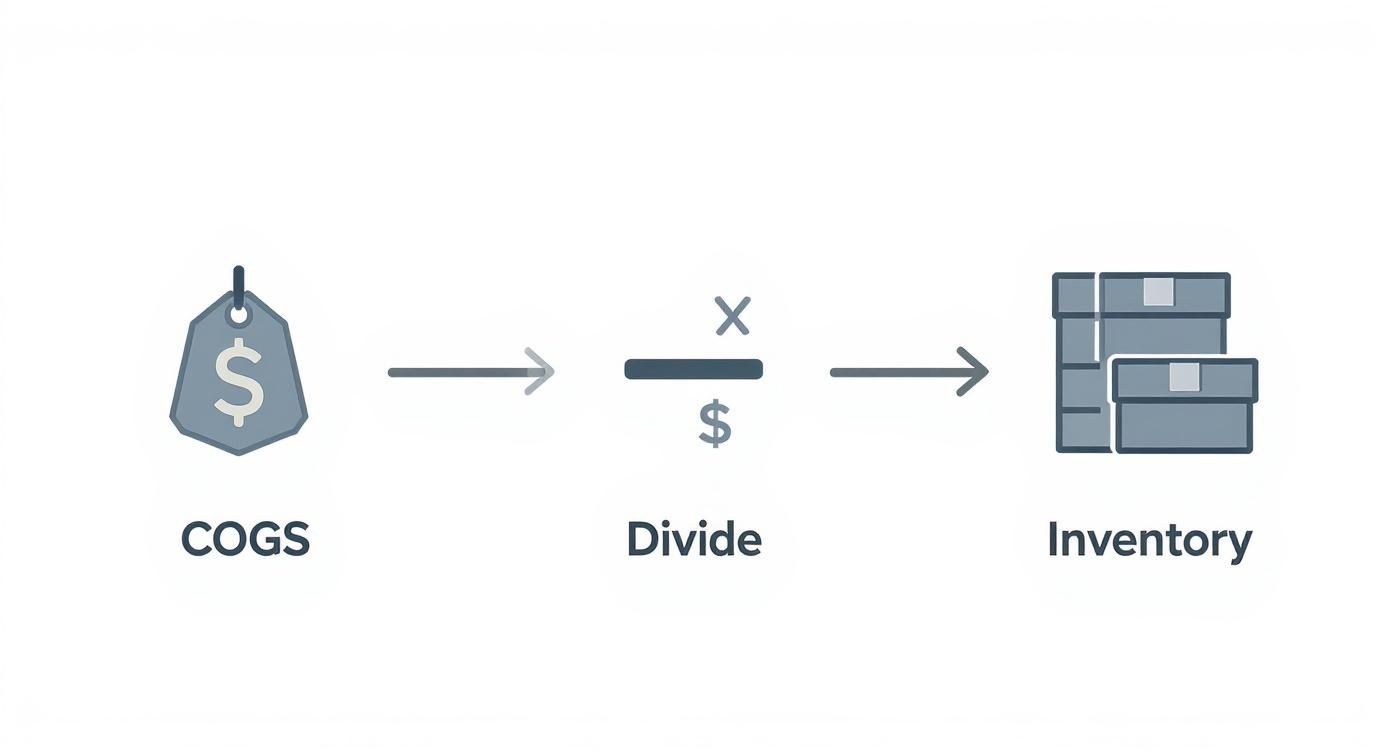
This simple formula shows how what you sell (COGS) relates to what you're holding (Average Inventory) to give you your turnover rate.
The only way to know if your ratio is healthy is to measure it against your industry's standards. A grocer selling perishable milk needs to turn over stock at lightning speed, while a car dealership will naturally have a much slower, more deliberate turnover.
Let’s look at some typical turnover ratios across different sectors to give you a clearer picture:
By figuring out where your niche fits within these broader categories, you can set realistic goals for your own business.
Generally, a high inventory turnover is a great sign. It means you have strong sales, people want your products, and your supply chain is humming along efficiently. Your inventory isn't just sitting there collecting dust; it's actively making you money.
But—and this is a big but—a ratio that's too high can be a red flag.
An excessively high turnover rate might mean you're under-stocking. This leads to stockouts, which don't just cost you a sale today—they can damage customer loyalty and send shoppers straight to your competition.
It can also mean you're placing a ton of small, frequent orders, which might be racking up your shipping and administrative costs. The goal isn't just moving products fast; it's about finding a profitable, sustainable rhythm.
On the flip side, a low inventory turnover ratio is almost always a problem. It’s a clear signal that your products are moving too slowly, and that has some serious knock-on effects.
A slow turnover rate is a direct drain on your profitability and makes your business less agile. It's a flashing neon sign telling you it's time to rethink your inventory strategy from the ground up. Finding that sweet spot between meeting demand and not tying up cash is the name of the game.
Getting a handle on your inventory turnover ratio isn't just some academic exercise—it's like popping the hood on your business's financial engine. This one metric is the bridge between your warehouse shelves and your bank account. It shows you exactly how well your biggest asset, your stock, is actually making you money.
Think of slow-moving inventory as a sponge, just sitting there soaking up your working capital. Every dollar tied up in a product that isn't selling is a dollar you can't pump into a new marketing campaign, product development, or any other real growth opportunity. It’s an invisible anchor dragging down your entire financial performance.
On the flip side, a healthy, zippy turnover rate frees up cash every time you sell something. Products move, cash comes back into the business faster, and you can put it right back to work. This creates a powerful cycle of reinvestment and growth that makes your company nimbler and tougher. If you really want to connect the dots, it's worth your time mastering the cash conversion cycle, which puts inventory turnover right at the heart of your company's cash flow health.
Beyond just trapping your cash, holding onto unsold products racks up a whole list of direct expenses. We call these holding costs (or carrying costs), and they are the real, tangible expenses that quietly drain your profits the longer an item gathers dust.
These costs are easy to forget about, but they can be brutal, sometimes eating up 20-30% of your inventory's value over the course of a year. The main culprits are:
Speeding up your inventory turnover directly slashes these costs. You can boost your net profit margin without selling a single extra unit.
Let's make this real. Imagine a DTC brand that has $200,000 in average inventory and an annual turnover ratio of 4x. Simple math tells us their inventory sits for an average of 91 days before it sells.
Now, let's say they dial in their forecasting and marketing, pushing their turnover up to 6x. Suddenly, their inventory is only sitting for about 61 days. This isn't just a win on a spreadsheet; it's a massive financial game-changer.
By jumping from a 4x to a 6x turnover, the business unlocked a huge amount of cash. They're now driving the same amount of sales but with way less money tied up in inventory at any given moment. That's a dramatic leap in capital efficiency.
This one improvement triggers a domino effect across the business:
At the end of the day, a strong inventory turnover ratio isn't just about moving boxes. It’s about building a leaner, more profitable, and financially solid business that can pivot on a dime and jump on new opportunities.
Knowing your inventory turnover ratio is one thing. Actually improving it is where the real money is made. Boosting this number isn’t about guesswork; it’s about making targeted, data-backed moves that make your whole operation hum.
Think of it like tuning an engine. A few smart tweaks can give you a massive performance boost, freeing up cash and fattening your profit margins. These proven tactics are a clear roadmap any business can follow to get their inventory flying off the shelves.
A healthy turnover rate starts with one thing: knowing what your customers want and when they’ll want it. Solid demand forecasting is your crystal ball, helping you order just the right amount of stock to avoid both cash-sucking overstock and sale-killing stockouts.
Stop relying on gut feelings. It’s time to dig into your data to spot the patterns.
The better you get at predicting demand, the smarter your purchasing decisions will be—and the better your turnover ratio will look.
Let’s be honest: not all of your inventory is created equal. You’ve got your superstars, and you’ve got your slow-and-steady sellers. Treating them all the same is a recipe for a cash flow nightmare. A structured system helps you put your money and effort where it counts.
The go-to method here is ABC analysis. This technique is all about sorting your products into three buckets based on how much value they bring to your business:
By focusing your energy on the high-value A-items, you ensure your most profitable products are always ready to ship. This alone will naturally speed up your overall turnover. For a deeper dive, check out these inventory management best practices.
How long does it take to get an order from your supplier to your warehouse doors? That window, your lead time, directly impacts how much safety stock you have to keep on hand. Shorter lead times mean you can carry less inventory without risking stockouts, which gives your turnover ratio an immediate boost.
Start working on making your supply chain faster and more dependable.
Even shaving just a few days off your lead time can create a massive ripple effect across your entire inventory efficiency.
Even with perfect planning, you’re going to end up with some slow-moving products (your C-items). Letting them collect dust is like lighting cash on fire. Instead, get strategic with promotions to clear them out and turn that dead stock back into liquid cash.
Don’t just throw a random "50% Off!" sale at the wall and hope it sticks. Get a little more creative.
These moves don't just help your inventory turnover; they inject cash right back into your business that you can immediately reinvest in your winners.
Even when you've got the basics down, a few tricky questions always pop up when you start applying inventory turnover to your actual business. Here are the clear, no-fluff answers to the questions we hear most often from ecommerce founders.
You bet it can. While a high turnover rate usually looks great on paper—it means sales are flying—an extremely high number can be a major red flag. It’s often a sign that you’re not carrying enough inventory.
This leads straight to stockouts, which means lost sales and annoyed customers who will happily buy from your competitor. It can also mean you're placing a ton of small, frequent orders, which jacks up your shipping and admin costs and chips away at your profit margins. The real goal isn't the highest number possible, but the right number—that sweet spot where you meet demand without tying up cash or leaving money on the table.
Seasonality can throw a massive wrench in your inventory turnover calculations. A business slinging swimwear is going to have an incredible turnover in the spring and a dismal one in the fall. That’s just the nature of the beast.
Because of these predictable swings, looking at a single annual turnover ratio can be completely misleading. A much smarter way to do it is to measure turnover for specific periods, like Q2, and compare it to Q2 of last year. This gives you a true apples-to-apples comparison of how you’re really performing.
Both of these metrics tell you how fast you're moving product, but they look at your business from completely different altitudes. Think of it like using a telescope versus a microscope.
At Million Dollar Sellers, we know that mastering metrics like inventory turnover is what separates the good ecommerce businesses from the great ones. Our exclusive community is where 7-, 8-, and 9-figure founders share the exact strategies they use to optimize their operations, scale their brands, and stay ahead of the curve. If you're ready to learn from the best in the business, find out if you qualify for MDS. Apply to join Million Dollar Sellers.
Join the Ecom Entrepreneur Community for Vetted 7-9 Figure Ecommerce Founders
Learn MoreYou may also like:
Learn more about our special events!
Check Events