


Stay Updated with Everything about MDS
Thank you! Your submission has been received!
Oops! Something went wrong while submitting the form.

Chilat Doina
December 19, 2025
So, what’s the real story behind your sales numbers?
When all the dust settles—after you’ve paid for your products, your marketing, your software, and even the tax man—what’s actually left in the bank? That final number is what we’re talking about when we discuss net profit margin.
It’s the percentage of revenue that’s pure profit. Think of it as your business’s true take-home pay. It shows you the exact amount of profit you generate from every single dollar in sales.
Racking up huge revenue numbers feels fantastic, but on their own, they don't tell you much. It's a classic vanity metric.
Imagine an e-commerce brand popping the champagne after hitting $1 million in sales. Sounds incredible, right? But what if, after paying for inventory, FBA fees, ad spend, software subscriptions, and taxes, they only have $20,000 left over?

That $20,000 means their net profit margin is a razor-thin 2%. This is the number that cuts through the noise. It reveals the actual financial health of your business and answers the one question every entrepreneur needs to know: How much are we really making?
Focusing on net profit margin forces a huge mindset shift. You stop chasing sales for the sake of sales and start building a genuinely sustainable, resilient company. It’s the final score on your financial report card.
A strong margin shows you have a tight grip on your entire cost structure. A weak one, on the other hand, is a massive red flag that something is broken, even if your sales charts are going up and to the right.
This number comes straight from your company’s financial statements. Getting a handle on your bottom line starts with truly understanding your Profit and Loss (P&L) statement, which is where your net profit is calculated. For a deeper look at this crucial report, check out our guide to the profit and loss statement for e-commerce.
The bottom line isn't just a figure at the end of a report; it’s the definitive indicator of your business’s ability to survive, thrive, and generate real wealth. It forces you to look past sales volume and confront the reality of your costs.
At the end of the day, this one percentage tells a more powerful story than any revenue goal ever could. It’s what separates a business that just looks successful from one that’s actually built to last. Once you master what net profit margin is telling you, you gain the clarity to make smarter decisions, fine-tune your operations, and build for the long haul.
Alright, now that we've covered why net profit margin is such a vital sign for your business's health, let's get our hands dirty. Calculating this number isn't some dark art reserved for accountants—it's a straightforward process every e-commerce owner can, and absolutely should, master.
We'll break down the formula and then walk through a real-world example to pull back the curtain on the whole thing.

The formula itself is refreshingly simple:
Net Profit Margin = (Net Income / Total Revenue) x 100
This little equation takes your final profit and spits it out as a percentage. That makes it incredibly easy to track your performance over time and see how you stack up against others in your industry. To use it, we just need to nail down two numbers: Total Revenue and Net Income.
This is the easy part. Total Revenue is your "top line"—the full amount of money your business brought in from sales before a single expense is taken out. For an e-commerce brand, this is the sum of every sale from your website, Amazon, Etsy, or any other channel you sell on.
Let's use a fictional Shopify store, "Glow Skincare," as our guinea pig. They sell high-end cosmetic products. In a given month, their sales hit a solid $50,000. That's their Total Revenue. Simple as that.
Net Income is where the real story of your business profitability gets told. It’s your "bottom line," the actual profit left in the bank after every single business expense has been paid. Think of it as a financial deep clean, sweeping away all the costs to reveal what you truly earned.
Here’s how you find it:
Net Income = Total Revenue – (COGS + Operating Expenses + Interest + Taxes)
To figure out Glow Skincare's Net Income, we need to subtract all their costs from that $50,000 in revenue. Let's break it down.
Now, let's add up all those expenses:
Total Expenses = $15,000 (COGS) + $17,800 (OpEx) + $200 (Interest) + $1,500 (Taxes) = $34,500
With our total expenses tallied, finding the Net Income is a piece of cake:
Net Income = $50,000 (Revenue) - $34,500 (Total Expenses) = $15,500
Boom. Glow Skincare’s Net Income for the month is $15,500. This is the cash they actually generated.
We have our two key ingredients: Total Revenue and Net Income. Now we just plug them back into our main formula to get that magic percentage.
Net Profit Margin = ($15,500 / $50,000) x 100
Net Profit Margin = 0.31 x 100
Net Profit Margin = 31%
What does this mean? For every $1 in sales Glow Skincare made, 31 cents was pure profit. That single number gives a crystal-clear snapshot of their financial efficiency and true profitability.
Knowing your net profit margin is a great start, but its real power comes alive when you put it side-by-side with its two siblings: gross profit margin and operating profit margin.
Not all profit margins tell the same story. Each one peels back a different layer of your company's financials, giving you a unique glimpse into how you make money—and, more importantly, where it all goes.
Think of your business's profitability like an onion. The outer skin is your total revenue, the starting point for everything. With each margin we look at, we peel back another layer of costs, getting closer to the core truth of your financial health.
The very first layer we peel away gets us to your gross profit margin. This metric is all about your production efficiency. It answers one simple but crucial question: How profitable are my products, before any other business costs get involved?
To figure this out, you just subtract the Cost of Goods Sold (COGS) from your revenue. COGS includes only the direct costs of making your products—think raw materials, manufacturing, and packaging. It deliberately ignores everything else, like marketing spend, employee salaries, and rent.
Let's go back to our example, Glow Skincare, which brought in $50,000 in revenue with $15,000 in COGS.
A 70% gross margin is fantastic. It tells Glow Skincare they’re making a healthy profit on their physical products alone. If this number were low, it would be a red flag pointing to problems with their supply chain, manufacturing costs, or pricing. To dive deeper into this first layer, you can learn more about what is gross margin and how to improve it.
Next, we peel back another, much bigger layer to find the operating profit margin. This metric takes us a step further, showing how efficiently you run the day-to-day business. It reveals the profit generated from your core operations before you account for non-operational things like interest payments and taxes.
To get this number, you subtract both COGS and all your operating expenses (OpEx) from revenue. OpEx is where you find costs like marketing, salaries, Shopify fees, and warehouse rent.
For Glow Skincare, their operating expenses came to $17,800.
This 34.4% margin shows how well the company is managing its operational costs. If it starts to dip, it could mean their ad spend is getting less effective or that overhead is creeping up. It’s a key indicator of the company’s operational horsepower.
By comparing gross, operating, and net margins, you create a narrative. You can see precisely where your revenue is being eroded—is it high production costs, bloated operational spending, or external factors like debt and taxes?
Finally, we peel away the last layer to get to the core of the onion: the net profit margin. This is the bottom line, the ultimate measure of profitability. It tells you exactly what percentage of revenue is left as pure profit after every single expense has been paid—COGS, OpEx, interest, and taxes.
As we figured out earlier, Glow Skincare's total expenses were $34,500, leaving them with a Net Income of $15,500.
Here’s a quick summary of how the profit shrinks at each stage for our example brand:
MetricCalculation (from $50,000 Revenue)Resulting MarginWhat It RevealsGross MarginSubtracts only COGS ($15,000)70%Profitability of the products themselves.Operating MarginSubtracts COGS & OpEx ($32,800 total)34.4%Efficiency of core business operations.Net MarginSubtracts all expenses ($34,500 total)31%The final, all-in profitability.
Looking at these three margins together is like running a full diagnostic on your business. You might have an amazing 70% gross margin, but if your net margin is only 5%, you know instantly that your operating expenses are eating up almost all your profit. This layered view is essential for pinpointing exactly where your business needs to improve.
So you’ve calculated your net profit margin. The big question is: is it any good?
Honestly, there’s no single magic number. What’s considered fantastic for a DTC skincare brand could be a disaster for an electronics dropshipper. The right benchmark really depends on your niche, business model, and how you’re set up.
That said, a generally accepted range for a healthy e-commerce net profit margin is somewhere between 5% and 10%. But that average hides a ton of variation. High-margin categories like jewelry or cosmetics can often pull in 15% or more, while hyper-competitive sectors like consumer electronics might be fighting tooth and nail for 3-5%.
This flowchart shows how your revenue gets whittled down at each stage, from your top-line sales all the way to the final net profit.
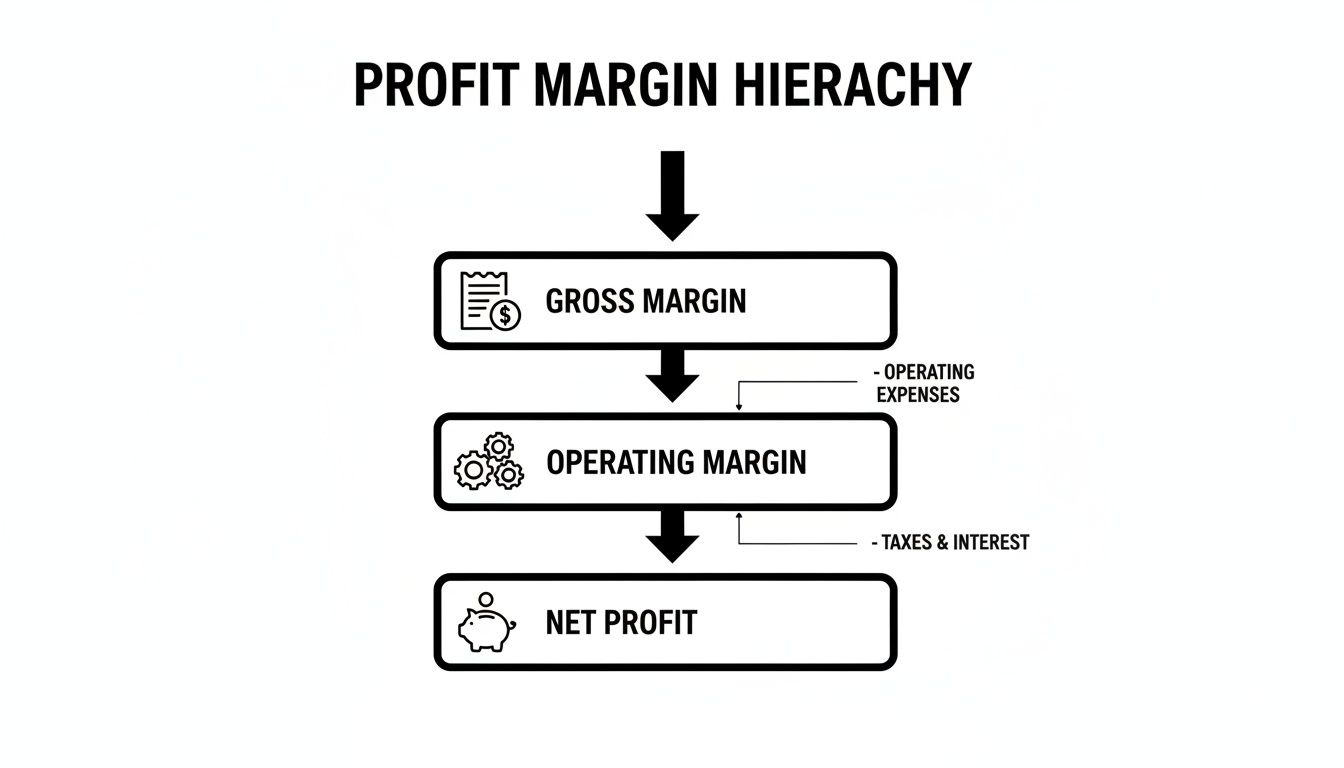
As you can see, the trip from Gross Margin to Net Profit is all about subtracting different layers of costs. Each step gives you a clearer picture of just how financially efficient your business truly is.
Your business model is probably the single biggest factor influencing your potential profit margin. Every approach has a completely different cost structure, which flows directly to the bottom line.
Here’s a rough idea of what to expect:
“Good” is always relative. A 7% net margin might be a huge win for a dropshipper in a saturated market, but it could signal major problems for a premium DTC brand. The trick is to stop comparing apples to oranges and start measuring yourself against the right peers.
Profitability doesn't just vary within e-commerce; it's all over the map across the entire economy.
Looking at global industries, you see some wild differences. Banks, for example, often post margins between 24.2% and 29.8%, thanks to their unique financial models. On the other end of the spectrum, you have capital-heavy sectors like steel producers scraping by with just 1.3%.
This context is key. It explains why a tech company with a 10% net margin is doing great compared to an automaker at 3.53%, but still trails financial services. You can learn more by checking out a full breakdown of profit margin by industry.
Ultimately, context is everything. Use these benchmarks as your starting point. If you’re falling short of the average for your specific business model and niche, it’s a clear signal that it’s time to roll up your sleeves and figure out where you can optimize.
Knowing your net profit margin is one thing. Actively improving it is how you build an e-commerce brand that lasts.
Boosting this all-important number isn't about one single, massive change. It's about making a series of smart, targeted adjustments across your entire operation. It’s about pulling the right levers, one by one, to make sure you're keeping more of every single dollar you earn.
Let's walk through five actionable strategies that are tailor-made for e-commerce brands. These aren't just high-level ideas; they're practical plays you can run to strengthen your bottom line and start building real, sustainable wealth.

If you're pricing your products based on "cost-plus," you're almost certainly leaving money on the table. Strategic pricing means anchoring your price to the perceived value you deliver to the customer, not just what it cost you to get the product.
Think about a premium skincare brand. They aren't just selling ingredients in a bottle; they’re selling clear skin, confidence, brand prestige, and a luxurious experience. Their price needs to reflect that whole package.
Your COGS is usually the biggest expense on your P&L, making it the most obvious place to hunt for savings. Even tiny percentage point reductions here can have an outsized impact on both your gross and net margins.
Start by auditing every single component that goes into your COGS. That means raw materials, manufacturing costs, every piece of packaging, and inbound shipping fees.
The most direct path to a healthier bottom line often starts with your suppliers. Don't be afraid to negotiate. Building strong, long-term relationships can open the door to better terms, volume discounts, and more favorable payment schedules.
Could you secure a 5% discount just by placing a larger order for your best-selling SKU? Can you find a new packaging supplier that offers the same quality for less? These small wins compound into significant savings over a year.
Operating expenses are all the costs of keeping the lights on—marketing spend, software subscriptions, salaries, and fulfillment fees. This is where "cost creep" loves to hide, as small monthly charges and inefficient ad campaigns slowly bleed your profits dry.
Start with a ruthless audit of your software stack. Are you paying for three different tools that basically do the same thing? You'd be amazed how many businesses have redundant subscriptions that can be cut or consolidated.
Next, get granular with your marketing spend. Stop looking at vanity metrics like traffic or impressions. Instead, obsess over Return on Ad Spend (ROAS) and Customer Acquisition Cost (CAC) for every single channel. Shift your budget away from campaigns that aren't pulling their weight and double down on the ones that are proven winners. And while you're focused on profit margin, remember that your overall financial health also depends on solid strategies for positive cash flow.
Getting a customer to your store is the expensive part. Convincing them to add one more item to their cart is much, much cheaper. Pushing up your Average Order Value (AOV) is a high-leverage way to boost both revenue and profit without spending a dime more on ads.
Here are a few tactics that just plain work:
Your business doesn’t operate in a bubble. Big-picture economic trends can have a massive influence on your costs and your customers' willingness to spend.
For context, U.S. firms have seen net margins grow significantly over the past few decades. The S&P 500 average recently hit 9.75%, a huge jump from the long-term average of 5.85% between 1989–2015. This was fueled by things like globalization (which lowered COGS), low interest rates, and tax cuts.
Keeping an eye on these larger forces helps you anticipate changes—like rising shipping costs or shifting consumer sentiment—and adapt your strategy before it's too late.
Calculating your net profit margin once is a decent start, but the real magic happens when you stop taking one-off snapshots and start tracking your financials consistently. The old saying, "what gets measured gets managed," couldn't be more true when it comes to the bottom line of your e-commerce business.
To make this happen, you need to graduate from messy, error-prone spreadsheets. Modern accounting software and specialized financial dashboards are absolute game-changers, automating all the tedious data collection and giving you a real-time pulse on your business’s health. This is how you spot trends, fix problems before they get out of hand, and make confident, data-driven decisions instead of just going with your gut.
Don't overcomplicate it. The goal of a dashboard is to bring your most important financial metrics into one place so you can see the whole story at a glance. Think of it as your company's mission control for profitability.
Your net profit margin is obviously the star of the show here, but it tells a much richer story when you view it alongside other key performance indicators (KPIs). For a complete picture, make sure you're pulling in:
When you track these metrics together, you start to see how everything connects. For example, if you run a successful campaign to increase your AOV, you should see a direct and positive impact on your net profit margin, assuming your costs stay put.
Get into a rhythm of reviewing your dashboard monthly. When you do this, financial analysis stops being a reactive chore and becomes a proactive strategy. You’ll start seeing patterns you would have otherwise missed—like a slow bleed in your margin or a sudden spike in acquisition costs—giving you a chance to act before small issues turn into big problems.
While you're zeroed in on your own numbers, it’s always smart to have a sense of the bigger picture. Looking at corporate profit margins across the entire U.S. economy gives you a high-level view of what's happening out there.
Recently, this metric hit 10.65%, which is an 11.72% jump year-over-year. For context, the historical median is closer to 6.51%. This kind of insight shows how massive forces like globalization and policy shifts can ripple down and influence profitability for everyone. You can find more details on these margin trends to stay informed.
Even after you've got the basics down, a few tricky questions about net profit margin always seem to pop up. Let's tackle some of the most common ones we hear from e-commerce owners who are serious about tracking their real profitability.
Absolutely. It’s one of the most common traps in e-commerce, especially in crowded niches with sky-high customer acquisition costs. A brand can easily pull in millions in sales but have next to nothing left after paying for inventory, freight, marketing, and everything else.
This is exactly why smart operators call revenue a “vanity metric.” It looks impressive on the surface, but your net profit margin tells the real story. It shows you what you actually keep from all that top-line sales volume.
For most e-commerce businesses, running the numbers monthly is the sweet spot. It's frequent enough to catch problems before they spiral out of control and see if your new strategies are actually working, but not so often that you get bogged down by tiny daily ups and downs.
On top of that, you’ll want to do a deeper dive every quarter and at the end of the year. These bigger-picture reviews are perfect for spotting long-term trends and making major strategic decisions for the business.
A negative net profit margin simply means you're in the red—your total expenses are higher than your total revenue. It's not a death sentence if it's a short-term, strategic move, but it's definitely not sustainable forever.
Yep, and it happens more often than you'd think. A negative net profit margin just means the business had a net loss for that period. Plain and simple, more money went out than came in.
This is almost expected for startups in their early days, when they're pouring cash into product development or aggressive marketing to grab market share. Even established brands can dip into the red if they face a sudden sales slump or get hit with unexpected costs.
At Million Dollar Sellers, we know that understanding your numbers is the first step to scaling your business. Our exclusive community brings together top e-commerce entrepreneurs who share the proven strategies needed to not just grow revenue, but to build a truly profitable brand. Join the waitlist to connect with the best in the business.
Join the Ecom Entrepreneur Community for Vetted 7-9 Figure Ecommerce Founders
Learn MoreYou may also like:
Learn more about our special events!
Check Events.svg)
.svg)
.svg)

.svg)