
Chilat Doina
August 4, 2026
79% of sales organizations miss their quarterly forecast by more than 10%, and spreadsheet-based forecasting carries an average gap of about 20%. For an e-commerce founder, that isn't a forecasting problem in the abstract, it's the difference between a clean sell-through and a warehouse full of the wrong SKU.
Sales forecasting is the process of estimating future sales revenue over a defined period using historical sales data, pipeline status, market trends, and deal probability, not wishful targets. In e-commerce, that same discipline has to do double duty, because a revenue forecast only matters if it can also steer inventory, replenishment, and cash.

A forecast can fail even when the software is fine. The break usually starts earlier, with inconsistent inputs, vague stage definitions, and a team that treats optimism like probability. That is why Anaplan's sales forecasting guide points to wide forecast error across common methods, with spreadsheet-based forecasts showing the largest gaps and AI-assisted forecasting performing better when the underlying data is clean.
For e-commerce founders, those misses show up in operational terms. A forecast that runs hot leads to overbuying, cash tied up in stock, and markdown pressure later. A forecast that runs cold creates stockouts, slows sales rank recovery, and makes paid traffic less efficient because demand arrives before supply does.
Practical rule: a forecast is valuable when it reduces the size of the bad surprise.
At the core, what is sales forecasting? It is the discipline of estimating future revenue from known inputs, then using that estimate to make better decisions before the quarter ends. The best versions use historical sales, current pipeline status, market movement, and deal probability together, so the result reflects what is likely to close rather than what the team hopes will close.
The point is operational control. Forecasting turns vague expectations into a working model of the business, and that model becomes the basis for inventory orders, hiring plans, and spend decisions. For e-commerce founders, the failure mode is usually a gap between revenue forecasting and demand planning, where the sales number looks neat on a dashboard but does not protect stock, margin, or working capital.
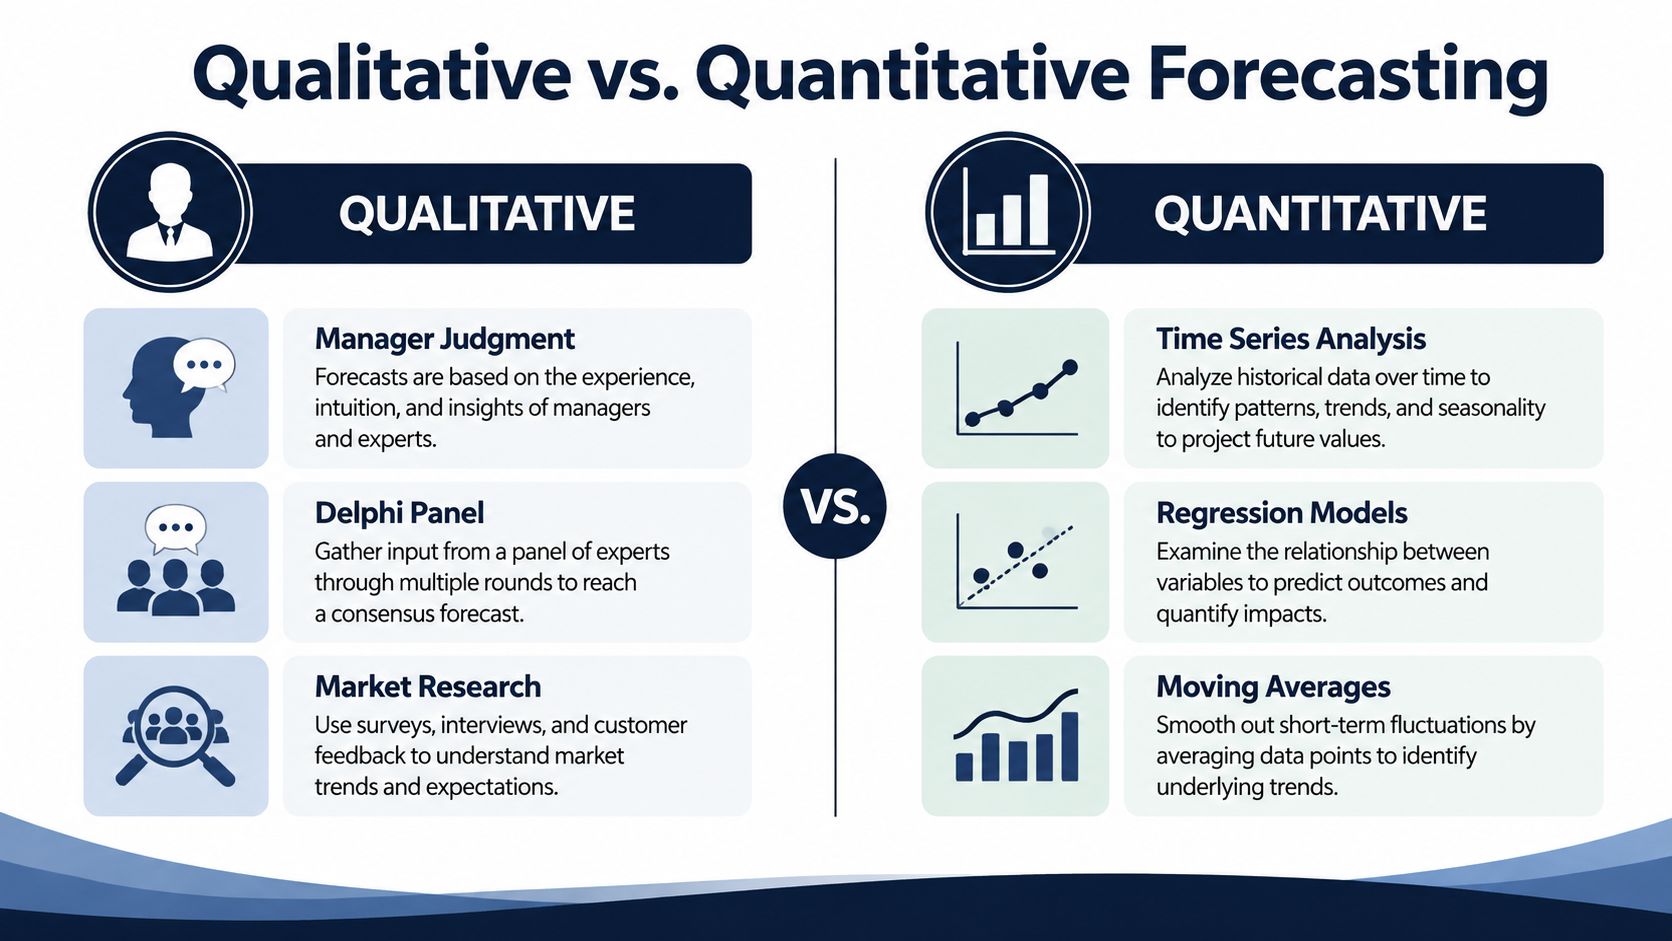
Qualitative forecasting still has a place, especially for early-stage brands with thin data. If you've only got a short operating history, a new product launch, or a major channel change, manager judgment, market research, and structured expert input can keep you from forcing fake precision onto bad data. The danger is not using judgment, it's pretending that judgment is more exact than it really is.
Quantitative methods work differently. They use historical patterns, stage conversion rates, and statistical relationships to estimate what should happen next. As described in Zendesk's sales analytics guide, regression analysis requires defining the dependent variable, selecting independent drivers, gathering data over a chosen period, and checking correlation before fitting the model. Time-series analysis is especially useful for mature products because it can detect long-term patterns and seasonality, while regression and other causal methods are better when you know specific variables are moving demand.
A useful way to think about method choice is by data maturity, not by ideology. A launch-stage brand usually needs qualitative judgment with light quantitative checks, while a business with stable repeatable sales can lean harder on time-series and driver-based models. If ad spend, channel mix, or pricing changes materially, the model has to be re-fit because those inputs change the demand curve.
A practical overview is worth keeping nearby, especially if you want a deeper catalog of options. The sales forecasting methods guide is a useful reference point when you're comparing simpler methods against more advanced approaches.
| Forecasting Method Selection by E-Commerce Maturity | Recommended Method | Accuracy Expectation | Data Requirement |
|---|---|---|---|
| Launch stage | Qualitative with light quantitative checks | Directional, not precise | Limited history, market feedback |
| Early scale | Hybrid, judgment plus simple historical patterns | Improving, but still sensitive to noise | Clean sales history and channel data |
| Growth stage | Time-series plus causal drivers | More stable and actionable | Sufficient history, repeatable seasonality |
| Mature multi-channel | Hybrid quantitative model | Highest consistency | Strong data hygiene across channels |
The split matters because e-commerce isn't just one sales motion. Amazon, DTC, and wholesale all behave differently, so the most useful forecast method is the one that matches the life cycle of the product and the quality of the data behind it.
Start with the time frame. Weekly forecasting works well when you're managing paid media, inventory receipts, and fast-moving SKUs. Monthly forecasting is better when lead times are longer and the business is less volatile. Quarterly views still matter for finance, but they're too coarse for deciding how many units to reorder next week.
The next step is data cleanup. Pull historical sales, strip out obvious duplicates, and standardize product names, SKU codes, and channel labels. If Amazon, Shopify, and wholesale orders are mixed together without clean tagging, the model will blend very different demand patterns into one misleading average. A forecast built on messy data doesn't fail loudly, it fails in a way that looks credible until the inventory arrives.
That process is easier to manage once the data layer is organized properly, which is why the architecture behind your numbers matters as much as the math. For a practical view of the underlying structure, see this guide to data warehouse architecture, especially if your sales, ads, and inventory data live in separate systems.
A product launch makes the logic clearer. Suppose a skincare brand is launching a serum and expects slow adoption in the first few weeks, then stronger repeat orders after the first reviews land. The founder can combine early adoption curves with planned media buys to build a monthly revenue forecast, then translate that into expected unit demand by channel.
After that, the model needs scenario planning. A conservative case protects cash, a baseline case guides normal replenishment, and an aggressive case tells you whether your supplier and warehouse can keep up if demand outperforms. That's the difference between a forecast that looks smart on paper and one that helps you buy inventory in time.
Lead-in to the video: a walkthrough of the build process can help when you're turning this into a working template.
A forecast that cannot be measured is just a guess with formatting. For e-commerce teams, the first two metrics to watch are Mean Absolute Error and Mean Absolute Percentage Error, because they show how far the forecast missed in absolute terms and in relative terms. Bias matters too, because it reveals whether the model keeps leaning high or low.
The practical benchmark is less about chasing perfect precision and more about avoiding fantasy math. AM World Group's sales forecasting statistics show that best-in-class forecast accuracy sits higher at the product family or category level than at the item level, and that data-driven forecasting is more common among stronger sales teams than intuition-led forecasting. That matters for operators who are translating revenue forecasts into purchase orders, because a model that looks clean in a deck can still create stockouts or excess inventory if it is not tied to real demand signals.
A good forecast review does not ask whether the number was pretty. It asks which assumption broke first.
| Forecast Accuracy Benchmarks for E-Commerce Teams | Top Quartile | Median | Underperformer |
|---|---|---|---|
| Product family accuracy | About 90% | Lower and less consistent | Materially below best-in-class |
| Item-level accuracy | About 85% | Lower and less consistent | Materially below best-in-class |
| Data-driven forecasting use | More likely to rely on data | Mixed method use | More likely to rely on intuition |
A monthly review cadence keeps the model honest. Compare actuals to forecast, calculate the error, identify the driver of the variance, and update the assumptions for the next cycle. If the miss came from a promotion you did not model, a stockout you did not flag, or a channel shift you ignored, write it down and change the inputs. That is how the forecast starts reflecting the business you run, instead of the one you hoped for.
For teams that need to see the underlying data flow clearly, this guide to data warehouse architecture is useful because it shows why forecast quality depends on how sales, ads, and inventory data are connected before the numbers ever reach a spreadsheet.
The goal is to surface error early enough that it changes the next decision.

The right tool depends on the maturity of the business, not on the brand of the software. Early-stage founders can often get by with spreadsheets if the catalog is small, the channel mix is simple, and the data is clean enough to trust. The problem comes when the business adds channels, SKUs, or promotional complexity faster than the forecast process can absorb.
Spreadsheets are flexible, but they become fragile as the business scales. CRM-integrated systems give you better pipeline visibility and more consistent stage tracking, which is a better fit once the forecasting process has more moving parts. AI-assisted tools add another layer by blending multiple data sources, but they only help if the underlying data is organized and reliable.
The consistent inputs are essential across tool tiers. You need sales history, CRM pipeline data where relevant, paid media spend, inventory levels, and returns data. If those signals are scattered across platforms and never reconciled, the forecast will always lag the business.
For teams comparing more advanced platforms, demand forecasting for distributors is a useful adjacent resource because it shows how operators think about tool selection when replenishment and channel demand both matter.
If your reporting lives in multiple systems, the data layer matters more than the dashboard. That's why a strong warehouse structure pays off before a fancy model does. For a deeper operational lens, review this overview of warehouse architecture and map your sales, ad, and inventory feeds before you add another forecasting layer.
A good rule is simple, if your team can't explain where each input came from, the forecast is too complex for the current stage. In e-commerce, simplicity with clean inputs usually beats sophistication built on weak data.
A forecast that stops at revenue misses the decisions that decide whether an e-commerce business stays liquid. Revenue does not pay suppliers, clear inbound freight, or reserve enough warehouse space for a stronger-than-expected month. Units on hand, cash committed to stock, and fulfillment capacity do.
The useful move is to turn the revenue view into unit demand and cash requirements. A strong top-line forecast can still create stockouts if it ignores lead times, minimum order quantities, or launch timing. It can also push the business into overbuying when a temporary promo spike is modeled as if it were baseline demand.
Practical rule: the forecast should guide procurement timing, not just show leadership what revenue might happen.
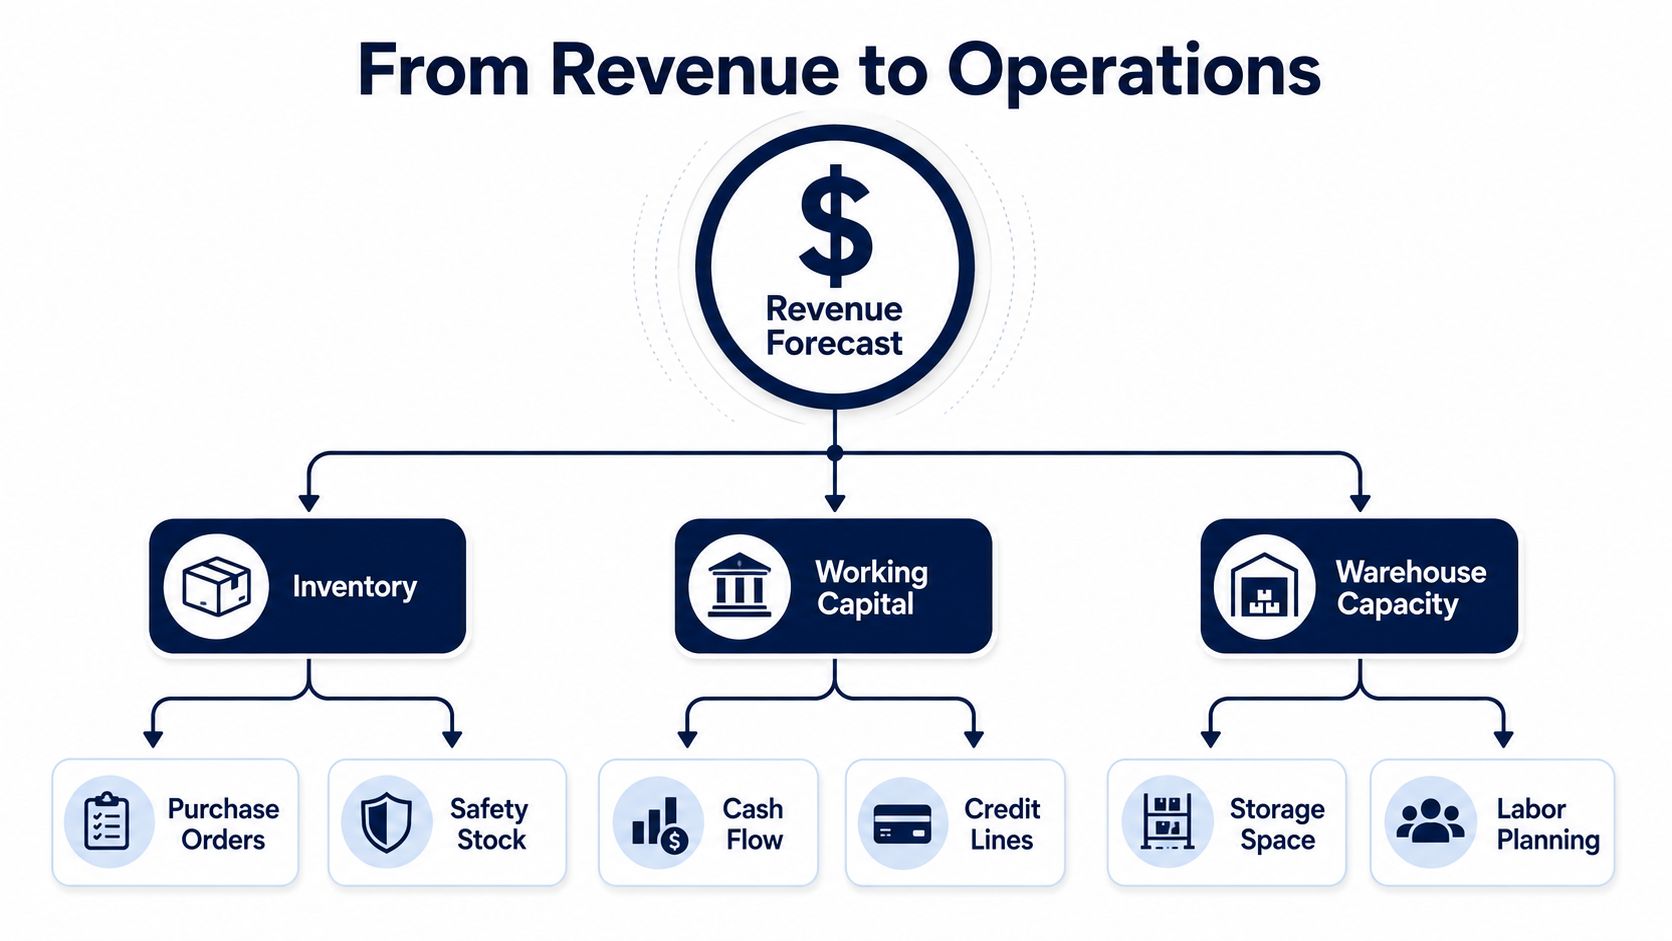
Scenario planning is the cleanest way to make that translation operational. Build conservative, baseline, and aggressive cases, then map each one to purchase orders, safety stock, cash needs, and warehouse capacity. That gives the team a set of operating choices instead of a single number that looks precise and fails under pressure.
For founders who want the forecast tied directly to liquidity, AgentCentral's cash flow forecasting resource is a useful companion because demand planning and cash planning need to move together.
| Revenue Forecast Output | Inventory Impact | Working Capital Impact | Warehouse Impact |
|---|---|---|---|
| Conservative case | Lower order volume, smaller safety stock | Lower cash demand | Easier storage and labor planning |
| Baseline case | Standard replenishment plan | Expected operating cash use | Normal space and staffing plan |
| Aggressive case | Higher purchase orders, more buffer stock | More cash tied up | More storage and fulfillment capacity |
The translation step is where e-commerce forecasting starts to affect operating performance. If the revenue number rises but the unit plan does not, the forecast is too abstract to drive replenishment. If the unit plan rises but cash does not, the business can hit a working-capital trap even while sales look healthy.
A practical way to reduce that risk is to connect the revenue plan to inventory math and cash timing. For inventory-heavy teams, this inventory forecasting guide helps pressure-test what happens when a forecasted spike meets a supplier delay. For cash-constrained teams, working capital optimization shows how purchasing decisions affect the room you have to fund growth.
The first mistake is confirmation bias. Founders often want the forecast to validate the quarter they already planned, so they overweight rosy deals and underweight the ones with real risk. The second mistake is treating one forecast as destiny, which ignores how quickly promotions, channel mix, and inventory problems can change the outcome.
Lead-time variability is another quiet killer. If your supplier is inconsistent and your model assumes smooth replenishment, the forecast can look accurate while the business still misses demand. Overfitting is the more technical version of the same problem, because a model that hugs recent history too tightly often falls apart when the next promo calendar looks different from the last one.
AI can help, but it isn't a magic fix. The verified data shows AI-assisted forecasting can narrow the average gap to about 5% to 6%, compared with 12% to 15% for CRM-based forecasting and 20% for spreadsheet-based forecasting, as reported in Anaplan's 2026 guide. That improvement is real, but only when the data is clean enough and the demand pattern is stable enough for the model to learn from.
A second data point reinforces the same lesson. In the sales-operations statistics set, 93% of sales leaders were said to be unable to forecast revenue within 5% with two weeks left in the quarter, and 80% of sales organizations reportedly didn't achieve forecast accuracy above 75%, from AM World Group's statistics. Those numbers tell you the upgrade path is not about chasing perfection, it's about building a process that learns.
For e-commerce operators, the practical upgrade path is straightforward. Move from spreadsheets to CRM-based forecasting once the business gets complex enough that stage visibility matters. Consider AI-assisted tools once you've got enough clean multi-channel history, stable enough patterns, and enough promotional complexity that manual judgment can't keep up.
The test is simple. If the forecast is influencing inventory, staffing, and cash, it needs to be defensible. If it can't be explained by someone who owns the data, it's too fragile to run the business on.
If you're building forecasts that have to hold up in Amazon, DTC, and wholesale at the same time, join the operators who compare notes with people dealing with the same problems every week. Million Dollar Sellers gives serious e-commerce founders a private place to pressure-test forecasting, inventory, and cash decisions against peers who've already fixed these mistakes.
Join the Ecom Entrepreneur Community for Vetted 7-9 Figure Ecommerce Founders
Learn MoreYou may also like:
Learn more about our special events!
Check Events