Chilat Doina
November 4, 2026
The most popular Amazon growth strategy advice is wrong. Grow revenue first, fix profit later, chase rank, and the money will sort itself out. It won't. At seven and eight figures, volume bought with weak listings, undisciplined ads, and bloated inventory destroys cash faster than it builds a business. Judge every lever by one test, contribution profit per incremental dollar of sales. If a lever can't pass that test, don't scale it, no matter what your revenue chart says.
| Revenue stage | Dominant lever | Main constraint | First move |
|---|---|---|---|
| About $1M to $5M | Listing quality and organic rank | Thin reviews and weak conversion | Fix main images and bullets on the top 20 ASINs |
| About $5M to $10M | Non-branded advertising | Ad cost rising faster than contribution | Split campaigns by funnel role |
| About $10M to $50M | Assortment and fulfillment depth | SKU sprawl and stockouts | Cut negative SKUs, protect hero ASIN availability |
| About $50M+ | Portfolio and market expansion | Complexity hides margin leaks | Review contribution by SKU, channel, and marketplace weekly |
Amazon doesn't need to own your inventory to profit from your growth. The Amazon annual report filed with the SEC shows third-party seller services generated $16.1 billion in 2015, rising to $140.1 billion in 2023. Those services are primarily commissions, fulfillment and shipping fees, and related seller programs. Amazon therefore gains when you sell more, advertise more, and use more logistics at the same time. You gain only when those three compound in your favor.
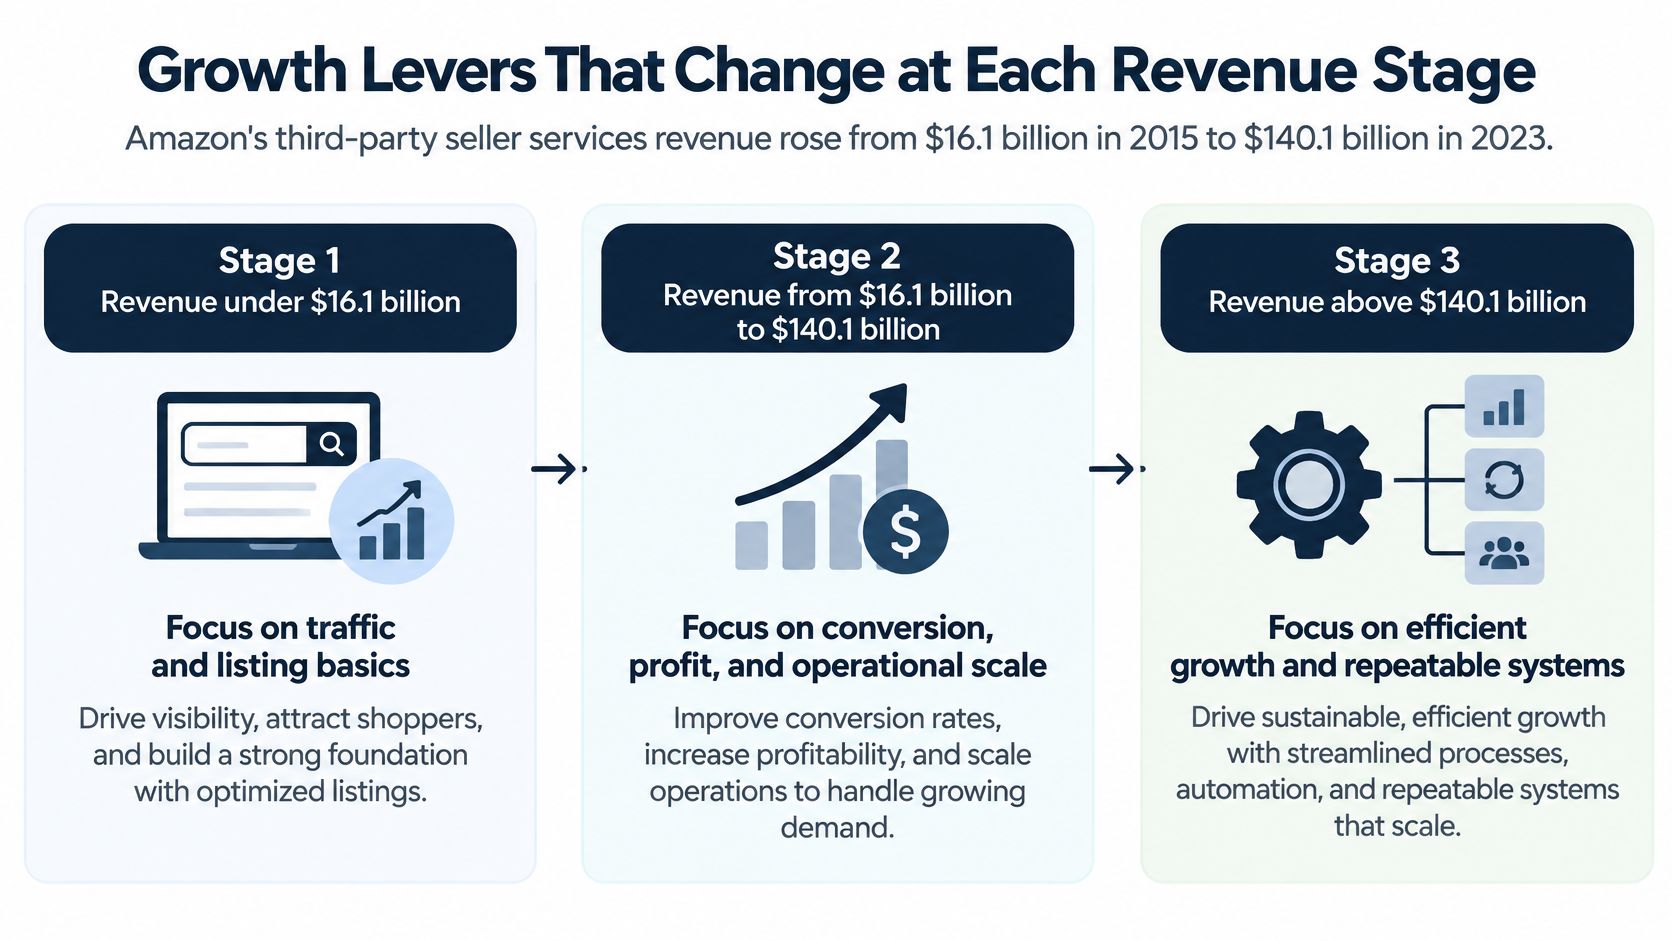
At $1M to $5M, your ceiling is usually conversion. A stronger main image and clearer proof in the bullets lift every click you already get. If you need assets fast, create product videos for Amazon to test video on hero ASINs before you buy more traffic.
At $5M to $10M, non-branded demand becomes the constraint. You have proof the product sells, but category terms get expensive and blended targets hide waste. At $10M+, the problem flips to control. Assortment, placement, and team ownership decide whether added revenue turns into cash or aged stock.
Decision rule: Use trailing twelve-month revenue to find your row, then pick one lever for the next quarter. Don't run all three at full intensity and call the confusion strategy.
Test which lever binds you. Change one variable, watch its metric for two to four weeks, and keep the lever that moves contribution profit, not just sessions or rank.
Revenue growth doesn't prove your Amazon growth strategy works. It can conceal deteriorating economics while shipping, product cost, and advertising eat the margin underneath it. The Jungle Scout Amazon Seller Report 2025 surveyed nearly 1,500 sellers and found 38% of enterprise brands identified higher shipping costs as a major challenge, 34% cited rising cost of goods, and 32% cited increasing advertising expenses. Nearly 40% of enterprise brands were concerned about profitability. That's the tension. You're not short of ways to spend. You're short of proof that spend pays.
| Metric | What It Counts | Use It For | Limit |
|---|---|---|---|
| ACOS | Ad spend divided by ad-attributed sales | Bid and keyword decisions | Ignores organic sales the ads help create |
| TACoS | Total ad spend divided by total sales | Blended health of advertising | Hides wasted spend inside strong campaigns |
| Break-even ACOS | Gross margin after Amazon fees, per SKU | Ceiling for bids | Needs accurate landed cost and fee data |
| Contribution margin | Profit after fees, ads, returns, freight, duties and cash cost | Go or no-go on scaling | Requires SKU-level costing every month |
Start with contribution profit at SKU level. Take selling price, subtract landed product cost, referral and FBA fees, freight, duties, returns allowance, coupons, storage, and ad spend, then account for the cash tied up in inventory. If you need a refresher on the math, our guide to what contribution margin means for operators breaks down the components.
Accessory and jewelry sellers often work through the same landed-cost problem from a retail angle, and these margin calculation examples for accessory retailers show how small cost omissions change the answer. Apply that discipline to Amazon fees. A missed inbound charge or return cost turns a supposed winner into a loss.
Say a SKU sells for $40. It has a $14 landed cost and $9 in Amazon fees. That leaves $17 before advertising, so break-even ACOS is 42.5%. Spend above that level on a mature campaign and you're buying sales at a loss, unless you can prove a separate benefit such as rank lift that later converts into profitable organic volume.
That proof is where incremental TACoS matters. Don't judge a new campaign by blended TACoS across the whole account, because strong branded terms can subsidize weak discovery spend for months. Isolate the campaign or keyword cohort, compare total sales and total ad spend against a baseline or holdout period, and calculate the profit on the sales that moved.
Cut or reprice any SKU with negative contribution after ads. Decide in advance how much revenue you'll give up, in dollars, to protect cash.
Build this in a tool you trust, whether that's Sellerboard, a BI dashboard, or a disciplined spreadsheet fed by Settlement Reports and Ads Console exports. Refresh costs monthly. Freight and fees change, and a stale cost file gives you confident numbers that are wrong.
Decide which SKUs deserve effort before you spend another dollar promoting them. A long catalog feels like diversification. In practice, it often spreads reviews, inventory cash, and operator attention across products that never clear their cost of traffic.
Pull your top 50 SKUs by revenue for the last 90 days. For each one, calculate contribution profit per unit and contribution profit per dollar of inventory. A SKU can look fine per unit and still be a poor use of cash if it turns slowly and sits in FBA for months.
Then sort every SKU into four groups:
Our framework for pruning a catalog without hurting revenue quality gives you a practical way to run that sort with your team. Use break-even ACOS as the ceiling during the review. If a SKU needs heroic ad efficiency just to break even, it doesn't belong in the scale group.
The contrast is usually stark. Say one SKU leaves $6 after fees and ads but turns slowly and needs constant coupons. That's a cut candidate, even if it produces revenue every week. A $40 SKU with $17 left before ads and fast turns is a scale candidate, because it can fund discovery traffic and still leave profit.
Add variations under an existing parent only when that parent already sells. The new child reuses reviews, rank history, and listing traffic instead of starting cold. Don't use variations to rescue a weak parent. You'll just multiply the number of weak options a shopper has to ignore.
For genuinely new products, set a time-boxed launch budget with a fixed end date and a clear contribution gate. Promote the product into your core catalog only after it meets the same standard as established SKUs. Keep the active catalog small enough that listing work, ad management, and forecasting concentrate on the products that pay for everyone else's experiments.
Advertising amplifies whatever conversion rate your listing already has. Send expensive clicks to a weak page and you don't fix growth, you subsidize Amazon's ad auction. Fix conversion first, then scale.
Here's the sprint we recommend for your highest-value listings.

Teams that want a structured audit path can compare their process against these listing strategies for marketplace teams, then adapt the checklist to their category. The point isn't more content. It's removing the specific friction that stops a qualified shopper from buying.
Watch this walkthrough before your next experiment so your team logs hypotheses and results the same way every time.
Use tools like Helium 10 or Data Dive for keyword context, but let your own Brand Analytics, Search Query Performance, and experiment results make the final call. Record every test, the dates it ran, and the decision you took. Without that log, teams repeat losing tests and forget why a winning image won.
If a listing converts below its category average, don't scale advertising on that ASIN. Close the conversion gap first.
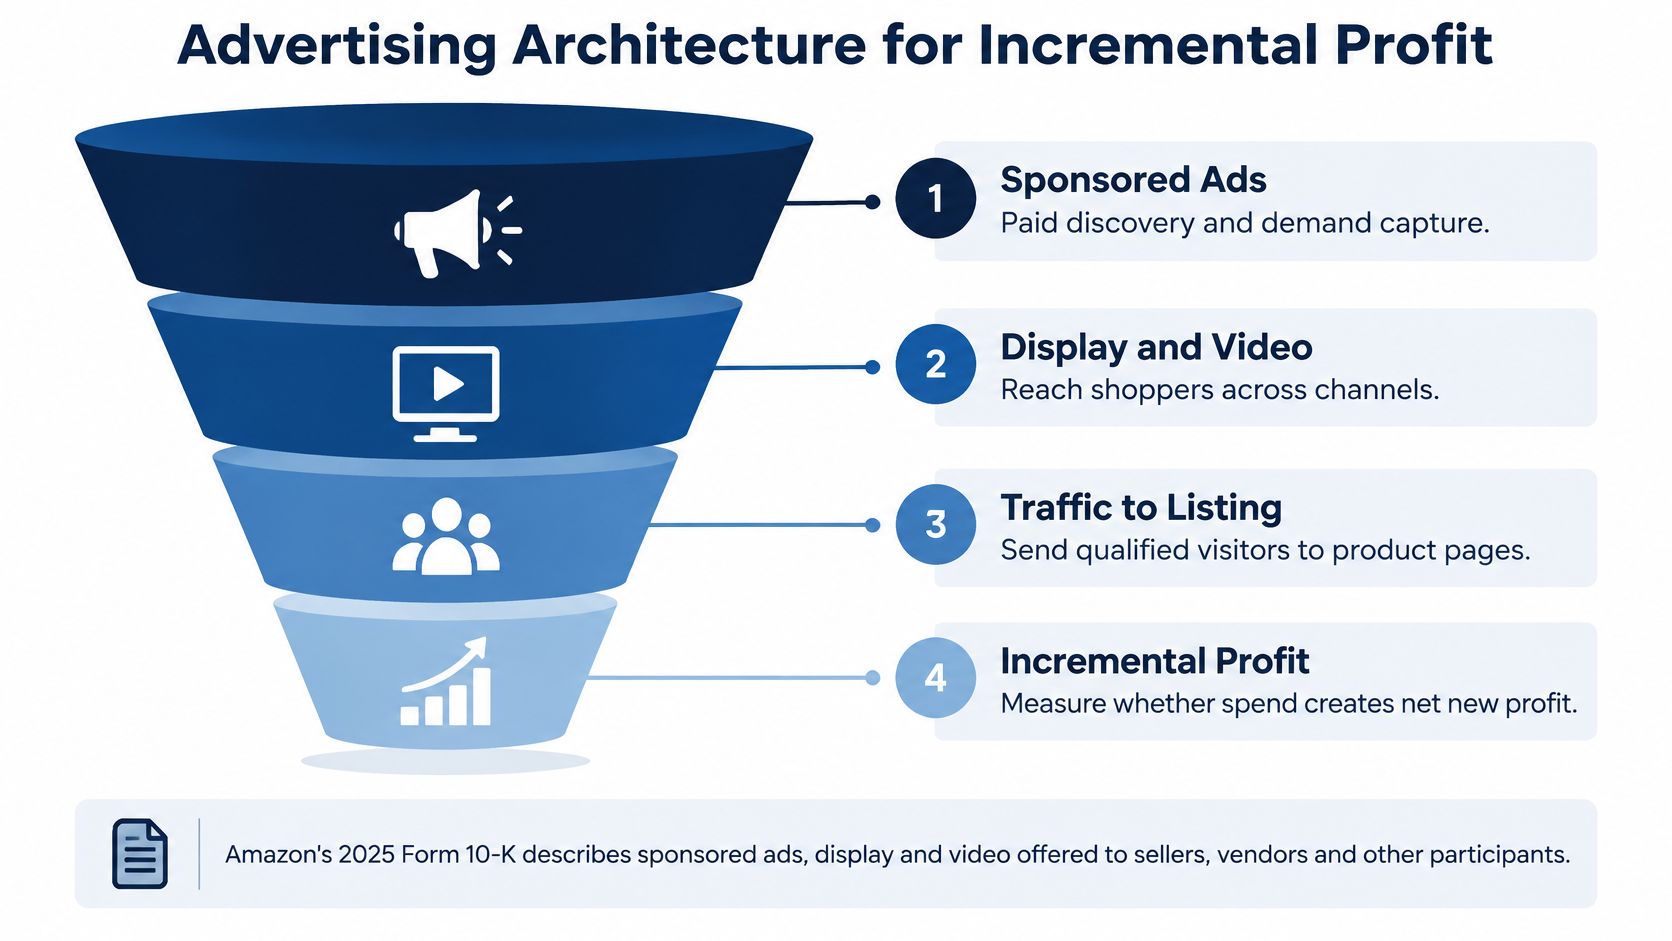
Paid traffic isn't a single ACOS target. It's a portfolio of jobs, and each job needs its own metric and budget rule. Amazon's 2025 Form 10-K describes advertising services offered to sellers, vendors, publishers, authors, and other participants through sponsored ads, display, and video formats. Visibility is now a core monetization layer for Amazon. For you, that means disciplined structure matters more, not less.
| Campaign role | Job in the funnel | Judge it by | Budget rule |
|---|---|---|---|
| Branded defense | Protects brand searches from competitors | New-to-brand share and cost per branded click | Fund enough to hold top placement on your own name |
| Non-branded discovery | Wins category searches | Incremental contribution profit | Scale only above break-even ACOS |
| Competitor conquest | Takes share from rival listings | Conversion rate and contribution profit | Test on small keyword cohorts first |
| Product-launch testing | Builds early rank and reviews | Rank lift and early conversion | Time-boxed budget with a fixed end date |
Branded defense is insurance. You're paying to stop a competitor from intercepting shoppers who already searched for you, so don't judge it as if it created all that demand. Watch cost per branded click and whether you're holding placement efficiently.
Non-branded discovery is where growth is won or wasted. Judge it by incremental contribution profit, new-to-brand share, conversion rate, and organic-rank lift, not blended ROAS. A campaign can show acceptable ROAS while cannibalizing organic sales you'd have won anyway.
Conquesting needs restraint. Product targeting against a rival only works when your rating, price, image, and delivery promise give the shopper a reason to switch. Launch testing is different again. You're buying data and early velocity, so set the budget and end date before you start, then decide with fresh eyes.
The flywheel is real when it works. Stronger traffic and conversion raise sales velocity, velocity improves discoverability, and better organic placement reduces the paid share a mature keyword needs. But don't assume it. Run controlled budget reallocations by keyword cohort and marketplace, with holdout periods where feasible.
Move budget in deliberate steps. Increase a cohort, hold others steady, and compare total contribution profit, not just ad-attributed sales. Reinvest only where incremental gross profit exceeds marginal advertising and inventory cost. If extra spend forces an air-freight replenishment, that freight belongs in the campaign's economics.
Add Amazon DSP later, after search campaigns are near break-even or better and your audiences are defined from actual purchase data. DSP won't fix weak search economics. It will scale whatever audience quality and margin structure you already have.
Spend should enter at the top through discovery, earn its way down through conversion and rank, and stop where incremental profit turns negative. That's the funnel view. Every campaign either proves it belongs or loses budget to one that can.
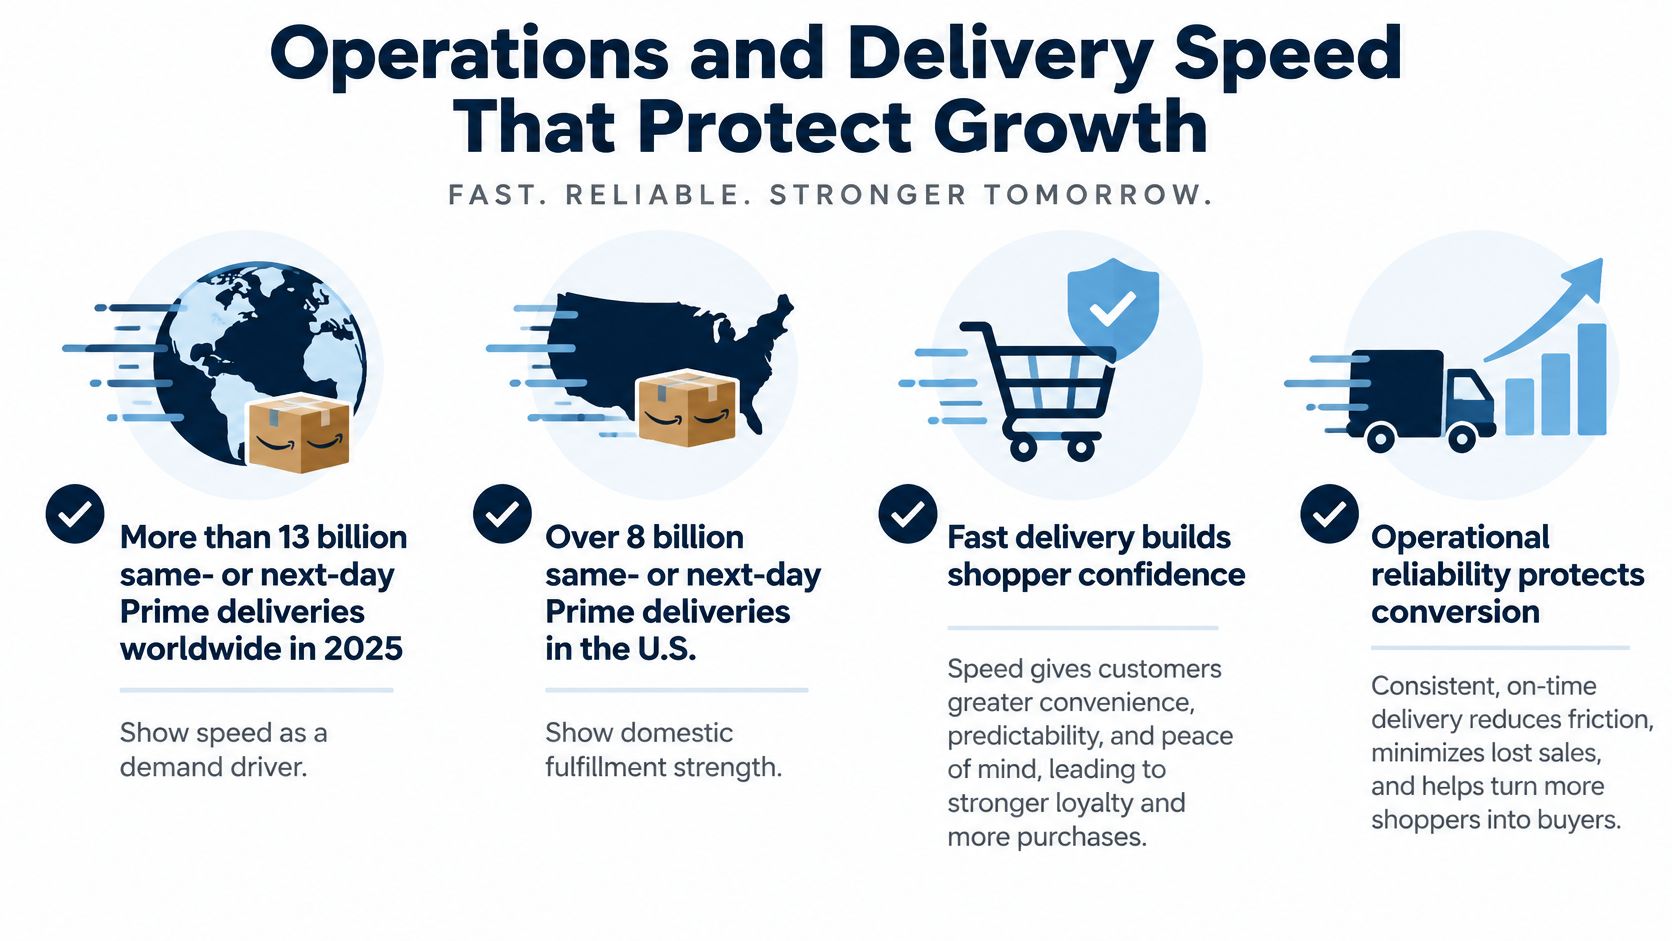
Delivery speed is now a demand tool, not a back-office detail. Amazon's 2025 Prime delivery announcement reports more than 13 billion same- or next-day Prime deliveries worldwide in 2025. In the United States, Prime members received over 8 billion such items, more than 30% above the prior year, with groceries and everyday essentials representing approximately half of the U.S. total. When speed becomes the habit, your inventory placement shapes conversion, repeat purchase, and the size of the market you can serve.
Build a weekly operations checklist with named owners:
Follow the placement rule. Hold the right weeks of supply at the right fulfillment nodes, not more inventory everywhere. Excess stock creates aged-inventory and storage exposure that wipes out a good advertising month. Use a forecasting tool such as SoStocked or InventoryLab, but keep a human check on lead times, inbound delays, and upcoming promotions.
Watch order defect rate, late shipment rate, valid tracking rate, and cancellation rate every week. A single bad month can cost Buy Box eligibility, and that loss hits every SKU at once. No campaign structure compensates for a suppressed listing or a fulfillment problem you ignored.
Name one owner each for advertising, listings, inventory, and account health. Hold a weekly SKU-level contribution review across all four so nobody optimizes their metric by damaging someone else's. Before you spend more on top-of-funnel traffic, test whether faster delivery lifts conversion or reorder rate on replenishable products. If it does, FBA availability may return more profit than the next tranche of clicks.
Don't start with a country list. Start with a gate. Expand only when your home marketplace produces repeatable contribution profit, because a new marketplace adds translation, tax, returns, and inventory complexity to whatever economics you already have.
Amazon's scale shows why the prize is tempting. The Amazon annual report filed with the SEC reports consolidated net sales of approximately $638.0 billion in 2024, with international operations contributing $142.9 billion. That infrastructure helps you reach buyers. It doesn't make your unit economics travel.
First, prove contribution profit at home by SKU. If a product only works with heavy coupons in your main market, it won't work better after freight, duties, and translation.
Second, choose the next marketplace from demand signals. Look at Brand Analytics search volume where available, existing cross-border sales, competitor presence, and the cost of localizing listings properly. Our guide on how to sell internationally on Amazon walks through the marketplace selection process in detail.
Third, localize the offer, not just the language. Titles, images, sizing, claims, pricing, and returns expectations all need local review. A literal translation of a high-converting listing can still convert poorly if the proof points don't match how shoppers in that market buy.
Fourth, check the money mechanics before the first shipment. Confirm VAT obligations, currency exposure, inbound lead times, and who owns returns. Price with those costs included from day one.
Launch one marketplace with 20 proven SKUs, not your full catalog. Say your home market has 80 active SKUs but only 25 clear the contribution gate comfortably. Take the strongest 20, localize them well, and judge the market on the same profit metrics you use at home. Expand further only when that first marketplace covers its own advertising and fulfillment costs. International revenue that needs constant subsidy from home isn't expansion. It's leakage with a flag on it.
You don't need more initiatives. You need a sequence that forces profit proof before scale. Run these four phases in order and don't skip ahead because a competitor launched something noisy.
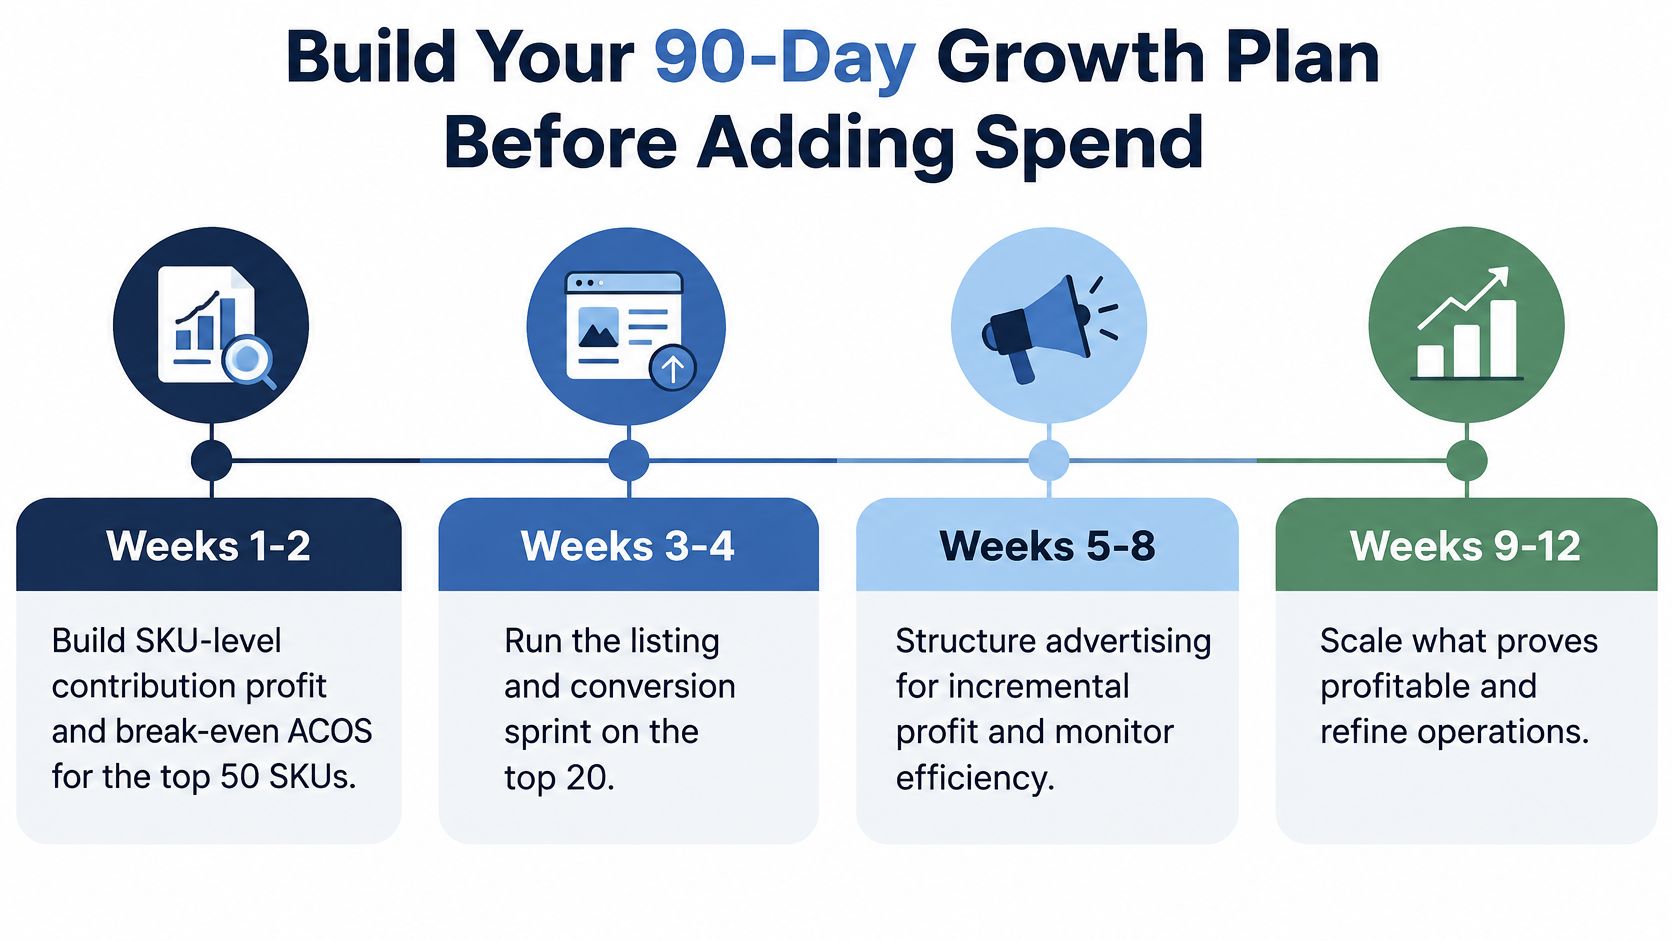
In Weeks 1 to 2, build SKU-level contribution profit and break-even ACOS for your top 50 SKUs. Assign one owner, lock your cost sources, and flag every SKU that's negative after ads. This is unglamorous work, and it's the work that makes every later decision faster.
In Weeks 3 to 4, run the listing and conversion sprint on your top 20 ASINs. Launch your first Manage Your Experiments tests, fix obvious image and bullet gaps, and log every hypothesis. Don't increase budgets on listings you're actively trying to repair.
In Weeks 5 to 8, restructure advertising into branded defense, non-branded discovery, conquesting, and launch testing. Set holdouts where you can, reallocate budget by keyword cohort, and move money toward cohorts that add incremental contribution profit. Kill campaigns that only look good inside blended reporting.
In Weeks 9 to 12, review fulfillment placement, in-stock performance, and account health. Then decide whether a new variation, product, or marketplace has earned a test. Operators doing at least $1M in trailing twelve-month Amazon revenue as a founder or substantial equity holder will recognize this pressure. Unlike general founder organizations such as YPO or EO, MDS focuses entirely on ecommerce operators, so these are the operating tradeoffs members compare directly.
At day 90, apply one gate. Scale only SKUs and campaigns with positive contribution profit. Cut or reprice the rest. Write down this week the lever you'll change first, the metric that will prove it worked, and the date you'll check it. A growth plan without a check date is just a wish with better formatting.
If you're building your Amazon growth strategy around profit instead of vanity revenue, compare your 90-day decisions with founders who run the same SKU, advertising, and inventory reviews every week. Million Dollar Sellers brings together vetted ecommerce operators to share what's working, what they'd cut, and how they'd allocate the next dollar. Visit us to see whether you qualify and start making growth decisions with sharper peer input.
Join the Ecommerce Community for Founders Scaling from 7 to 9 Figures
Learn MoreYou may also like:
Learn more about our events!
Check Events