
Chilat Doina
August 18, 2026
You've probably got a catalog that grew one launch at a time. A new color solved a merchandising request, a bundle created a campaign angle, and a marketplace variation seemed harmless. Months later, the warehouse is full of slow movers, buyers can't forecast cleanly, and finance is asking why cash is trapped in products that rarely sell.
That's the point where SKU rationalization becomes more than a catalog cleanup. The right process protects profitable demand, removes avoidable complexity, and identifies products that look weak in isolation but still matter because they drive traffic, complete bundles, satisfy channel requirements, or keep customers from switching brands. The wrong process deletes the bottom of a report and discovers the cost after the replacement demand fails to appear.
Excess assortment carries a cost before a unit is sold. Industry guidance commonly estimates inventory carrying costs at 20% to 30% of product value per year, including the financial burden of holding stock, as outlined in this guide to SKU rationalization and portfolio optimization. That burden affects storage, handling, insurance, markdown exposure, obsolescence, and the cash your team can't deploy elsewhere.
The long tail creates a second problem. A slow-moving SKU still needs a product page, images, replenishment logic, forecasting attention, warehouse locations, customer-service knowledge, and often a separate purchasing or packaging workflow. Those tasks may look small individually, but they multiply across a broad catalog.
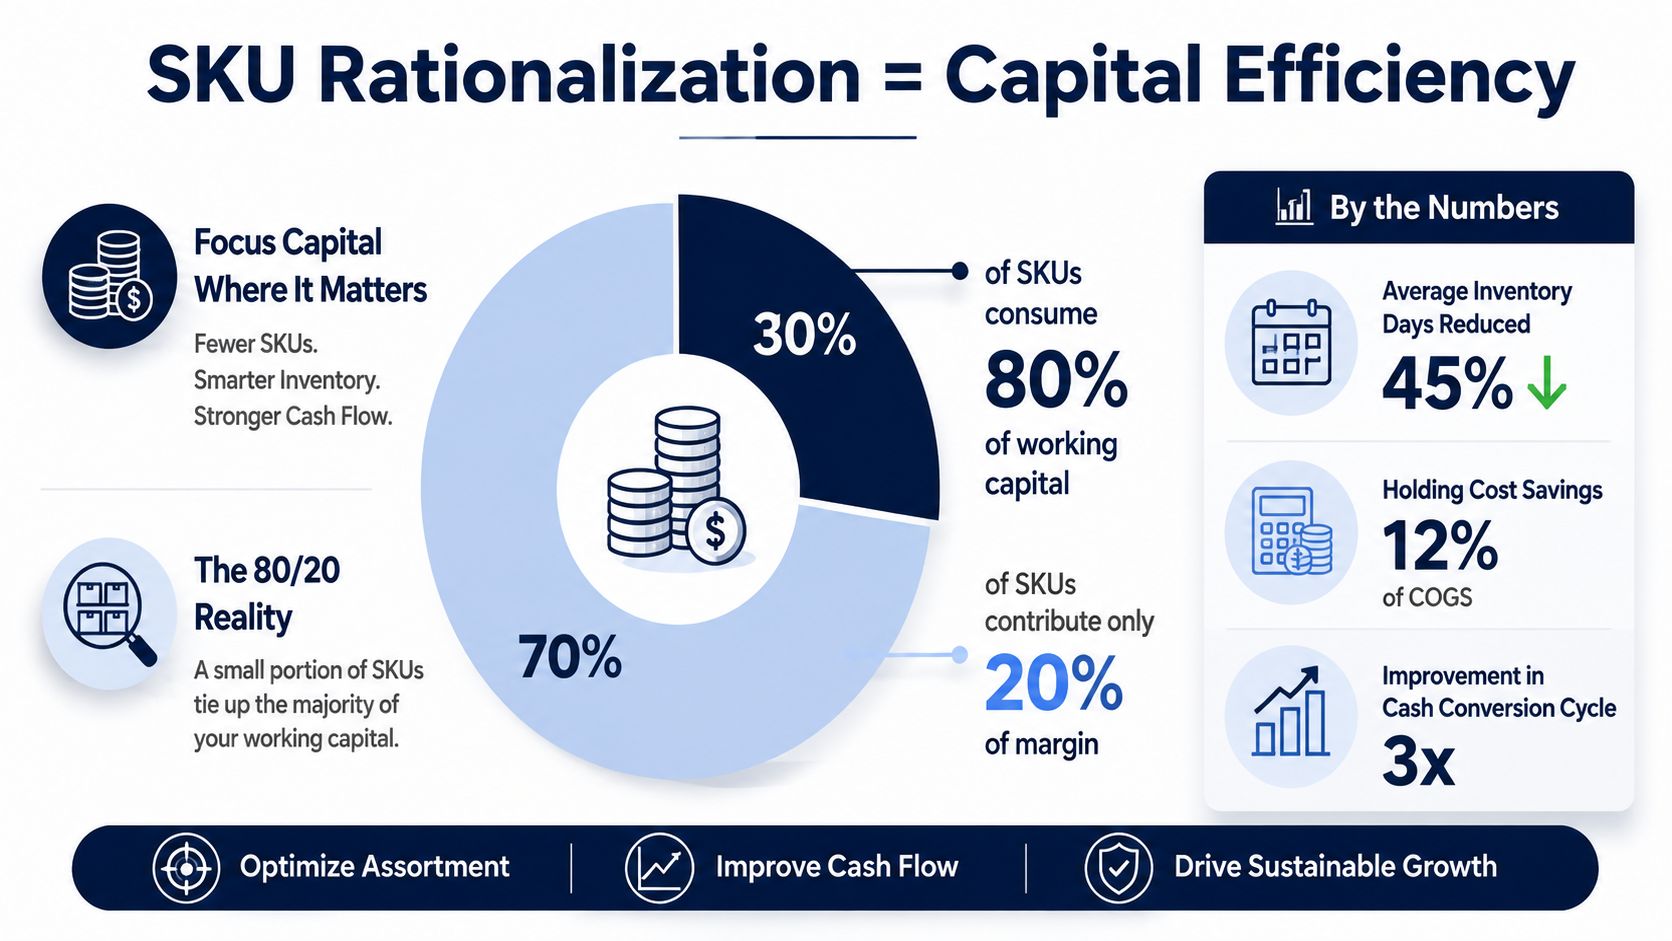
The familiar starting point is ABC analysis. It applies the Pareto principle to inventory, using the framing that roughly 20% of SKUs can account for about 80% of total sales, as described in inventory guidance on SKU rationalization. The precise distribution will vary by business, but the management lesson is consistent. A small group of high-value A items usually deserves different purchasing, availability, and service decisions from the middle-tier B items and the long-tail C items.
That distinction matters because cash tied up in C items can compete directly with inventory for products that sell faster. Rationalization releases that cash when the company consolidates variants, exits dead stock, improves purchasing discipline, or redirects warehouse capacity toward productive items. Published guidance reports 15% to 30% inventory cost reductions and 15% to 40% improvements in working capital availability when rationalization removes dead stock, though those outcomes depend on implementation quality and the structure of the assortment. The same source describes a scenario in which eliminating 100 underperforming SKUs could reduce annual carrying costs by $200,000.
Practical rule: Treat every SKU as a user of cash, labor, space, and attention. Keep it because it earns that right or because it performs a clearly documented strategic job.
SKU rationalization isn't automatically a volume reduction exercise. It's a portfolio decision. A product with modest revenue may deserve to stay if it has strong contribution margin, reliable replenishment behavior, or a role in a profitable bundle. Conversely, a product with respectable sales may need intervention if returns, storage, packaging, discounting, or support costs consume its apparent contribution.
That's why the best operators connect assortment decisions to broader efforts to trim overheads and boost profitability. They also separate inventory carrying cost from purchase cost and gross margin. A useful primer on the subject is this explanation of inventory carrying costs, which helps finance and operations use the same language.
The commercial objective is simple: reallocate scarce working capital toward products that support profitable growth. Rationalization works when it improves the quality of inventory, not merely when it lowers the SKU count.
The first spreadsheet pull is rarely sufficient. Sales data tells you what moved, but it doesn't tell you why a product moved, what it enabled, or where demand goes when it disappears. Before making cuts, build one master dataset that joins demand, supply, financial, customer, and channel information at the SKU level.
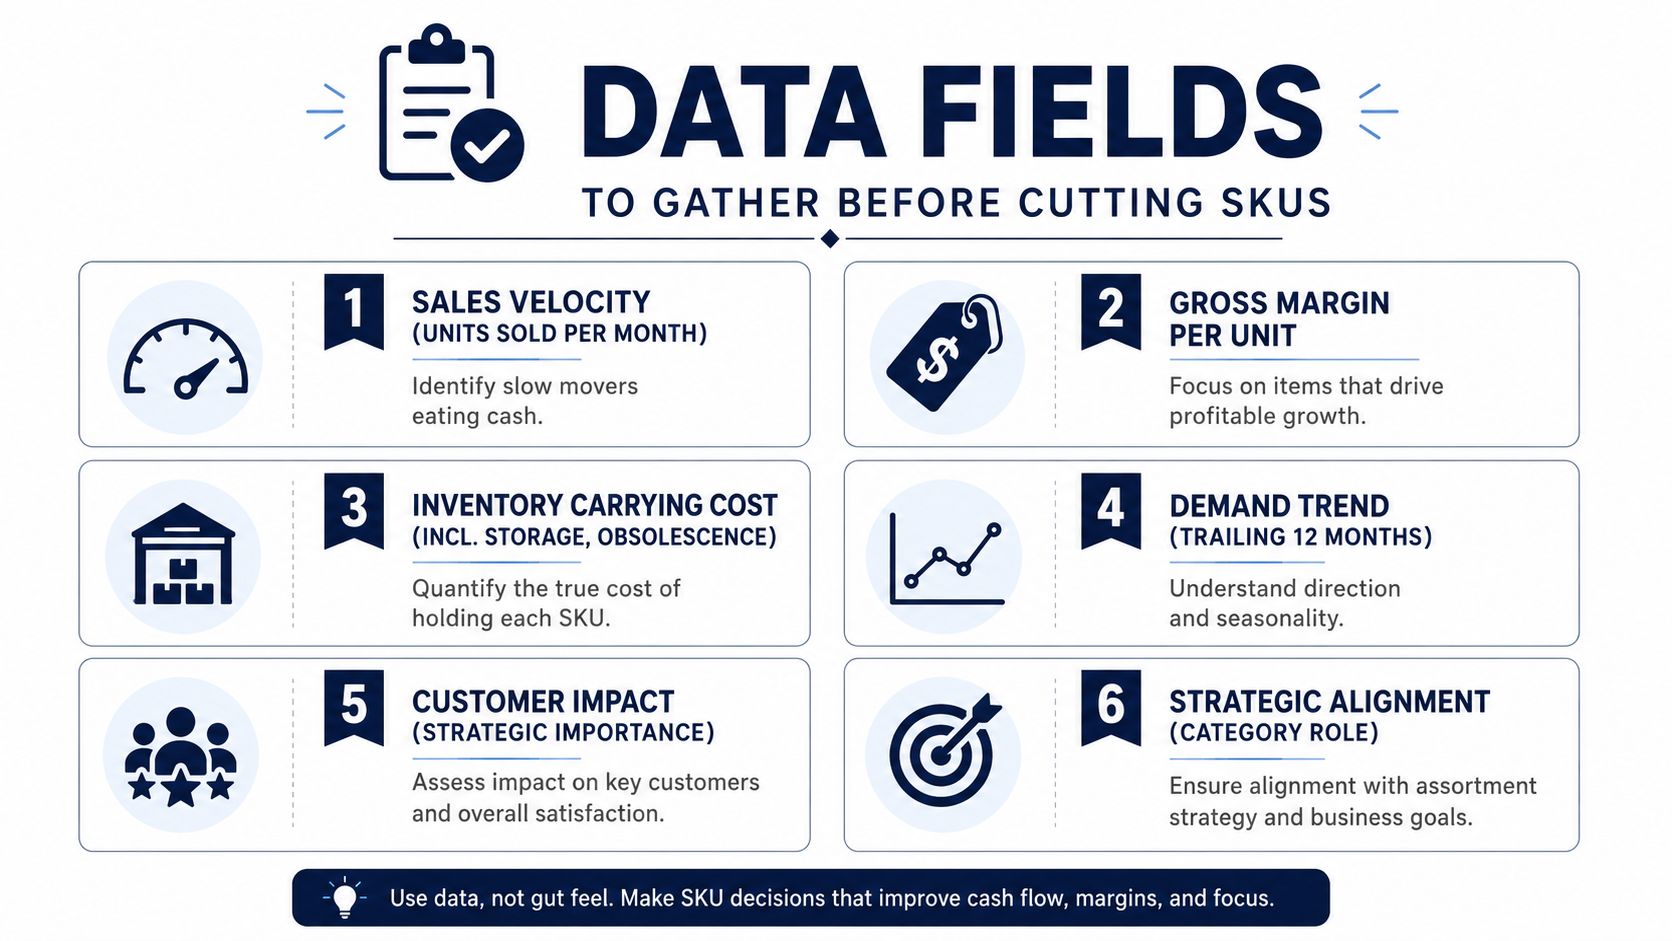
At minimum, each row should contain:
An Amazon FBA catalog needs marketplace fees, fulfillment charges, storage exposure, stranded-inventory risk, review continuity, and variation relationships. A DTC brand should add landing-page sessions, conversion paths, bundles, email clicks, subscription behavior, and customer acquisition cost by product where attribution is credible.
Wholesale and retail require another layer. Capture retailer minimums, planogram or assortment commitments, case-pack constraints, lead times, chargebacks, and the consequences of losing a listing. A product that looks unproductive on a DTC contribution report may protect a wider account relationship.
Run basic checks before scoring anything. Reconcile order data with inventory movements, identify stockout periods, remove canceled orders, map old and new SKU codes, and confirm whether bundles are counted as separate products or allocated to their components. Document every assumption in the workbook.
A practical dataset usually needs four tabs:
Without this structure, teams tend to debate isolated metrics. With it, they can see the economic and strategic role of each SKU.
No single ranking method is reliable enough for a major assortment decision. ABC analysis is a useful first pass because it identifies high-value, middle-tier, and long-tail items, but it can't distinguish stable demand from volatile demand or profitable products from expensive ones.
The following comparison shows where each framework earns its place.
| Framework | Best For | Key Metrics | Limitations |
|---|---|---|---|
| ABC and XYZ analysis | Separating value from demand predictability | Revenue or contribution class, demand variability, forecast behavior | Can undervalue strategic or low-frequency products |
| Margin-velocity matrix | Finding products that sell quickly and earn attractive contribution | Contribution margin, unit velocity, return burden, discount rate | Can miss traffic, bundle, loyalty, and channel roles |
| Weighted scorecard | Making portfolio decisions with financial and strategic context | Profitability, velocity, returns, cost-to-serve, substitution, customer and channel factors | Requires agreed weights and disciplined evidence |
ABC classifies economic importance. XYZ adds demand behavior, typically distinguishing predictable items from irregular or unstable ones. An A item with steady demand deserves a different replenishment policy from an A item whose sales depend on promotions. Likewise, a C item with highly predictable replacement demand may be easier to consolidate than a C item that serves an unpredictable but important compatibility need.
Use this method to organize inventory policy and identify review groups. Don't use it as an automatic deletion rule.
Plot contribution margin on one axis and sales velocity on the other. High-margin, fast-moving products are obvious protect-and-invest candidates. Low-margin, slow-moving products deserve investigation. The two middle quadrants require judgment.
A low-margin, fast-moving SKU might be a pricing problem, a traffic acquisition tool, or a product that increases basket size. A high-margin, slow-moving SKU might need better merchandising, a different channel, or a smaller replenishment commitment. The matrix helps teams ask the right question before they act.
A scorecard is the best control against overreliance on sales volume. Assign agreed weights to contribution, velocity, returns, carrying burden, trend, customer value, substitution risk, bundle dependency, and channel requirements. The exact weights should reflect your strategy, not a generic template.
Decision discipline: Score first, then review exceptions. Don't let a product manager's attachment to a favorite SKU replace evidence, but don't let a spreadsheet erase an obligation the business has made to customers or partners.
The strongest approach combines the methods. Use ABC and XYZ to create the initial map, use the margin-velocity matrix to expose economic outliers, then apply a weighted scorecard to the candidates. A practical SKU rationalization methodology also recommends understanding the purchase decision hierarchy, estimating the optimal item count by segment, measuring substitutability, quantifying productivity at multiple levels, and incorporating strategic goals and loyalty data. That logic appears in this assortment and SKU rationalization methodology.
The most dangerous sentence in a rationalization meeting is, “It's in the bottom tier, so cut it.” Low volume measures what the SKU sells directly. It doesn't measure the orders it helps create, the customers it keeps from switching, or the products it makes easier to buy.
A low-volume item may be a compatibility SKU for an older device, a replenishment anchor that brings shoppers back, a bundle component, or a search entry point. It may also satisfy a retailer's assortment expectation. Removing it can push demand toward a competitor rather than toward the replacement your model assumes.
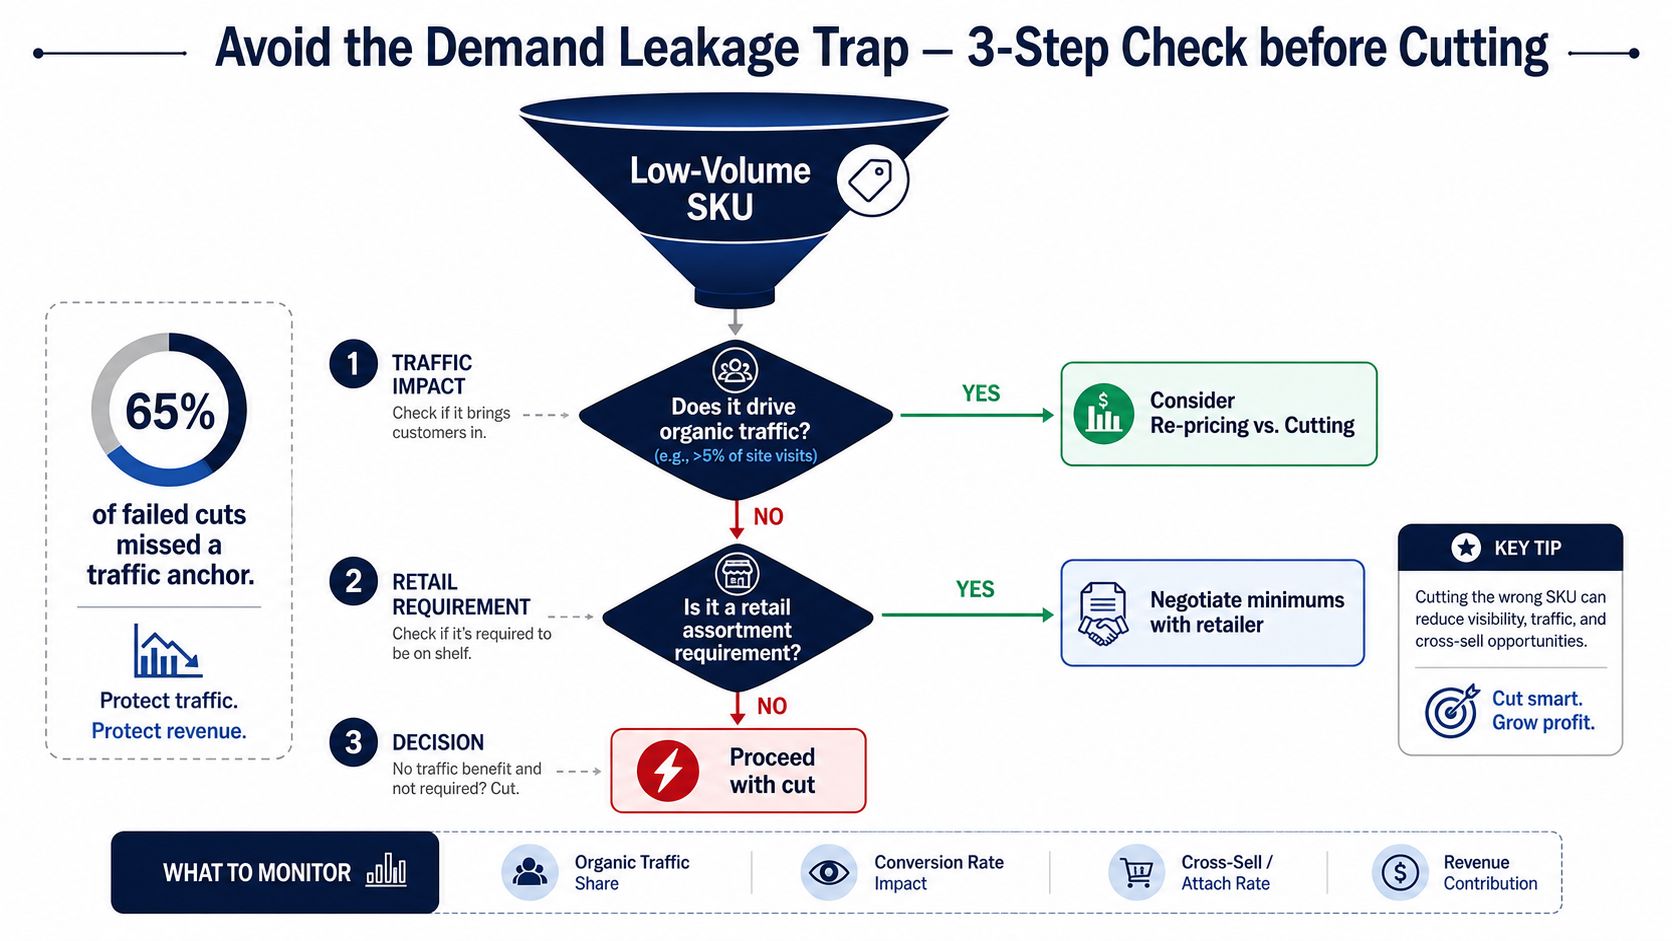
For each proposed exit, identify the intended replacement and estimate how easily a customer can move to it. Transferability is high when the replacement has the same use case, fit, compatibility, price logic, availability, and channel presence. It's low when the customer must change behavior, accept a different specification, or search outside your brand.
Build a simple substitution register with these fields:
Then examine product relationships in orders. If customers frequently buy the proposed exit with a high-value product, cutting it may reduce the perceived completeness of that offer. If the SKU attracts organic discovery, changing the listing without redirecting shoppers can destroy demand that never appears in the SKU's own revenue line.
The practical test is controlled removal. Start with one channel or a defined customer segment, keep the replacement visible, update bundles and product information, and watch whether demand transfers as expected. Monitor replacement sales, conversion, search behavior, customer questions, cancellations, returns, and competitor movement.
The research brief specifically warns that rationalization can create hidden losses when a removed SKU functions as a traffic driver, replenishment anchor, compatibility item, or broader assortment support. It also recommends piloting exits and updating listings, bundles, and reseller files before inventory is cut off.
A product that fails the financial screen but passes the transferability test isn't an automatic keep. It's a candidate for redesign, repricing, bundling, channel restriction, or a negotiated minimum assortment. The decision should follow the customer path, not just the SKU ledger.
A pilot turns a contentious portfolio decision into a measurable operating test. Select a small group of candidate SKUs that represent different risk types, such as slow movers, redundant variants, bundle components, and products with uncertain replacements. Don't choose only the easiest cuts. A pilot that excludes strategic risk teaches the team very little.
Set a baseline before making changes. Record sales, contribution, sessions or impressions where available, replacement-product performance, returns, customer contacts, stock levels, and replenishment commitments. Freeze the definition of each metric so marketing, finance, and operations don't report different results.
A workable sequence is:
The test should have explicit stop conditions. Pause the exit if total category contribution falls, replacement demand doesn't materialize, customer complaints rise, or a channel partner signals a material assortment problem. Scale only when the intended transfer occurs without an unacceptable service or margin consequence.
Start with the annual cost of carrying the candidate inventory. Add storage, handling, expected markdowns, obsolescence, write-offs, and avoidable operational labor. Then estimate the value of released cash and the contribution from inventory that can be redirected to stronger products.
Model the downside separately. Include lost contribution from the exiting SKU, replacement-product margin, expected leakage, liquidation proceeds, disposal costs, listing changes, packaging changes, and any retailer or supplier consequences. A rationalization project creates value only when the recurring savings and redirected contribution exceed transition costs and lost economics.
Use the working capital optimization resource to keep the model focused on cash conversion rather than accounting margin alone. The decision sheet should show three scenarios, conservative, expected, and upside, without disguising assumptions as facts.
Finance check: Never book the full carrying-cost benefit until the inventory policy, purchase orders, warehouse locations, and replenishment rules have actually changed.
Finally, assign an owner to every assumption. Operations owns stock and lead-time data, finance owns cost definitions, marketing owns traffic and merchandising changes, and sales owns channel commitments. That accountability makes the pilot useful even when the answer is to keep a SKU.
SKU rationalization fails in the handoff between decision and execution. The committee approves an exit, but the old listing remains live, the replacement is out of stock, the reseller file still shows the discontinued item, or purchasing replenishes inventory because the old reorder point was never changed.
Governance prevents those errors by making the decision cross-functional from the start. Finance should validate contribution and carrying-cost assumptions. Operations should confirm inventory, supplier, and warehouse implications. Sales should identify customer or retail commitments. Marketing should assess traffic, bundles, search paths, and replacement messaging.
Create a decision record for every candidate. It should state the proposed action, evidence, strategic role, replacement, owner, date, and reversal condition. Require written approval from the relevant department heads, especially when a SKU affects wholesale accounts, subscriptions, warranties, compatibility, or a flagship bundle.
Product teams often defend “pet SKUs” because they remember the launch story or a vocal customer. Let them challenge the evidence, but require a specific business case. “Customers like it” is not enough. The team should show whether customers repurchase it, use it with another item, require it for compatibility, or move to a profitable substitute.
Before the cutover, complete this checklist:
Post-launch review matters as much as the cut. Check performance at a defined interval, document what transferred and what leaked, then assign a re-evaluation date. The research brief recommends revisiting rationalization every six months and maintaining a dataset that spans demand, supply, financial, and strategic variables, a useful cadence for turning a one-time project into portfolio governance.
The result should be a living assortment policy. New SKUs need an entry case, existing SKUs need performance and role reviews, and proposed exits need transferability evidence. That discipline keeps catalog expansion from recreating the same hidden costs.
If your team is debating which products to keep, consolidate, or retire, Million Dollar Sellers offers access to experienced ecommerce operators who share practical lessons on inventory, margin, and scalable execution. Visit the community to connect with founders who can pressure-test your SKU rationalization plan before a spreadsheet decision becomes a customer or cash-flow problem.
Join the Ecom Entrepreneur Community for Vetted 7-9 Figure Ecommerce Founders
Learn MoreYou may also like:
Learn more about our special events!
Check Events