Chilat Doina
November 7, 2026
Your best seller just ran out while ads were still sending traffic to it. The warehouse says stock is coming, finance says the order was never approved, and support is answering the same delivery question for the fortieth time today. That's not a marketing problem or a warehouse problem. It's what happens when e commerce business operations grow as separate fixes instead of one connected system, where a forecast miss becomes a stockout, a stockout wastes ad spend, and a late delivery becomes a return you'll pay to process.
A customer places an order for an item shown as available, but the warehouse cannot find it. The resulting cancellation costs the sale, creates support work, and may leave paid traffic pointed at a product that cannot ship. These failures start in different functions, but they meet in the same order.
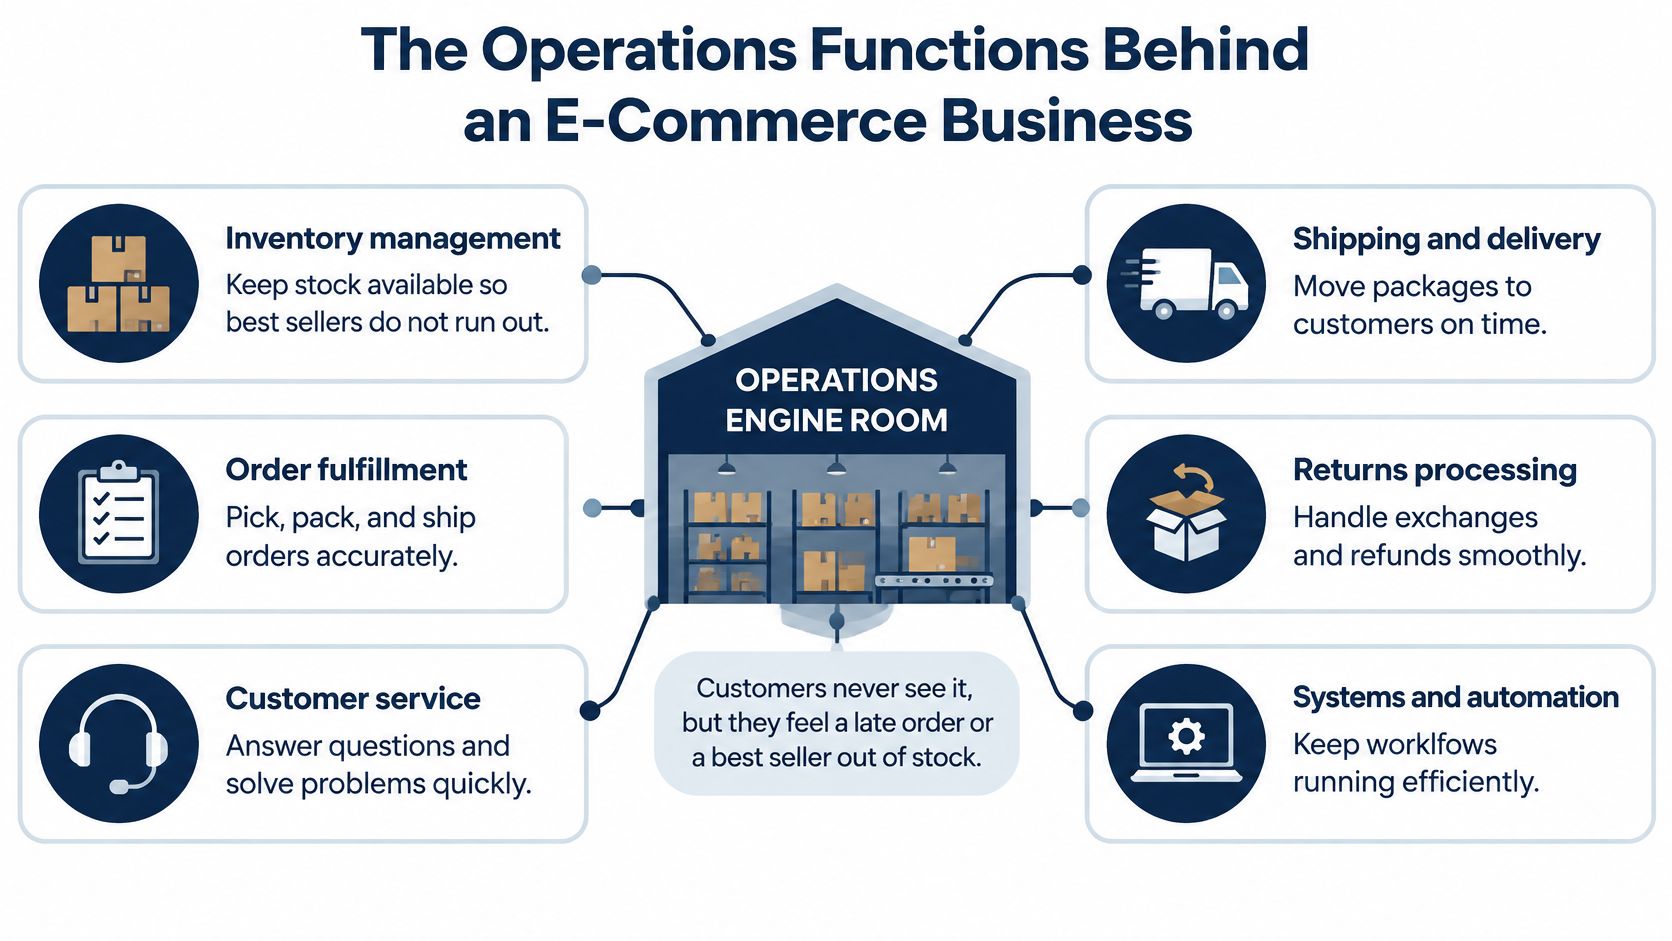
Fulfillment answers whether each order can ship on time at a known cost. Late dispatches and unexpected carrier charges can erase margin, so delivery promises need to reflect the actual shipping plan. For example, route-optimized ecommerce freight can help align freight routes with delivery commitments.
Inventory and demand planning answers whether the right units are available in the right place. A stockout on a best seller can leave demand unmet while slower products tie up cash. Catalog data answers whether every sales channel shows the same price, product details, and availability. Mismatches can lead customers to order at an outdated price or buy an item that cannot ship.
Customer operations and returns answers whether customer contacts and refunds are handled without consuming the original order's margin. Finance answers whether landed cost and net margin reflect marketplace fees, freight, and refunds, not just the sale price. Systems and process answers whether employees can follow documented steps or must rely on one person's memory.
If a forecast understates demand for a hero SKU, inventory can run out while ads continue sending traffic to the product. Customers may turn to substitutes, which can bring more returns and support contacts. A forecasting gap then affects advertising efficiency, fulfillment workload, and margin at once.
Review each function against three checks: a named owner, a measured KPI, and a recent review date. A low score points to work that lacks clear accountability or follow-through, leaving the function exposed when demand rises.
Add owners before you add software or headcount. Software given to a function with no owner produces reports nobody acts on, and headcount added to an undefined seat produces two people doing half of each other's job.
An operations lead owns the weekly score across fulfillment, inventory, returns, and margin. Don't give this person advertising as well. When the same person owns media and stock, every stockout gets argued as a traffic problem and every traffic dip gets argued as a stock problem, and neither gets fixed.
That's normal at your stage, and it's fine as long as you write the handoff before you hire. The new person should inherit an owner name, a KPI, and a review date for each seat they take. If they inherit a private inbox and a spreadsheet only the founder understands, you've hired a person, not fixed a function.
Split a seat only after its KPI misses the agreed threshold for two review cycles in a row. One bad month is an incident. Two is a capacity problem.
Redraw the chart every quarter, on paper, with names in boxes. Keep ads and creative outside this chain entirely. The moment a stockout gets treated as a media problem, the person who could've prevented it stops hearing about it, and you'll buy the same lesson again next quarter.
You're trading control, fixed cost, and speed to scale against each other. There's no model that's best in general, only one that fits your order profile now and doesn't block the profile you're growing into. If you're weighing outsourced options, it helps to understand how 3PL fulfillment works before you compare quotes.
| Model | Best fit | Control over stock and packing | Main risk |
|---|---|---|---|
| In-house warehouse | Steady volume, custom packing, own staff | Full | Fixed rent, labor and peak-season hiring |
| Third-party logistics (3PL) | Growing brands needing multi-region storage without a site | High, through SLAs and reporting | Dependence on provider performance and onboarding time |
| Marketplace fulfillment | Amazon-led brands with fast-turning, standard-size SKUs | Low to medium | Storage and return fees, limited packaging control |
| Dropshipping | Testing a new catalog with little stock risk | Low | Supplier stockouts and inconsistent delivery |
| Hybrid split | Mixed fast sellers and bulky or custom items | Medium to high | More systems to sync and more handoff failures |
Start with monthly order volume and how spiky it is. Steady volume absorbs fixed warehouse rent. Spiky volume punishes it, because you staff for peak and pay for empty benches the rest of the year. A 3PL converts that fixed cost into a per-order cost, which is worse per unit at high steady volume and much better when volume swings.
Next, look at SKU count and size. Fast-turning, standard-size products suit marketplace fulfillment because the fee structure rewards velocity. Bulky, fragile, or custom-packed items punish it, since storage is charged on space and your packaging isn't their priority. That's where a hybrid split earns its complexity, fast sellers in marketplace warehouses, awkward items with a 3PL who'll pack them your way.
Your return rate changes the math more than most quote sheets admit. A model that looks cheap on outbound pick and pack can be expensive once returns need inspection, grading, and restocking. Ask who inspects a returned unit, what they charge per touch, and how fast a resalable unit gets back into available stock. Slow restocking is a stockout you created yourself.
Cross-border needs settle the question for many brands. Holding stock in the destination country shortens delivery and removes customs surprises for the buyer, but it splits your inventory across pools and raises the cost of a forecasting error in each one. Ship cross-border from one pool and inventory stays simple while delivery times and duty handling get harder. Operators working through that trade often look for ways to lower freight costs with Aeros Couriers rather than opening a second warehouse too early.
Build one number, total cost per order, including storage, pick and pack, packaging, outbound freight, returns processing, and the account management time you'll spend chasing problems. A low pick fee with expensive storage loses to a higher pick fee with cheap storage as soon as your inventory turns slowly.
Before signing with a 3PL, get three terms in writing, the dispatch cut-off and what happens to orders placed after it, the accuracy rate they'll commit to and how it's measured, and the damage claim process, including who pays and how long a claim takes. Vague answers here become expensive arguments later.
Your fulfillment model caps the delivery promise you can make. Choose the model first, then set the dispatch date at checkout, never the reverse.
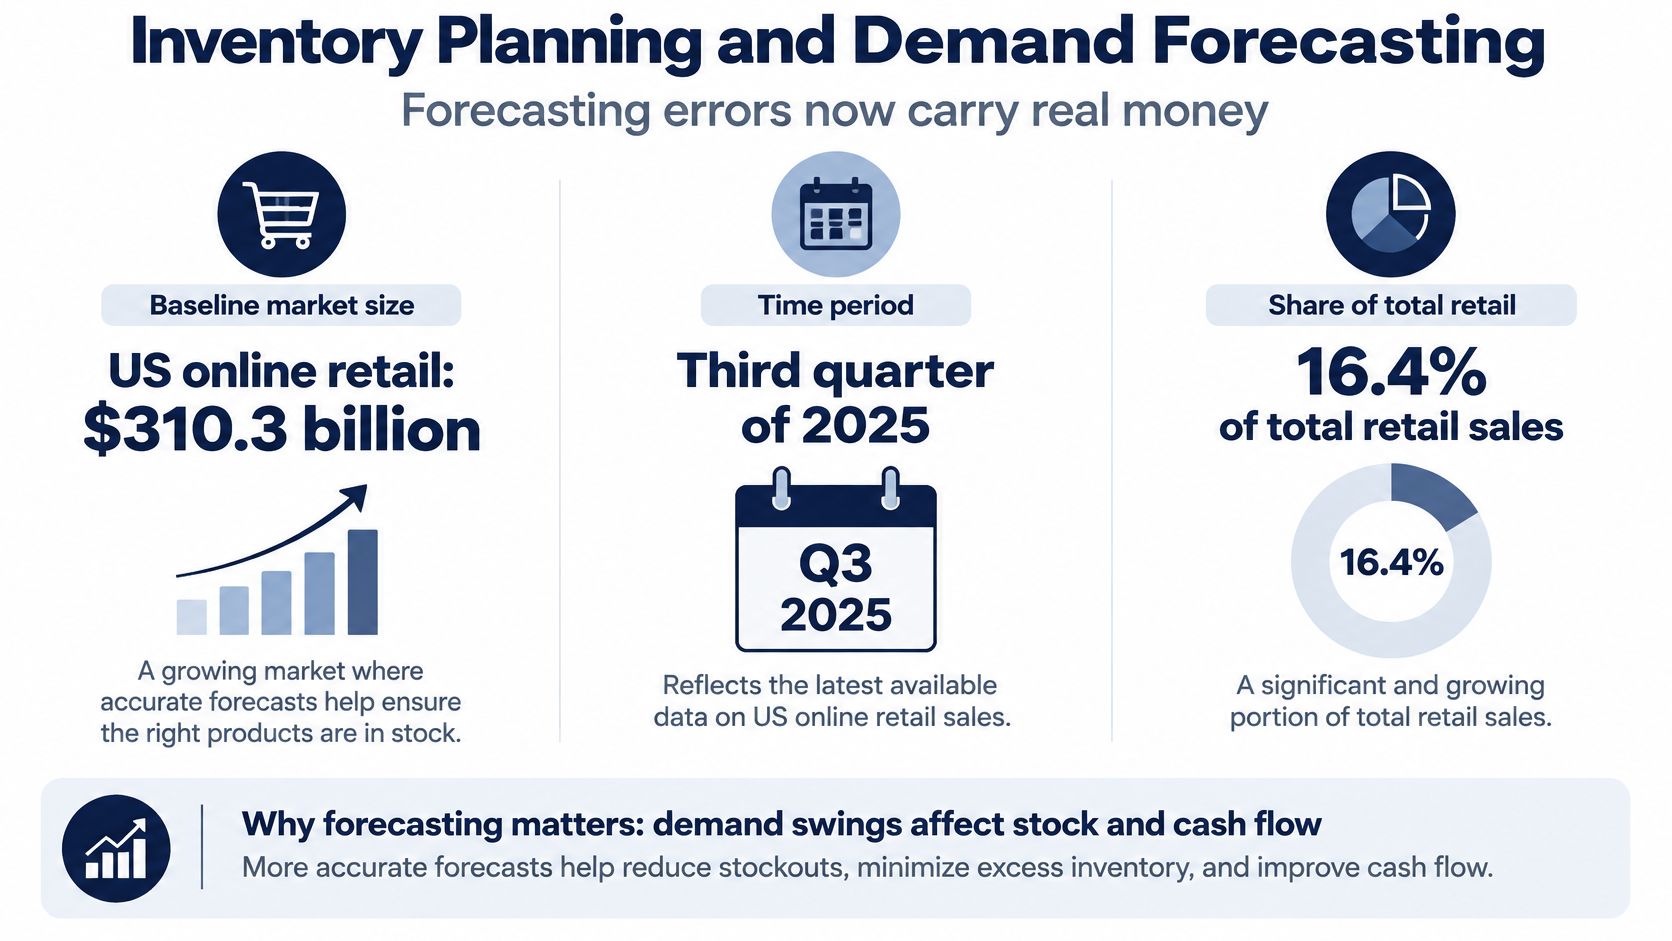
Forecasting errors used to be a nuisance. Now they're a line item. UNCTAD's business e-commerce sales publication carries the U.S. Census Bureau estimate that seasonally adjusted retail e-commerce sales reached US$310.3 billion in the third quarter of 2025, representing 16.4% of total U.S. retail sales during the quarter. When online is roughly one-sixth of retail, a percentage point of forecast error is real money sitting in the wrong SKU. If you want the mechanics in more depth, start with the fundamentals of inventory forecasting and then apply the method below.
Forecast demand per SKU, weekly, using the trailing twelve weeks as your base. Then adjust for seasonality and promotions in separate lines, never blended into the base. Separate lines matter because when the forecast misses, you need to know which assumption was wrong. A blended number tells you that you missed. A layered forecast tells you whether the promotion underperformed or the base demand shifted, and those need opposite responses.
Safety stock is where most brands guess. Don't. Use the formula, safety stock = z × σd × √L, where σd is the standard deviation of daily demand and L is supplier lead time in days. The z-score comes from the service level you're willing to pay for, meaning the probability of not stocking out during lead time.
Say a core SKU sells an average of 30 units a day, with a daily standard deviation of 8 units, and your supplier lead time is 16 days. You target a 95% service level, which gives a z of 1.65.
Safety stock is 1.65 × 8 × 4, which is about 53 units, since the square root of 16 is 4. Your reorder point is average demand during lead time plus safety stock, so 30 × 16 + 53 = 533 units. When available stock falls to 533, you order. Not when someone notices the shelf looks thin.
Notice what drives the number. Doubling demand variability doubles your safety stock. Doubling lead time only multiplies it by the square root of two. So a supplier who's unreliable on quantity costs you more inventory than a supplier who's slow, and stabilizing demand signals, fewer surprise promotions, cleaner launch calendars, frees up cash without touching service levels.
The short walkthrough below shows how planning inputs connect before you commit to a purchase order.
| Target service level | Use it for |
|---|---|
| 90% (z = 1.28) | Long-tail, low-margin SKUs |
| 95% (z = 1.65) | Core sellers, as in the 30-unit example with lead time of 16 days |
Higher isn't free. Each step up in service level buys fewer avoided stockouts for more units held, and past a point you're paying warehouse rent to insure against a stockout that would've cost less than the insurance.
Classify SKUs and review on different clocks. Review A items weekly, B items every two weeks, and C items monthly. Set higher service targets only where a stockout costs more than the holding cost, which means high margin, high conversion, or a listing whose ranking you'll lose while it's empty. Long-tail SKUs at a 95% target are how healthy brands end up running out of cash.
Most operators treat a generous return policy as a conversion lever and stop thinking there. The numbers don't support stopping there. VTEX's reporting on returns management costs notes that U.S. shoppers were expected to return $849.9 billion of merchandise in 2025, equal to 15.8% of total retail sales, with the online return rate estimated at 19.3%. The same reporting cites an industry estimate that every $1 million refunded can create approximately $1.3 million in total retailer cost after processing and reverse logistics are included.
That multiplier is the point. A refund isn't the cost. The cost is outbound freight you don't recover, return freight, inspection, repacking, the discount on a unit that can't sell as new, and the support contact that came with it. A SKU can show healthy gross margin and still lose money once one in five units travels twice.
Guardrail: Cut avoidable returns by fixing causes, not by making legitimate returns harder. Friction that blocks a genuinely faulty product buys you chargebacks, bad reviews, and marketplace penalties that cost more than the refund did.
Returns are a product and merchandising signal wearing a logistics costume. Read them that way and they tell you which listings, size charts, and packages to fix next.
Automating an unclear process doesn't fix it. It produces the same errors at higher speed, in more channels, before anyone notices. ChannelEngine's 2026 marketplace seller research found that 82% of organizations were adopting or considering AI, yet three in five marketplace operations remained mostly manual or only partly automated, and manual work consumed an average of 32% of weekly marketplace workload. Adoption and transformation are different things. Buying a tool is the easy half.
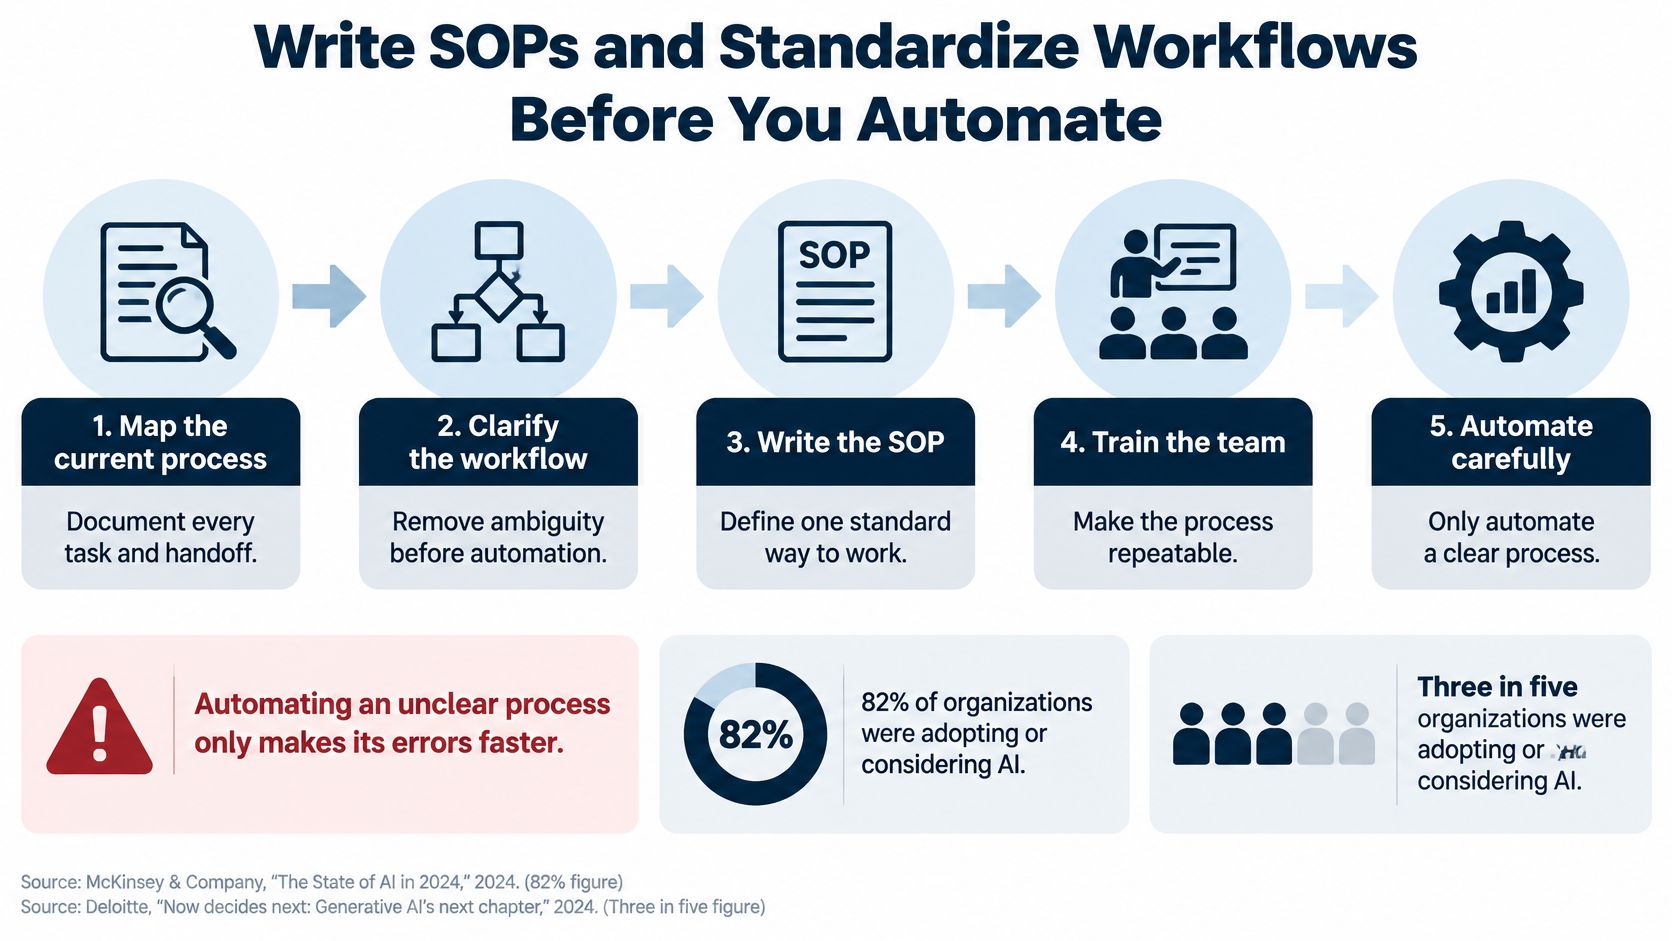
Answer three questions first. Who owns the product, price, and inventory data the automation will act on? Which human override rules apply, and who can stop the automation mid-run? What's the process-level return, in hours saved or errors avoided, for this specific workflow?
Keep experimentation, workflow integration, and scaled deployment as separate stages with separate sign-off. A tool that works in a sandbox on clean sample data hasn't yet met your real catalog, and automating inconsistent product data just publishes your inconsistencies everywhere at once.
Tools follow processes, never the reverse. Buy software to run a workflow you've already standardized and it will fit. Buy it hoping it'll tell you what your workflow should be and you'll spend a year configuring someone else's assumptions into your business. When a platform decision reaches ERP scale, it pays to compare ERP selection criteria against your own requirements list instead of a vendor's feature grid.
| Layer | What it runs | Evaluate it on |
|---|---|---|
| Order management system | Routes orders across channels and warehouses | Channel connectors and split-order rules |
| Warehouse or 3PL system | Tracks bins, picks, packs and dispatch | Cut-off handling and accuracy reporting |
| Demand planning tool | Forecasts SKU demand and reorder points | Forecast granularity and lead-time handling |
| Product information management | Holds one master record for listings | Attribute mapping and channel syndication |
| Finance and landed cost | Calculates net margin per order | Fee import and refund accounting |
| Helpdesk and returns portal | Handles contacts, return requests and refunds | Return reason capture and macro reuse |
A peer recommendation is a useful shortlist only when the recommender has no commercial stake in your choice. Ask directly whether they receive referral fees. It's not rude, it's diligence, and honest operators answer it easily. We partner with vendors for value, not kickbacks, and we have no affiliate agenda, which is the standard you should expect from anyone recommending your stack.
Finish by asking each vendor for a trial on one real workflow, with your real data, before you sign. A vendor who won't prove it on your messiest process is telling you something.
Every KPI needs three things before it earns a place on your dashboard, a formula, an owner, and a cadence. A number without an owner is decoration, and a number reviewed at random intervals can't trigger action while action still helps.
| KPI | Formula | Review cadence |
|---|---|---|
| Fill rate | Orders shipped complete and on time ÷ orders received | Weekly |
| Days of inventory cover | Units on hand ÷ average daily sales | Weekly |
| Stockout rate | SKUs at zero stock ÷ active SKUs | Daily |
| Return rate by SKU | Units returned ÷ units sold, per SKU | Monthly |
| Contribution margin per order | Revenue minus product cost, fulfillment, fees and returns, ÷ orders | Monthly |
Checkout leakage sits outside most operations reviews, yet it's driven by operational settings, shipping prices, delivery promises, tax display, and payment options. Baymard Institute's cart abandonment research identified extra costs such as shipping, tax, and fees as a leading non-browsing abandonment reason at 40%, with slow delivery at 20%. Neither of those is a design problem. Both are pricing and fulfillment configuration, which means they belong in your weekly operations review.
Measure four stages separately, product view to cart, cart to checkout start, checkout start to payment, and payment to order completion. A blended conversion rate hides which stage broke. Then segment every stage by device, country, payment method, and new versus returning customer.
Segmentation is what stops you misdiagnosing the problem. A tax display error in one country or a failing payment method on mobile will drag your global rate down and tempt you into a full checkout redesign. Segmented, it's a one-market fix you can ship this week.
Set a threshold for each KPI and funnel stage in advance. When a stockout rate or a funnel stage moves beyond it, open a named investigation with a deadline, assigned to the function owner. Don't add a note to the weekly report and move on. Notes are where operational problems go to be read about again next week, slightly worse.
If you're running a seven or eight figure brand and your operations still depend on a few people holding everything together, Million Dollar Sellers puts you in a room with founders who've already rebuilt their fulfillment, forecasting, and returns systems at scale, with 500+ member SOPs and templates and vetted vendor recommendations you can pressure test against operators at your revenue level. It's an invite-only community for ecommerce founders doing at least $1M in trailing twelve month revenue, so apply if you want your next operations decision reviewed by people who've paid for the wrong one before.
Join the Ecommerce Community for Founders Scaling from 7 to 9 Figures
Learn MoreYou may also like:
Learn more about our events!
Check Events