
Chilat Doina
September 21, 2026
Inventory forecasting is predicting future SKU demand from past sales, trends, seasonality, and planned events so you can set reorder quantities, safety stock, and timing before stock runs out or capital gets stuck in excess inventory. In practice, forecast quality matters because one benchmark cited in 2026 puts average demand-forecast accuracy at around 55%, while top performers reach 85% to 90%.
If you're reading this, there's a good chance you're sitting in one of two bad positions. You're either watching a fast-moving SKU drift too close to zero while a promotion, Prime event, or email campaign is already booked. Or you're staring at pallets of slow-moving stock that looked like a safe buy when you placed the PO.
That's why "what is inventory forecasting" isn't really a textbook question for ecommerce operators. It's a cash question. A margin question. A service-level question. And for most brands, the biggest mistake isn't that they don't forecast. It's that they forecast from raw historical sales as if those numbers represent true demand.
They often don't.
When a SKU stocked out for five days, your sales history didn't record low demand. It recorded your inability to sell. If returns hit late, your recent history can also look cleaner or noisier than reality depending on how your systems post them. In ecommerce, especially for brands scaling through Amazon, Shopify, retail, and paid media, that hidden distortion is where a lot of bad purchasing decisions begin.
A brand can hit its traffic target, convert well, and still miss the month because inventory calls were wrong.
The pattern is familiar. A hero SKU goes out of stock right as paid spend increases. The team pays for expedited freight to recover, then spends the next few weeks explaining lower margin. At the same time, another SKU gets overbought because a launch spike or promo week was treated like steady demand. Cash sits in storage instead of funding the next PO, the next test, or the next product line.

Inventory decisions shape three outcomes founders feel fast. Revenue, margin, and cash.
The day-to-day decisions are simple to name and expensive to get wrong:
The mistake I see most often is not a lack of effort. It is using raw sales history as if it were clean demand history.
It usually is not. If a SKU was stocked out for six days, the sales file records six days of suppressed sales, not six days of weak demand. If a listing lost the Buy Box, got throttled, or had inventory split across channels with poor syncing, the history is censored again. Teams then average those numbers, call it a forecast, and place a PO that is already biased low.
That hidden bias matters more than people expect. A brand can survive a rough forecast in one month. It struggles when repeated under-forecasts force air shipments and repeated over-forecasts fill the warehouse with inventory bought off distorted signals.
A basic moving average has a place. Early-stage brands with a small catalog, short lead times, and stable demand can often run on it for a while.
But the method has to match the business. For a small seller with a handful of stable SKUs, a cleaned-up average may be enough. For a growing brand running promos, adding channels, and dealing with variable lead times, that same method starts missing too much context. More advanced models can help, but they are only an upgrade if the inputs are corrected first. AI trained on censored sales history still learns the wrong lesson.
Three forecasting approaches tend to map better to seller maturity than to hype:
The trap is jumping to the third option before doing the work required for the first two. If stockouts, returns timing, listing issues, and one-off events are not handled properly, model sophistication does not fix the decision.
Practical rule: Forecasting is only useful when the team can explain the reorder date, the order quantity, and the buffer behind it using demand history that has been corrected for obvious distortions.
Brands that scale cleanly treat inventory as a growth constraint, not a back-office report. They correct the history, choose a method that fits their stage, and make purchasing decisions from there.
A planner reviews last month's sales for a SKU that sold out for nine days, sees a dip, and feeds that number straight into the next reorder. The forecast drops. The next PO comes in light. The SKU sells out again, and the history gets distorted a second time.
That is the mistake hidden inside a lot of “SKU-level forecasting.”
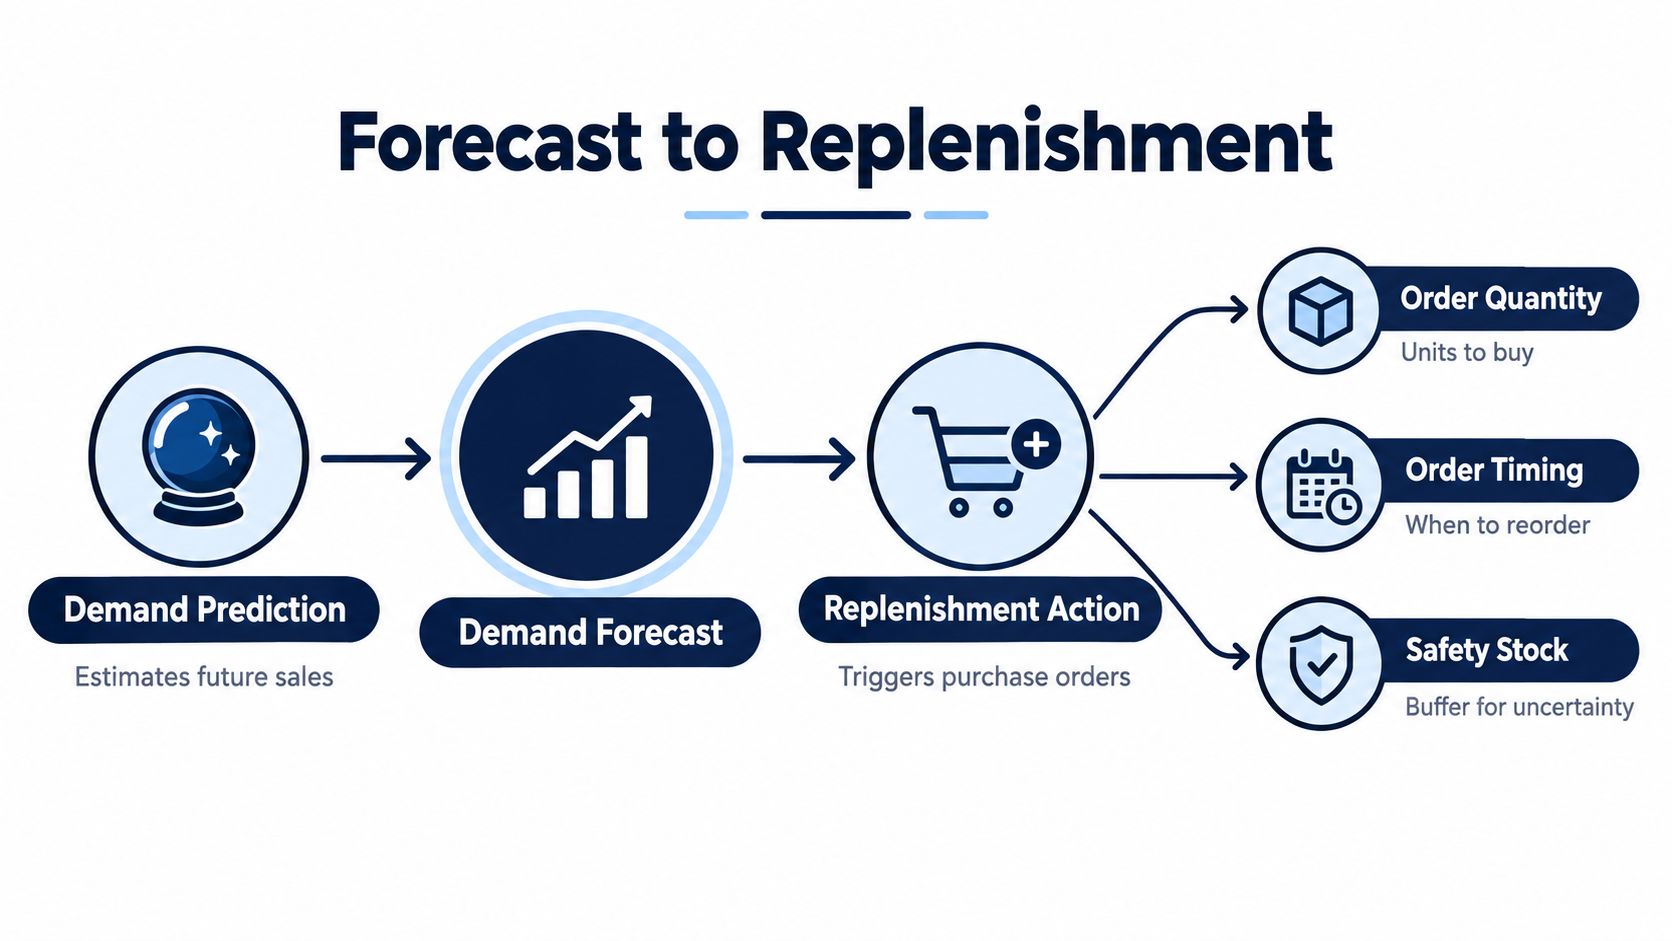
At SKU level, forecasting means estimating unconstrained demand well enough to make a buying decision. The practical questions are specific. How much demand will occur before replenishment arrives? When does the reorder trigger need to fire? How much buffer belongs on this SKU given its volatility, margin, and service target?
That distinction matters because recorded sales are not always the same as true demand. If a product was out of stock, suppressed on a marketplace, bundled differently, or hit by a one-off promotion, the raw sales line is censored history. Using it without correction trains the team to buy less right after demand was stronger than the system could record.
For SKU-heavy brands, catalog discipline matters too. A cluttered assortment creates thin, noisy demand signals and wastes planning time on products that do not justify close management. That is one reason to review forecasting rules alongside SKU rationalization decisions for slow-moving and duplicate products.
A forecast is an input. Replenishment policy is the decision.
Two brands can use the same SKU forecast and still get very different outcomes because they set different review cadences, reorder points, minimum order quantities, and safety stock rules. One buys weekly and accepts more stockout risk to protect cash. Another buys in larger batches because suppliers require it, then carries more inventory to hold service levels. The forecast alone does not decide the PO.
This is also where method choice needs some discipline. A smaller seller may do fine with cleaned historical averages if stockouts are corrected and lead times are stable. A more developed operator usually needs statistical methods that separate baseline demand from promotion spikes and seasonality. Machine learning can help at higher scale, but only after the demand history is cleaned and the replenishment process is stable enough to use the extra complexity well.
SKU decisions fail in the handoff from forecast to order.
A forecast that is directionally decent can still produce bad replenishment if the team ignores asymmetry. Underforecasting a hero SKU before a long supplier lead time can cost contribution margin, ad efficiency, and ranking. Overforecasting a tail SKU ties up cash and warehouse space, but the business impact is often smaller. Treating both errors as equally painful hides where the risk sits.
I care less about whether a model looks advanced on a dashboard and more about whether the planner can explain the order. If the team cannot explain why a SKU needs 42 days of coverage instead of 28, or why a buffer belongs on one variant but not another, the forecast is still disconnected from the decision.
Another common failure sits in the lead-time window. Teams often estimate demand by period, then roll it forward as if each period were independent. Research on lead-time demand variance shows that positive correlation across periods can materially increase uncertainty, which means safety stock can be understated if that dependence is ignored in the inventory calculation (Cardiff research on lead-time demand variance).
In practice, that is why a forecast can look acceptable at weekly level and still create stockouts during replenishment lead time. The model may not be the only problem. The bigger issue is often that raw sales were never corrected for stockouts, then lead-time risk was translated into inventory policy too optimistically.
Forecasting at SKU level only works when demand is cleaned first, uncertainty is carried through the lead-time window, and the output ends in a clear reorder decision.
A planner pulls the last 90 days of sales for a fast-moving SKU, drops the average into a reorder sheet, and gets a clean-looking answer. The SKU was out of stock for 18 of those days. The forecast is now wrong before anyone debates method choice.
That is the trap behind a lot of ecommerce forecasting discussions. Teams compare Excel rules, statistical models, and machine learning as if they are all working from true demand history. In practice, raw sales are often censored by stockouts, channel delays, and returns timing. If that input is wrong, a more advanced model can produce a more precise version of the wrong answer.
Method choice should match brand maturity, data quality, and planning discipline.
| Method | Best For | Data Needs | Maintenance | Risk |
|---|---|---|---|---|
| Rule-based | Smaller catalogs, stable demand, founder-led planning | Basic demand history, on-hand stock, lead time, stockout notes | Low | Repeats past distortions and breaks during promotions, seasonality, and growth |
| Statistical | Brands with enough history to model trend and seasonality by SKU | Cleaned time-series demand data, stockout corrections, event calendar | Moderate | Gives false confidence if the baseline is built from censored sales |
| Machine learning | Larger catalogs, more channels, richer datasets, stronger ops stack | Integrated demand, stock, returns, promotion, pricing, and channel inputs | Higher | Adds complexity without better ordering decisions if data governance is weak |
Rule-based forecasting covers trailing averages, weeks-of-cover rules, and manual reorder points in spreadsheets. It is still a sensible starting point for a younger brand with a manageable SKU count and a planner who knows the catalog well.
The trade-off is simple. You get speed and transparency, but very little protection against distorted history. If a SKU stocked out twice last month, the rule usually treats suppressed sales as real demand. That pushes the next buy order down, which increases the chance of another stockout. I see this loop constantly in founder-led brands that believe they are being conservative.
Use this stage if the business is still small enough to review exceptions manually. Do not use it as an excuse to skip stockout adjustments.
For many growing brands, statistical forecasting is the best operating middle ground. It handles level shifts, trend, and seasonality better than static rules, while staying explainable enough for a planner to challenge the output before a PO is placed.
This only works if the baseline demand series is cleaned first. A simple exponential smoothing model built on corrected demand will usually beat a fancier process built on raw sales with missing availability periods. If you're comparing baseline approaches, this guide to model selection for smoothing is a practical reference because it ties the method to the shape of the series.
This is also the stage where seller maturity matters more than model sophistication. Brands with weekly planning discipline, usable lead-time history, and a reliable promo calendar usually get real value here. Brands still reconciling Shopify, Amazon, and wholesale by hand usually do not.
Machine learning starts to make sense when the catalog is large, channels behave differently, and the team can maintain a wider set of inputs. It can capture interactions that standard univariate models miss, especially when pricing, media, marketplace events, and channel mix all move demand.
It is not an automatic upgrade.
I have seen ML forecasts win on forecast accuracy and still disappoint in inventory performance because the team never fixed the ordering logic around them. If the system predicts demand well but the replenishment policy uses bad lead times, ignores MOQ constraints, or treats censored sales as normal history, service levels will still suffer and inventory can still bloat.
The practical comparison is straightforward:
The right upgrade path is usually rules, then statistics, then selective ML. Skipping straight to the last step often creates more work for the ops team without improving purchase decisions.
The biggest forecasting trap in ecommerce is trusting raw sales history as if it were pure demand history.
It isn't. Sales records are often censored by stockouts. If a SKU was unavailable, customers couldn't buy it, so the data understates demand. Returns create another distortion because units can show up late and change the shape of recent history. Ecommerce guidance on this point is unusually clear: forecasting should correct for censored sales data caused by stockouts and delayed returns, and daily or weekly demand is often the right operating cadence because paid media actively shapes demand. That framing is laid out in this ecommerce inventory forecasting guide.
Before you improve the model, clean the underlying record:
A raw Shopify export or Amazon business report isn't enough on its own. Those tools show transactions. They don't automatically reconstruct unconstrained demand.
Don't build a reporting stack that worships one accuracy number and ignores operating outcomes. Track a mix of forecast error and inventory health.
A practical KPI set looks like this:
For operators building out dashboards, this breakdown of ecommerce KPIs is a strong companion to the forecasting workflow.
Most brands don't need more complex math first. They need cleaner demand reconstruction.
Once that discipline is in place, every forecasting method gets better because the input finally resembles real demand.
A brand can post a better forecast and still miss revenue because the buying rule never changed. I see this often after a team improves model accuracy, then wonders why hero SKUs are still going out of stock and slow movers are still piling up.
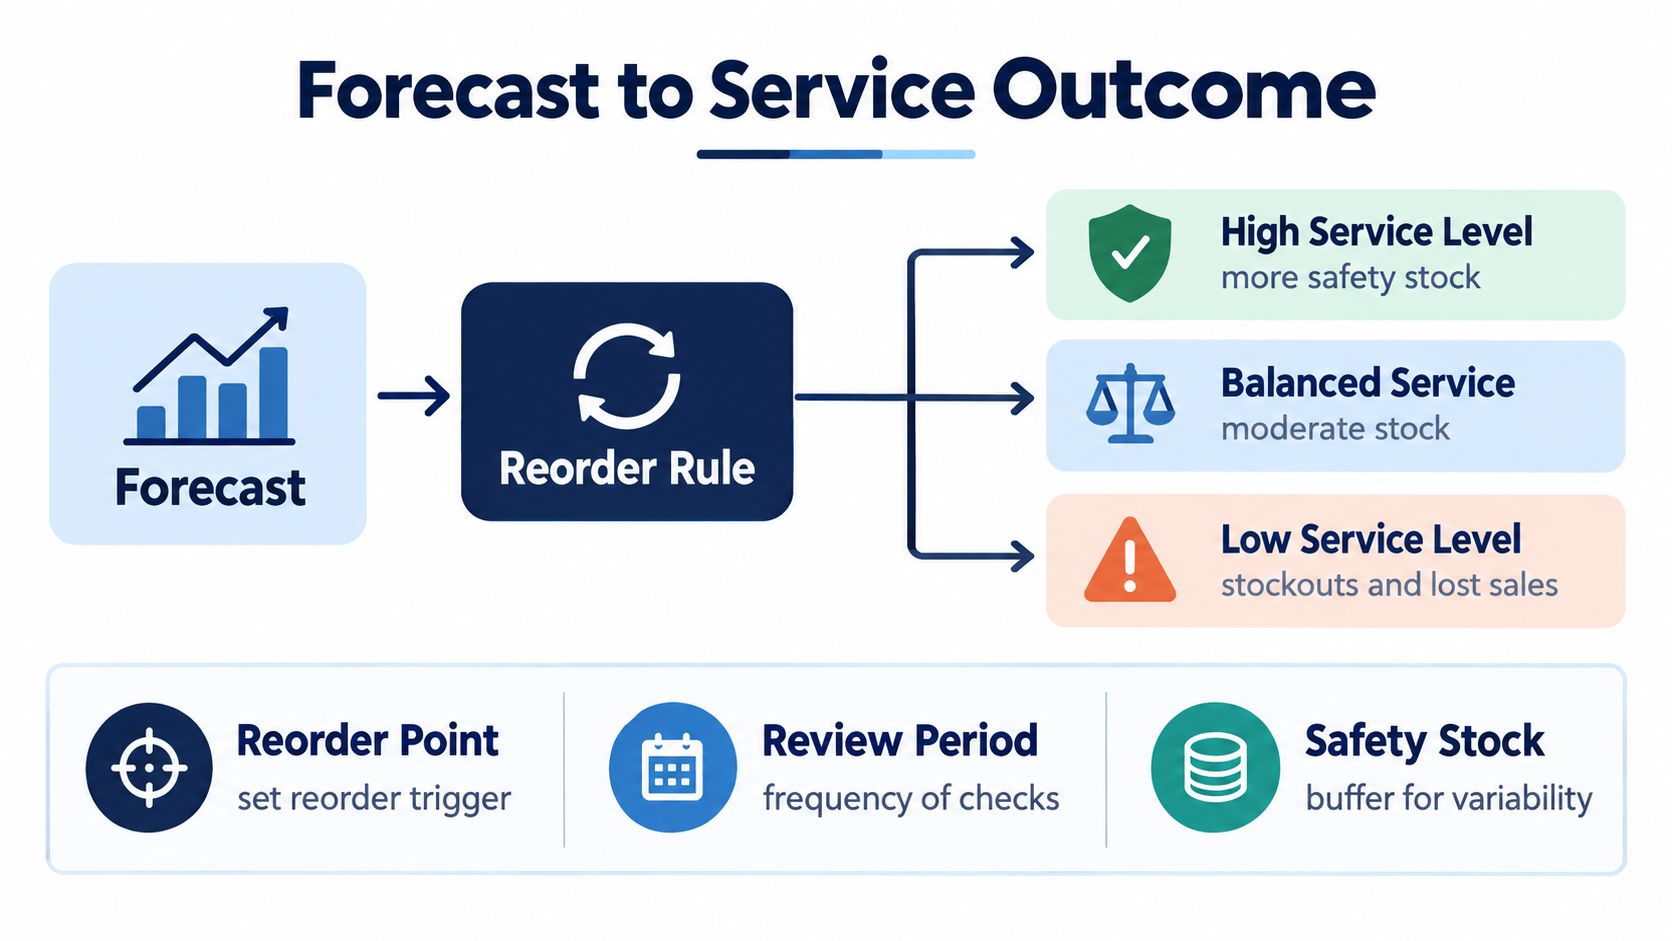
Forecasting only matters when it changes three operating decisions:
This is also where the stockout correction issue becomes expensive. If the forecast was built from raw sales and those sales were capped by past stockouts, the reorder point starts from a false baseline. The model reads "we sold 8 units" when real demand may have been 12. Then the replenishment policy adds a buffer to the wrong number. The result looks disciplined in a spreadsheet and fails in the warehouse.
A second trap shows up in omnichannel businesses. DTC, marketplace, and wholesale teams often plan from different demand views, so one channel reacts to true consumption while another reacts to orders placed downstream. That split creates bad policy choices, especially for shared inventory.
The right replenishment setup depends on seller maturity more than on whether the forecasting tool is branded as AI.
A practical way to think about it:
That trade-off gets ignored in too many software demos. Better forecast fit does not guarantee better service level, lower carrying cost, or higher turnover. Those outcomes depend on how the forecast is converted into reorder timing and order quantity.
Under-buffering rarely feels dramatic at first. It shows up as repeated "unexpected" stockouts on the same products, expedited freight, and customer service tickets that spike after a promotion or supplier delay. In practice, the business is paying for a policy that assumed demand and lead time would behave more cleanly than they do.
Over-buffering creates a different mess. In-stock rate looks healthy for a while, but cash gets trapped in inventory that was bought to protect against uncertainty that never materialized. Then the team starts discounting aging stock, cutting future open-to-buy, and losing flexibility on the SKUs that need investment.
If you're evaluating tooling or process changes around AI-driven supply chain management, use a simple test. Ask whether the system improves the actual buy decision under uncertainty, not whether it produces a nicer forecast chart.
A useful replenishment system makes the trade-off visible. It shows the service level you're trying to protect, the inventory you're committing to hold, and the cash tied up in that choice.
For brands tightening that connection, this guide to inventory optimization for ecommerce operations is a useful next read because it connects policy settings to service and working capital outcomes.
A healthy process has a clear chain from demand signal to purchase action. Teams can explain why a reorder fired, why the buffer is set where it is, and what service outcome they expect in return.
The best setups are rarely the most complicated. They are the ones that correct censored demand, apply a replenishment policy the team can defend, and adapt fast enough when conditions change. That is how forecasting improves service outcomes instead of staying trapped in a dashboard.
A common failure pattern looks like this. A brand finally starts forecasting, exports twelve months of sales from Shopify or Amazon, drops the file into a model, and feels confident because the chart looks clean. Three months later, the team is still missing on key SKUs because the history was never corrected for stockouts, suppressed listings, late receipts, or channel gaps. The model learned recorded sales, not actual demand.
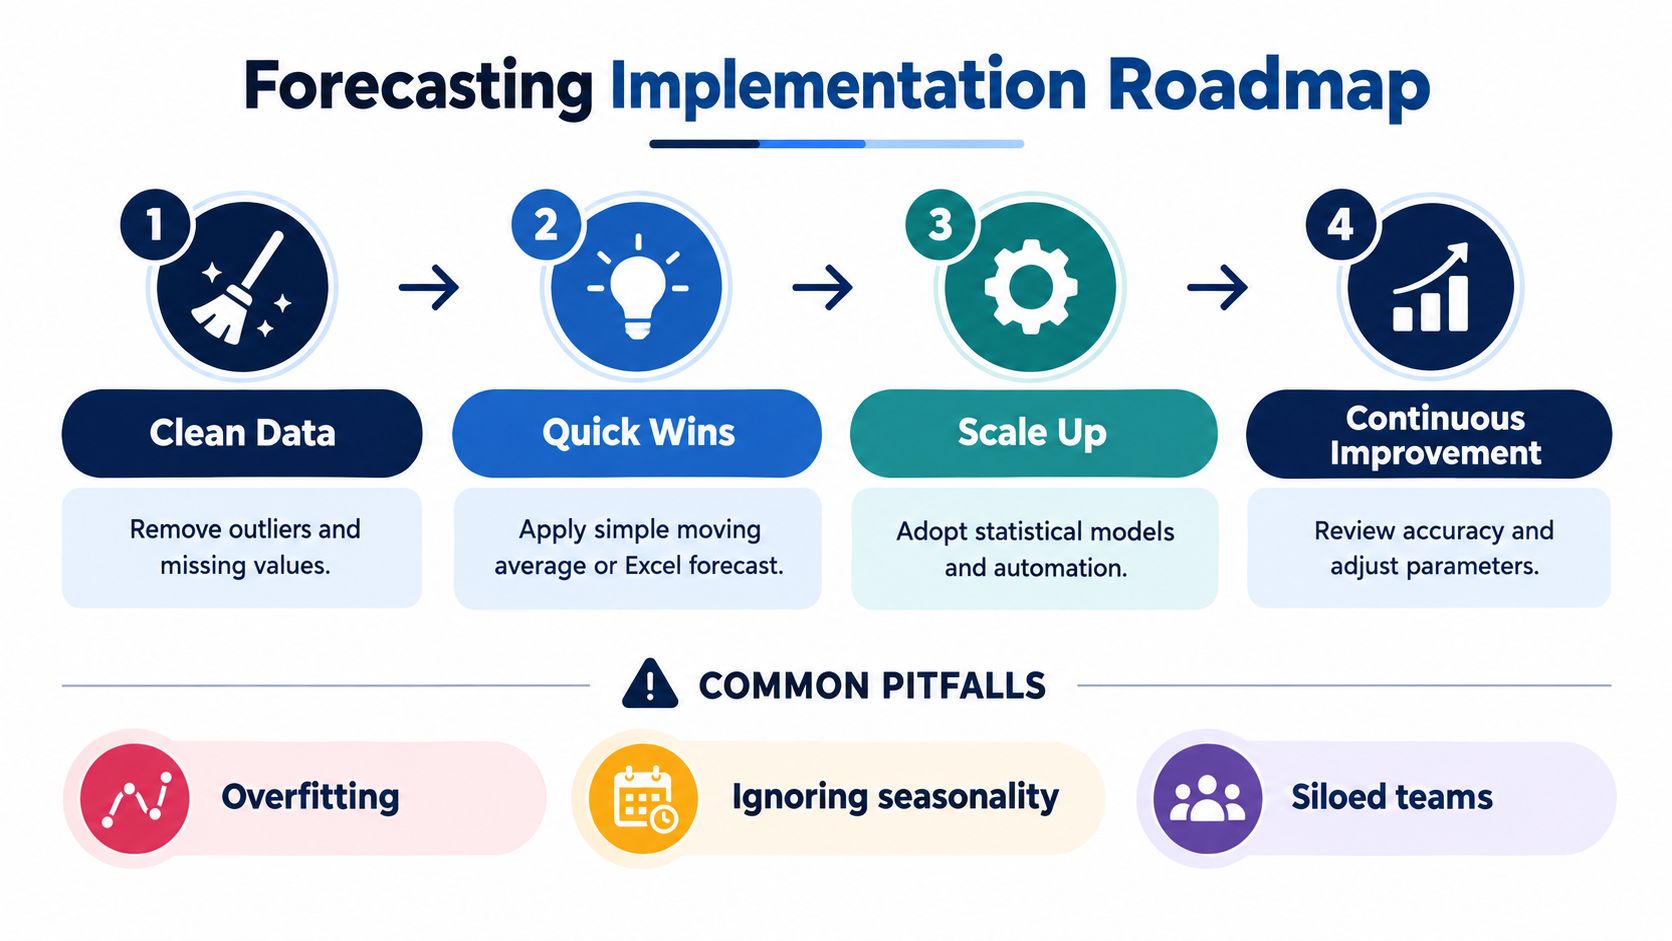
The rollout that works is usually less glamorous. Clean the history first. Tie the forecast to an actual buying rule. Then decide whether the business has earned the right to use a more advanced method.
Rebuild demand history before you forecast
Start at the SKU by channel level. Mark stockout days, isolate returns to the period they relate to, and tag major promotions, price changes, and marketplace disruptions. If a SKU was out of stock for five days, the missing sales during that window should not be treated as proof that demand disappeared.
Choose a baseline that matches team maturity
Early-stage brands usually do better with a rule-based model or a simple spreadsheet process they can inspect line by line. Growing brands with clearer seasonality and broader assortments usually benefit from a statistical baseline. Machine learning belongs later, after the team has stable data definitions, review discipline, and enough history to support it.
Connect the forecast to replenishment decisions
Every forecast should feed a concrete action. Reorder date, order quantity, supplier split, or safety stock update. If planners cannot explain how a forecast changed a PO, the process is still reporting, not operating.
Set a reforecast cadence
Ecommerce demand changes too quickly for a set-and-forget plan. Weekly reforecasting is common for fast movers and promotion-sensitive SKUs. Slower items can often run on a lighter cadence, but they still need a scheduled review when lead times shift, conversion changes, or inventory availability interrupts demand.
The expensive mistakes are usually simple.
AI can improve forecasts when the brand already has clean demand history, connected systems, and a planner who can challenge bad output. It does not fix censored data. It also does not remove the need to define how forecasts roll into MOQ constraints, lead times, and service targets.
Recent research on AI demand forecasting highlights the same operational barriers sellers run into in practice: poor data quality, fragmented systems, scaling issues, and limited interpretability, as outlined in this AI demand forecasting research review.
Million Dollar Sellers publishes content on forecasting and adjacent inventory topics for established ecommerce brands. That kind of peer discussion is often useful once a team has the basics under control and wants to compare operating approaches, not just software features.
The highest-return forecasting improvement is often correcting stockouts and other censored demand before changing the model.
Use a maturity filter instead of assuming AI is the next step.
That sequence prevents a common and costly mistake. Teams buy a model before they have fixed the demand signal it depends on.
The right forecasting approach is the one your team can trust, maintain, and turn into better replenishment decisions.
If your demand history is messy, start by correcting stockouts, returns, and event effects before shopping for smarter models. If your catalog is growing and seasonality is visible, a statistical baseline usually gives you more advantage than a founder-driven spreadsheet. If your systems are integrated and your planners already run a disciplined review process, then machine learning may be worth testing.
Ask four questions:
If the answer to any of those is no, fix that before adding complexity.
What is inventory forecasting, really? It's a capability for turning uncertain demand into better buying decisions. The model matters. The workflow matters more. Real-world demand won't behave exactly like the original plan, so the strongest teams validate assumptions, reforecast, and keep tightening the link between prediction and action.
If you're operating at a level where inventory decisions affect multiple channels, deep PO commitments, and real working-capital pressure, Million Dollar Sellers gives you access to experienced ecommerce founders who actively share how they handle forecasting, replenishment, and SKU-level trade-offs. It's a practical place to compare systems, pressure-test your process, and learn what holds up once a brand starts scaling fast.
Join the Ecom Entrepreneur Community for Vetted 7-9 Figure Ecommerce Founders
Learn MoreYou may also like:
Learn more about our special events!
Check Events



.webp)