
Chilat Doina
October 10, 2026
Most advice about ecommerce business intelligence starts with dashboards. That's backwards. At scale, the hard problem isn't seeing more numbers. It's deciding which numbers deserve action, then connecting that action to inventory, margin, cash flow, and customer demand.
A polished report can still hide a weak business. Revenue may rise while contribution margin falls, inventory sits in the wrong fulfillment node, and acquisition reports claim credit for customers who were already ready to buy. Eight-figure operators need intelligence that changes resource allocation, not another screen that summarizes yesterday.
A dashboard is useful only when someone can make a better operating decision from it. If your team checks revenue, sessions, conversion rate, and return on ad spend but can't explain which products are consuming cash or which channels create profitable repeat demand, you don't have business intelligence. You have observation.
The scale of ecommerce makes that distinction urgent. The U.S. Census Bureau reported $300.2 billion in seasonally adjusted U.S. retail ecommerce sales for the first quarter of 2025, up 6.1% from the same quarter a year earlier. Digital demand is too large and volatile to manage through disconnected marketplace exports, delayed finance reports, and spreadsheet tabs owned by different departments.
Revenue tells you what happened. It doesn't tell you whether growth improved the business.
An operator needs to connect sales to landed cost, marketplace fees, refunds, fulfillment expense, advertising cost, payment processing, working-capital timing, and inventory exposure. The relevant question isn't “Which channel sold the most?” It's “Which channel produced contribution after all variable costs, and what will happen to cash if we fund its next growth step?”
That changes the dashboard hierarchy:
Practical rule: If a metric doesn't trigger a decision, demote it from the executive view.
Spreadsheets fail here for structural reasons. They preserve local calculations, not shared definitions. One team may classify a return when the order is refunded, another when inventory is received, and finance may recognize it during reconciliation. A central model with documented definitions creates a common operating language.
A useful ecommerce analytics operating model should therefore connect commercial records to decisions such as reorder timing, channel budget allocation, assortment changes, and customer retention priorities. BI is not a reporting layer placed above the business. It's the control system that helps management decide where the next dollar, unit, and hour should go.
The first architectural mistake is treating every source as a marketing source. Ecommerce BI starts with commercial truth, then adds behavioral and channel context.
The EU's official statistical framework defines business-intelligence software as technology that analyzes data from warehouses, internal systems, and external sources, then presents findings through reports, dashboards, charts, or maps for decision-making and strategic planning. It also separates transaction analytics, such as sales and payment records, from customer analytics, such as purchasing behavior, preferences, reviews, and searches. That distinction is useful because the two streams answer different questions.
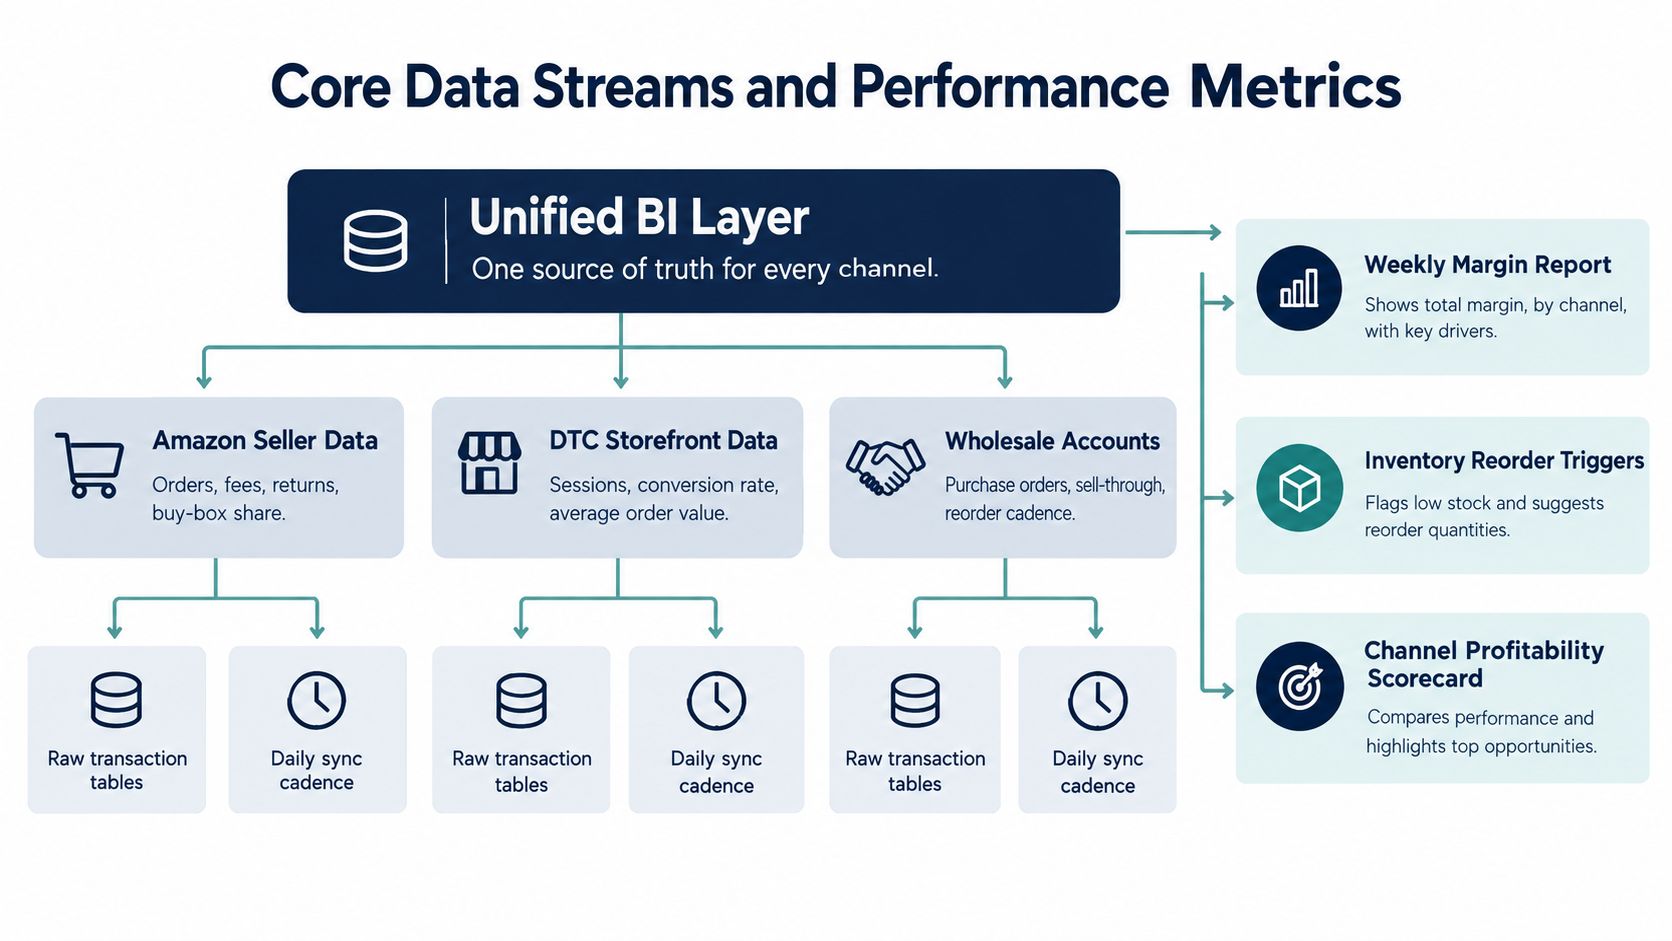
Your warehouse should preserve raw records before transforming them into reporting tables. That gives analysts a traceable path from a dashboard number back to an order, payment, return, fee, or adjustment.
| Data stream | Core records | Decisions it should support |
|---|---|---|
| Marketplace transactions | Orders, fees, refunds, returns, settlements | Assortment, pricing, marketplace margin |
| DTC transactions | Orders, payments, discounts, fulfillment, cancellations | Contribution, promotion design, cash timing |
| Wholesale activity | Purchase orders, invoices, sell-through, reorders | Production planning and account profitability |
| Inventory operations | Receipts, transfers, available stock, reservations | Replenishment and fulfillment allocation |
| Customer behavior | Purchases, preferences, reviews, searches | Segmentation, retention, product development |
| Marketing activity | Spend, impressions, clicks, landing pages, assisted paths | Budget allocation and incrementality testing |
Don't collapse these into one “revenue” table and call it a unified view. Maintain grain explicitly. An order line, a shipment, a customer, a settlement, and an advertising interaction aren't interchangeable records. Joining them without clear keys creates duplicated revenue, distorted customer counts, and unreliable margin.
A mature model produces operational outputs on a predictable cadence:
Data quality needs ownership. Assign a person to investigate settlement mismatches, missing cost fields, broken product identifiers, and late feeds. If nobody owns exceptions, the warehouse becomes a more impressive version of the same spreadsheet problem.
For teams connecting many operational systems, a resource on how to automate support with Can I Help can help clarify where workflow automation belongs. Automation should handle repeatable handoffs, not conceal unresolved definitions. A fast pipeline that moves incorrect data faster still produces bad decisions.
One aggregate growth rate applied across a large catalog is not a forecast. It's a convenient assumption with a purchase order attached.
Demand behaves differently by SKU. A stable replenishment item may have repeatable seasonality and enough history for a statistical model. A product affected by price changes, promotions, traffic shifts, channel launches, and competitor activity needs richer features. A low-volume item may not justify an expensive model at all.
A systematic review of 72 studies found that traditional models such as ARIMA remain relevant for stable demand, while machine-learning methods are more adaptable to high-dimensional catalogs and unpredictable promotional effects. The operational lesson is simple: choose the model based on the decision and the demand pattern, not on the novelty of the algorithm.
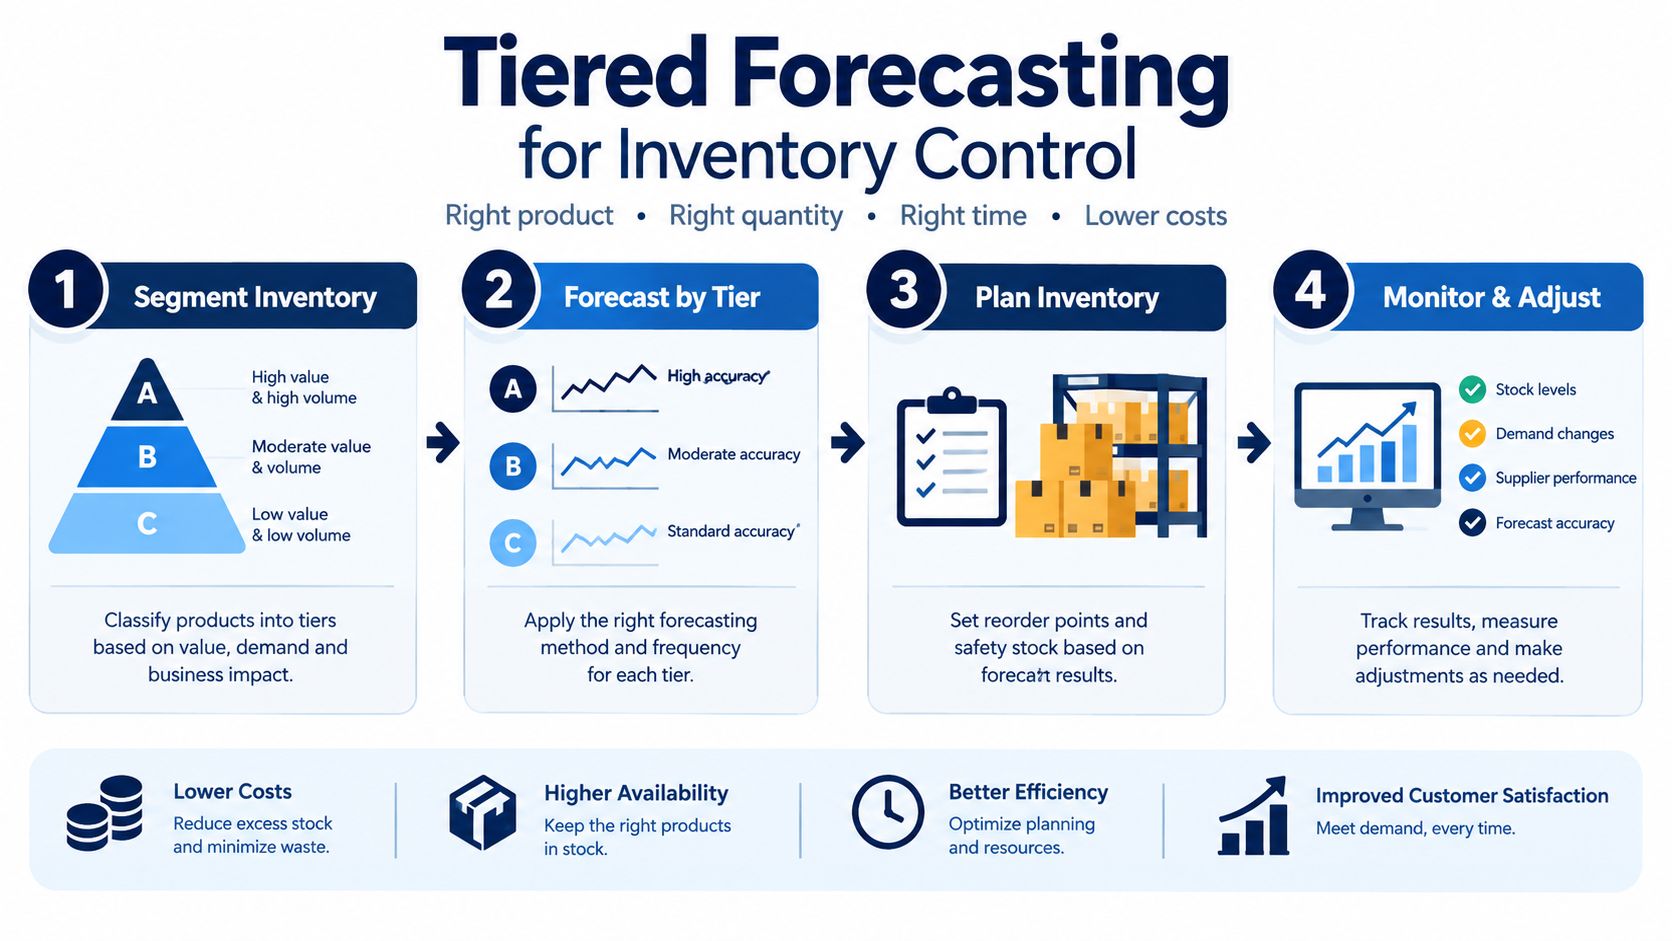
A practical tiering approach looks like this:
Validate forecasts with rolling, time-ordered tests. Randomly splitting historical data allows future conditions to leak into the training set, which makes model performance look better than it will be in operation. Always compare candidate models with a naive seasonal baseline.
Forecast accuracy is a means. The financial objective is healthier availability with less cash trapped in stock.
Track forecast bias, MAPE, stockout rate, inventory days, safety-stock exposure, and contribution margin together. The peer-reviewed local ecommerce forecasting study cited in the research found SARIMA with MAPE of 10.09, compared with 15.23 for AR and 14.47 for nonseasonal ARIMA, while also reporting SARIMA mean absolute error of 13.91 and root mean squared error of 16.34. Those figures support model comparison, but they don't mean the model should be deployed unchanged across every catalog.
A lower error score can still produce an inferior business outcome if the model encourages excessive safety stock. Measure expected lost contribution from a stockout against the carrying cost and markdown risk of additional inventory. Re-estimate after major promotions, price changes, listing changes, or channel expansion because the relationships learned from older demand may no longer hold.
For a broader explanation of what inventory forecasting involves, focus on the link between the forecast and the replenishment decision. A forecast that never changes purchase timing is an analytics exercise, not inventory control.
This practical overview of forecast workflows can also be useful:
Last-touch attribution assumes the final measurable interaction explains the purchase. AI-assisted shopping weakens that assumption because discovery, comparison, recommendation, and referral can happen inside an intermediary that doesn't expose the same tracking signals as a paid-media platform.
Recent global retail research found that 37% of consumers use AI to help complete shopping. That creates a measurement problem for Amazon sellers, DTC brands, and omnichannel operators that still judge acquisition through sessions, paid clicks, conversion rate, and last-touch revenue alone.
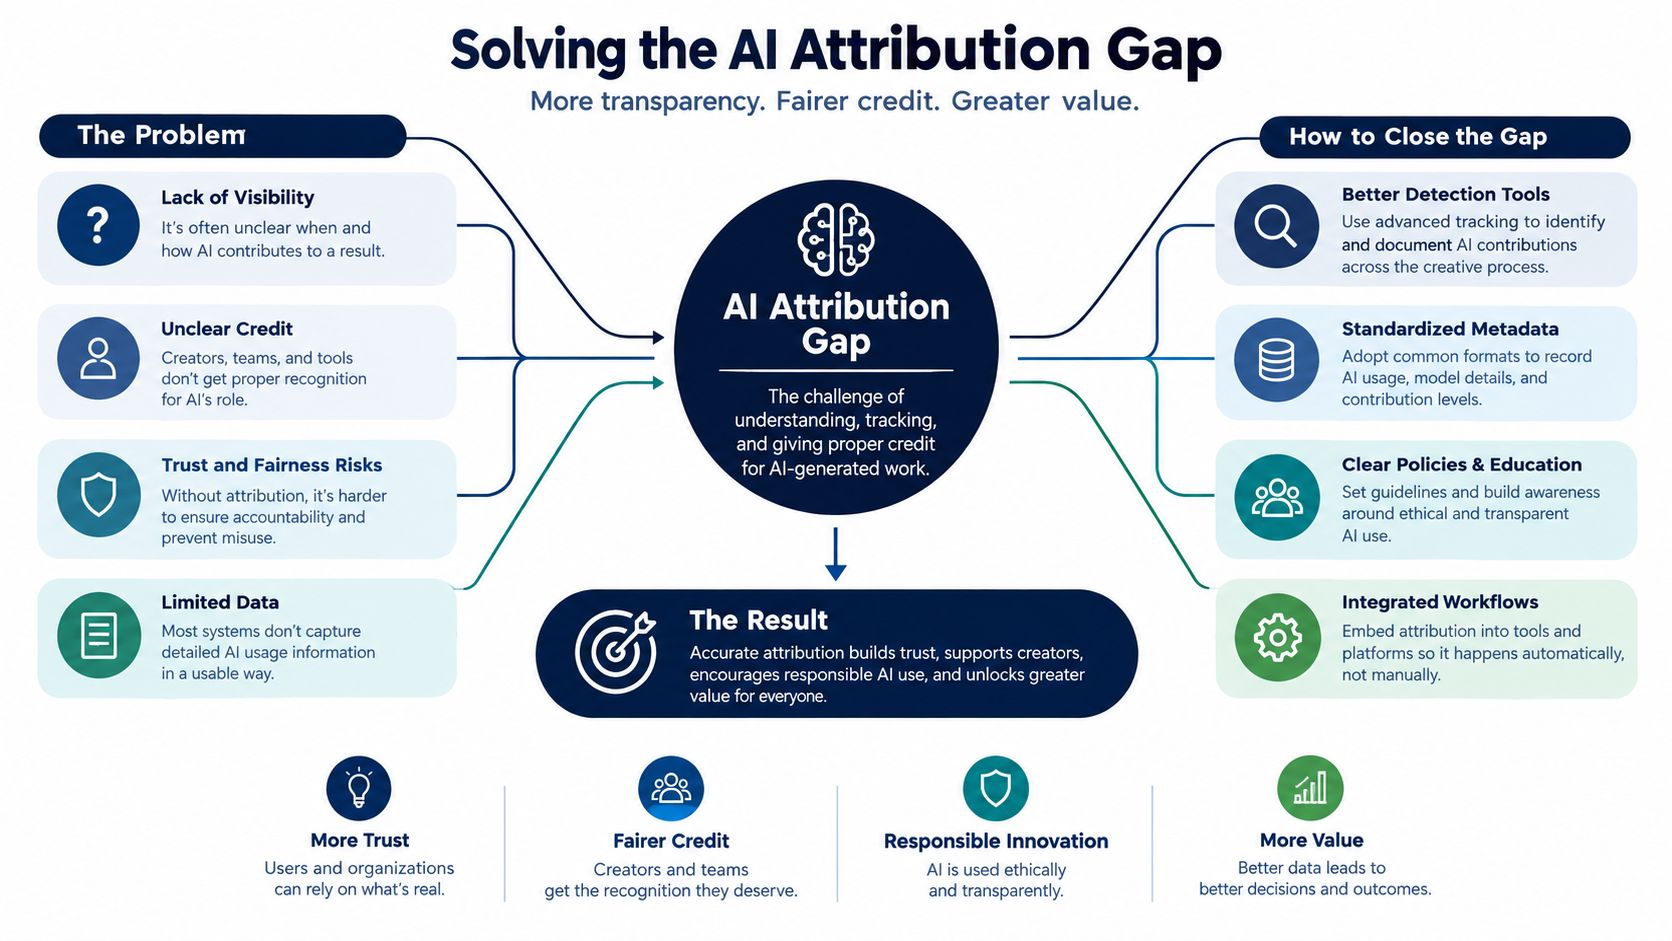
A referral from an AI assistant can mean several different things. It may introduce a new customer, redirect a customer who had already chosen your brand, or provide the final step in a journey that began through an unmeasured recommendation. A higher conversion rate from that source doesn't prove that the source created the demand.
Use a measurement stack with several layers:
The right question is not “Did AI get credit?” It's “Did exposure create profitable demand that wouldn't otherwise have appeared?”
A useful guide to retail media attribution can help teams think beyond a single conversion event. The same discipline applies here: define the incrementality question before selecting the reporting window or dashboard view.
Measurement discipline: Treat AI traffic as a hypothesis to validate, not as a superior channel by default.
Attribution is weakest when the customer journey is least observable. That's where controlled tests become more valuable than another set of modeled touchpoints.
Hold out a comparable geography, change AI-facing content or availability in a defined market, and monitor branded demand, new-to-brand sales, margin, and repeat purchase. If marketplace customer data is limited, combine marketplace outcomes with DTC indicators and broader demand signals. The result won't create perfect identity resolution, but it can distinguish reclassification from genuine lift more effectively than last-touch reporting.
Privacy governance changes the quality of your commercial decisions. It affects which customers enter a cohort, how long their records remain usable, whether identities resolve across devices and channels, and how confidently a model can generalize from observed behavior.
Consumer trust is materially weaker than consumer expectation. Adobe's retail research reports that 87% of consumers expect retailers to handle personal data responsibly and securely, while only 46% believe brands do so. The same source describes checkout testing in which consent-collection design affected marketing-consent rates and revenue. Consent isn't only a compliance field. It can influence the data available for retention, personalization, and measurement.
A customer warehouse that contains only consented profiles can look precise while representing a biased slice of the business. Customers who consent may differ from those who don't by device, market, purchase intent, age, channel, or product category. If analysts treat the consented group as the whole customer base, cohort value and retention estimates can become overconfident.
Add data-completeness fields to the KPI layer:
Don't bury these fields in a governance document. Put them beside the metric. A retention report based on partial identity coverage should display that limitation next to its customer lifetime value estimate.
Consent collection needs a careful balance. A frictionless experience can improve completion, while aggressive requests can reduce trust or create low-quality permissions. The right design depends on the purpose, market, device, and customer relationship, so teams should test the journey within applicable legal requirements rather than copy a pattern from another storefront.
Finance should see revenue and margin by consent state where measurement is lawful and appropriate. Marketing should know which audiences are modeled rather than directly activated. Data teams should enforce deletion, access, retention, and purpose controls in the warehouse and downstream tools.
The profitable approach is not collecting everything. It's knowing what you can use, how reliable it is, and what decisions become unsafe when coverage is uneven.
Centralizing data doesn't require replacing every system at once. It requires choosing an order of operations that improves decision quality without interrupting fulfillment, customer service, or finance close.
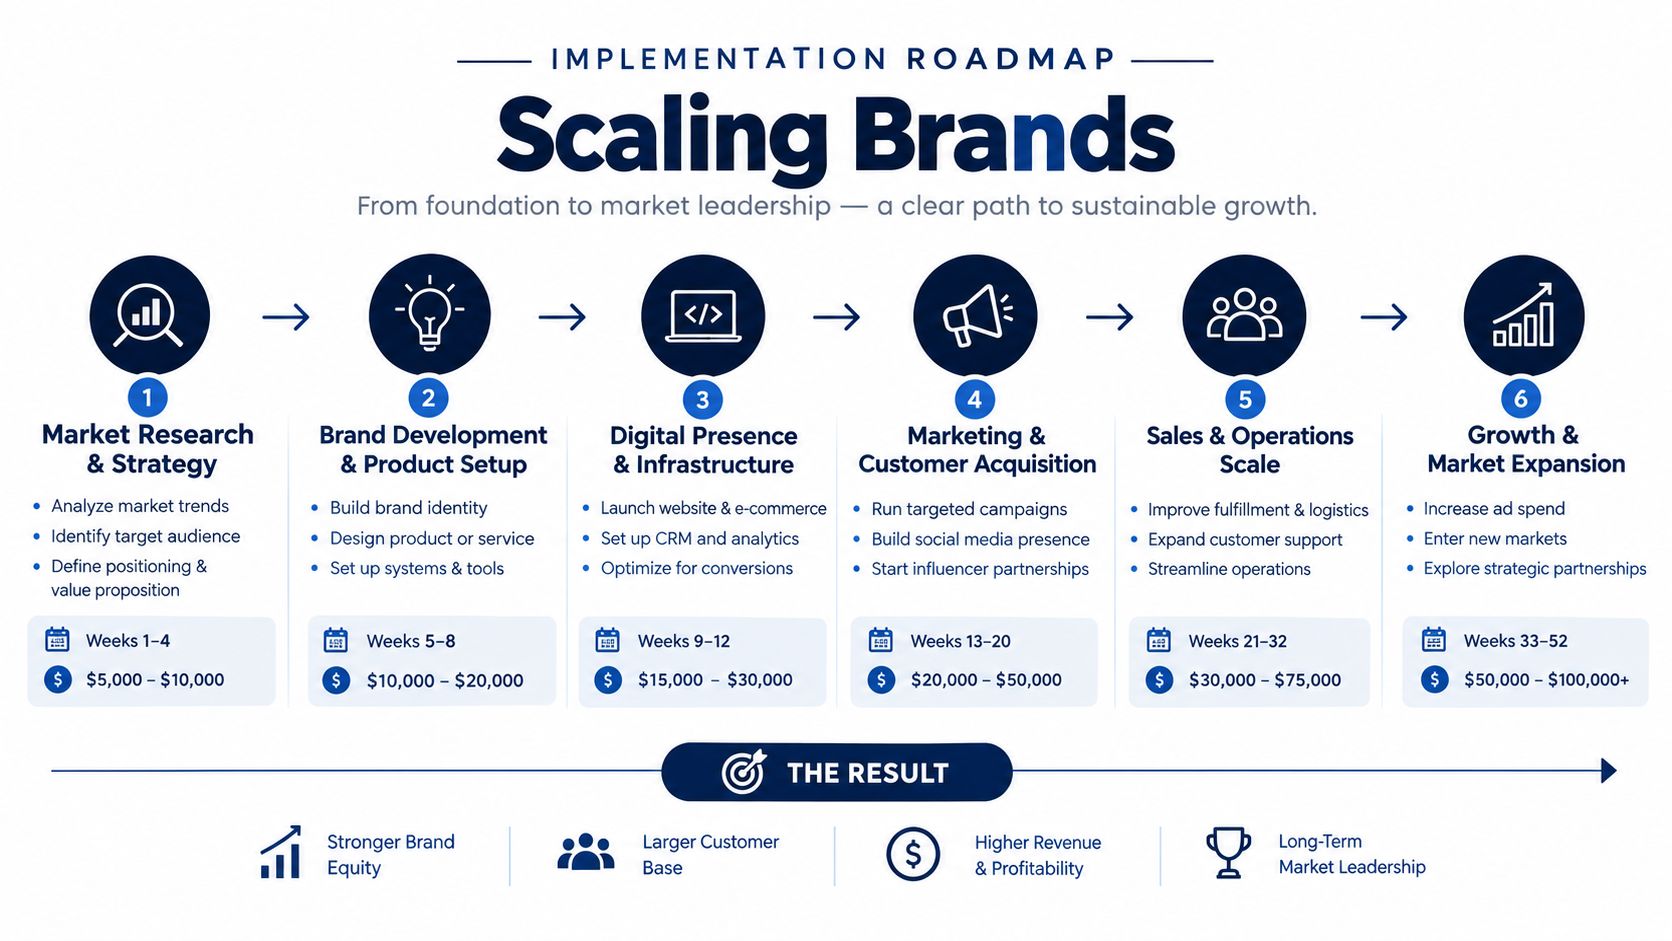
Begin with a data audit. List every system that creates or changes an order, payment, return, inventory balance, customer record, cost, and settlement. Document the owner, refresh cadence, identifier, historical coverage, and known failure modes.
Then build in phases:
Assign role-based access by business need. Purchasing may need SKU demand and inventory exposure, while marketing may need consented audience fields without access to unnecessary payment details. Establish deletion and retention workflows before the warehouse becomes difficult to unwind.
Use monitoring that catches missing feeds, sudden volume changes, duplicate records, stale costs, and unexplained margin shifts. A daily sync that fails without warning is worse than a slower process that clearly reports its status.
Keep a manual fallback during rollout. If a pipeline breaks during a major sales period, operators still need a controlled way to make buying and fulfillment decisions. Reliability earns adoption faster than feature breadth.
Business intelligence pays off when it changes operating decisions under real constraints. The signal is not how many dashboards exist. The signal is tighter cash control, fewer avoidable errors, cleaner margin visibility, and less operator time wasted stitching exports together.
Start with the bottleneck that is hurting profit. If inventory is tying up cash, review forecast bias, stockout risk, inventory days, replenishment timing, and contribution margin together. If channel growth turns into endless debate, inspect channel definitions, settlement reconciliation, customer identity coverage, and whether incrementality testing is good enough to separate reported performance from causal lift. If the team still spends hours merging files, track the drop in manual prep and how quickly someone can move from signal to action.
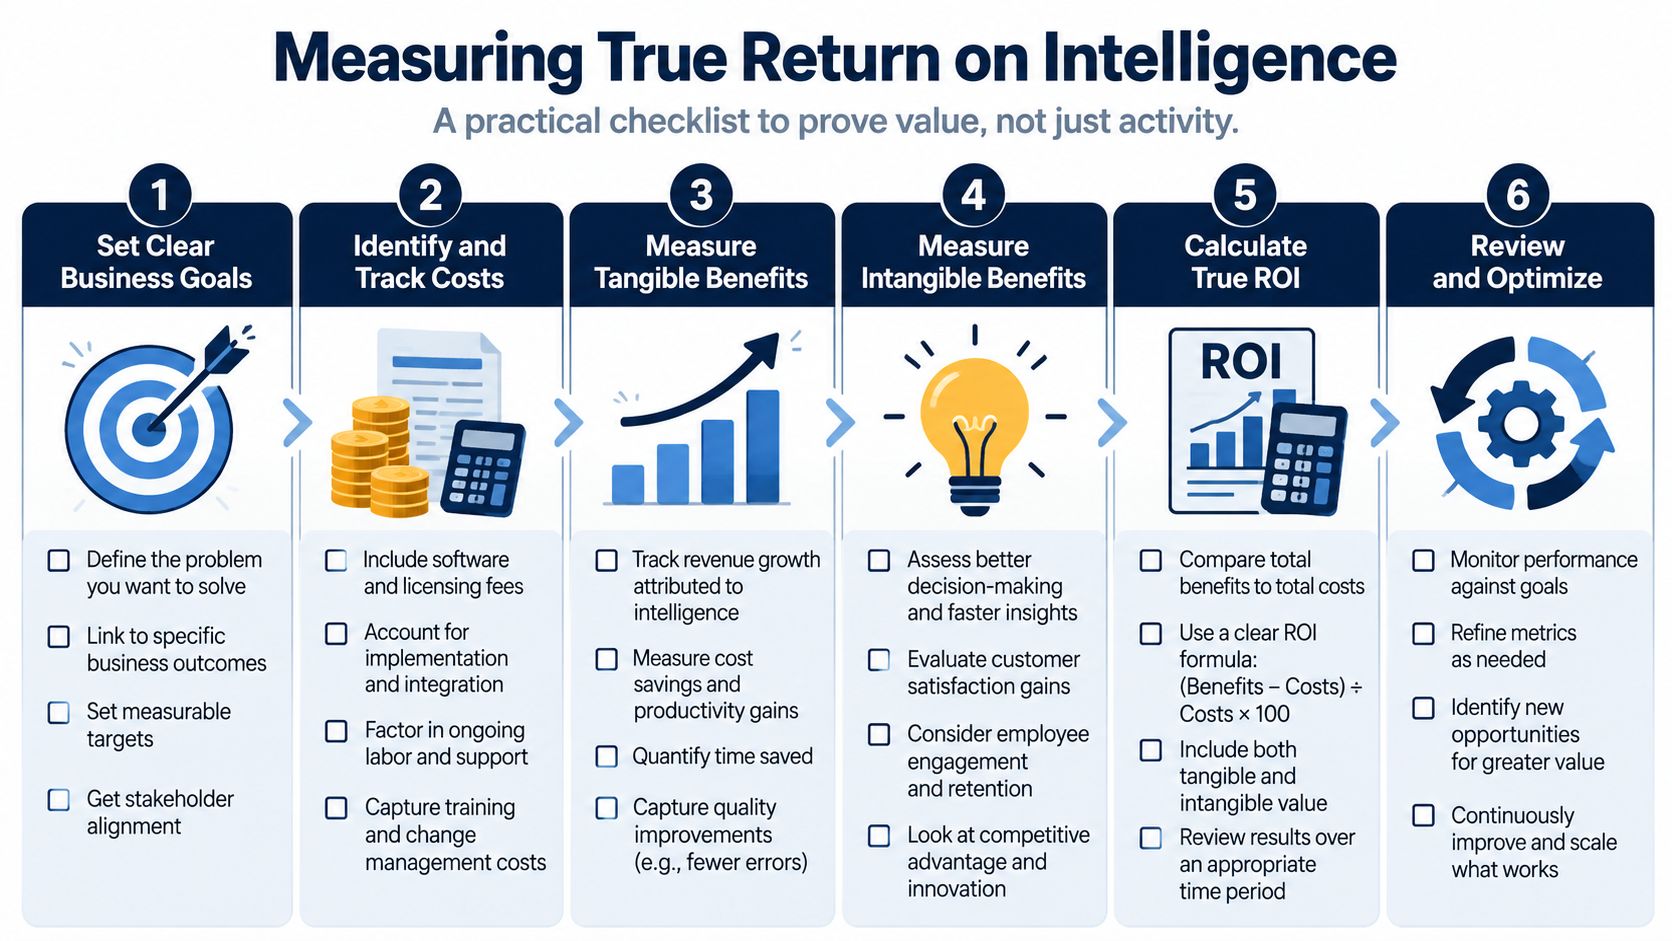
The clearest proof shows up in the weekly rhythm of the business, especially when conditions are messy.
One more test matters. Can the business keep operating when the data is imperfect? Strong intelligence systems do not remove uncertainty. They expose it early enough for finance, marketing, and operations to make controlled decisions before mistakes get expensive.
A capable ecommerce virtual assistant can help with recurring catalog checks, report preparation, and operational follow-up when those tasks are documented and governed. That role supports a defined process. It should not be a patch for broken source data or vague metric definitions.
Million Dollar Sellers is a peer community where ecommerce operators share SOPs, workshops, and strategy discussions across Amazon, DTC, and omnichannel businesses. For founders assessing BI spend, those conversations are useful because they tie infrastructure choices back to margin, cash flow, and execution, not vanity reporting.
Treat ecommerce business intelligence as an operating capability. Fund the definitions, governance, forecasting, experimentation, and ownership needed to keep decision quality high as the brand scales. That is where the genuine return shows up.
Join the Ecom Entrepreneur Community for Vetted 7-9 Figure Ecommerce Founders
Learn MoreYou may also like:
Learn more about our special events!
Check Events