
Chilat Doina
August 25, 2026
Retailer-reported ROAS is not the truth. It's a claim made by a platform with a financial interest in receiving more of your budget.
That doesn't make the number useless. It makes the number incomplete. Retail media attribution can tell you which interaction received credit inside a retailer's ecosystem, but it often can't tell you whether the purchase would have happened anyway, whether another retailer benefited, or whether the shopper eventually bought in a physical store.
Those gaps create measurement theater, where polished dashboards support confident decisions without measuring the business outcome you care about. The brands that outperform don't abandon attribution. They use it as an optimization layer, then validate major budget decisions with cross-retailer data, offline signals, and controlled incrementality tests.
Most founders treat the retailer dashboard as ground truth because it has precise-looking numbers, daily updates, and a direct connection to reported sales. That confidence is misplaced. A retailer's dashboard is designed to explain the value of its media inventory inside its own commerce environment, not to measure the total impact of your brand across every channel.
Retail media attribution has a long history of trying to assign credit across multiple marketing exposures. Its roots reach back to the 1950s, followed by probabilistic marketing mix modeling in the 1980s and 1990s, then first-touch, last-touch, and multi-touch models as internet browsing data became available. That evolution matters because today's systems still answer a difficult question, which exposure deserves credit for a purchase? (Incremental's history of retail marketing attribution)
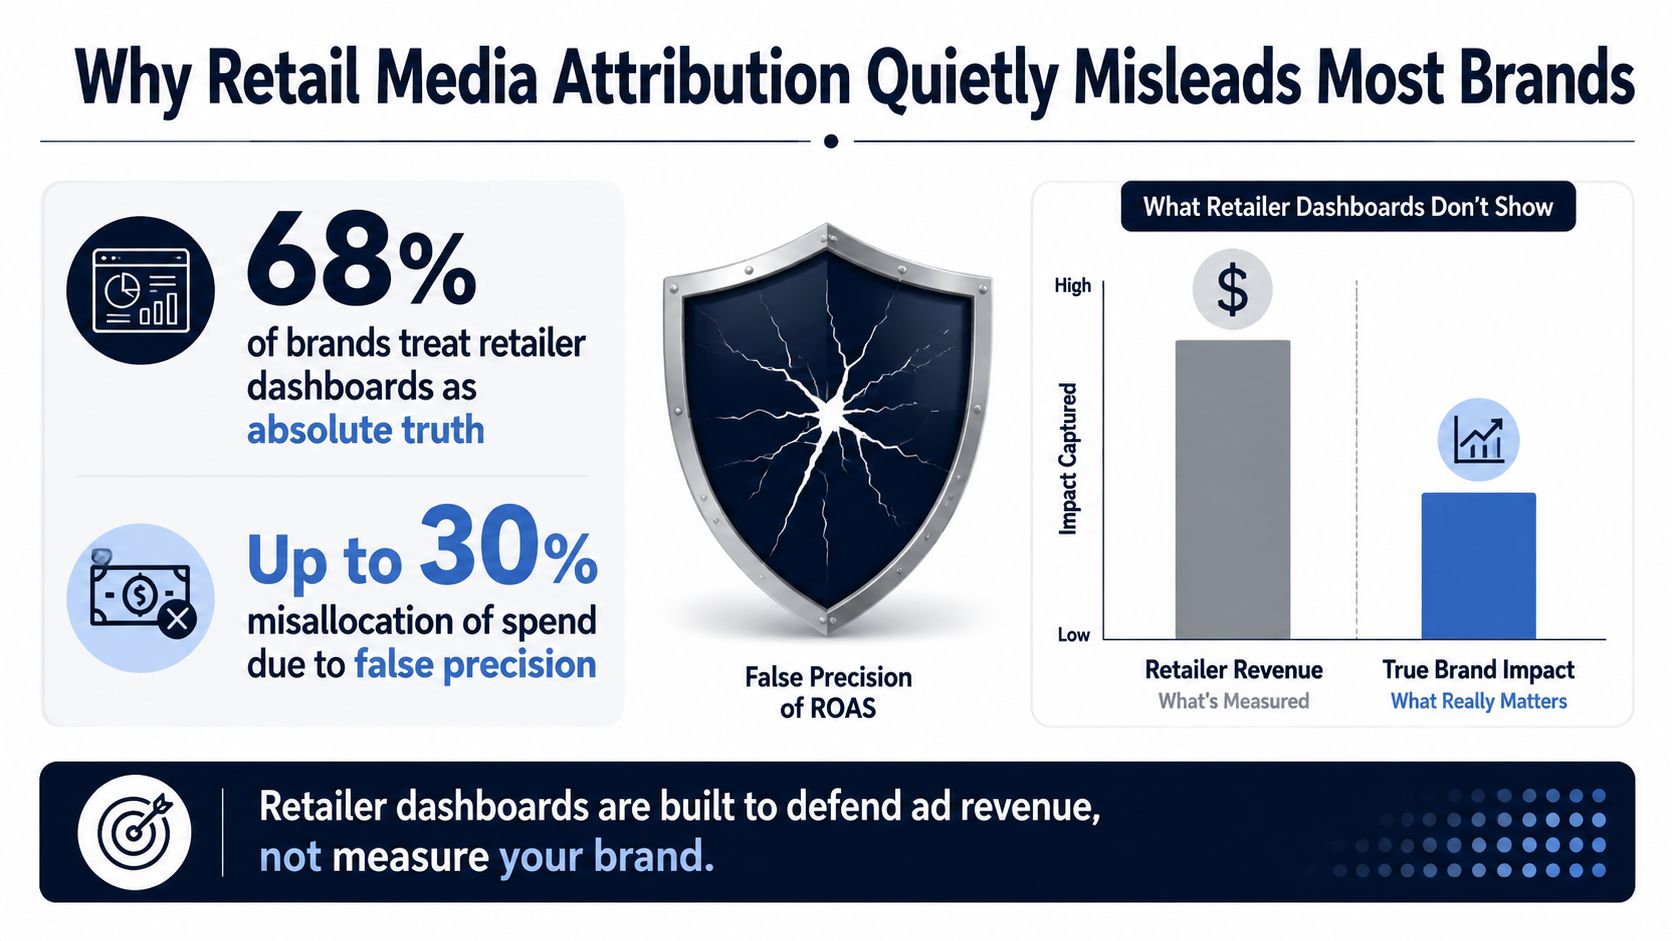
The first blind spot is cross-retailer substitution. A shopper can see a sponsored ad on Walmart, compare the product elsewhere, and purchase from Target. Walmart's reporting may still receive credit for an interaction that influenced demand, but it won't show the complete journey. Conversely, a Walmart conversion can absorb credit for a sale that would have occurred at another retailer without the ad.
The second blind spot is offline conversion. Retailer-native systems often observe clicks and online orders while missing purchases made in stores, through unlinked curbside transactions, or without an identifiable loyalty connection. That's particularly damaging for grocery and household brands, where digital exposure and physical purchase frequently happen in different places.
Operator rule: Treat retailer ROAS as a delivery diagnostic. Don't use it as the sole basis for reallocating budget.
Before trusting any attribution pipeline, audit its completeness, consistency, and timeliness. A practical enterprise data quality metrics guide can help teams formalize those checks instead of relying on attractive dashboards. For broader context on how retail media fits into a brand's channel mix, review this overview of retail media advertising.
Retail media is expanding rapidly, which makes weak measurement more expensive. Nielsen projected that worldwide retail media ad spending would rise by nearly $100 billion between 2020 and 2025, with 2025 growth projected at 21.8%, faster than nearly all other forms of ad spending. (Nielsen on independent retail media measurement) More money flowing through disconnected systems means more opportunity for networks to report credit that brands can't reconcile.
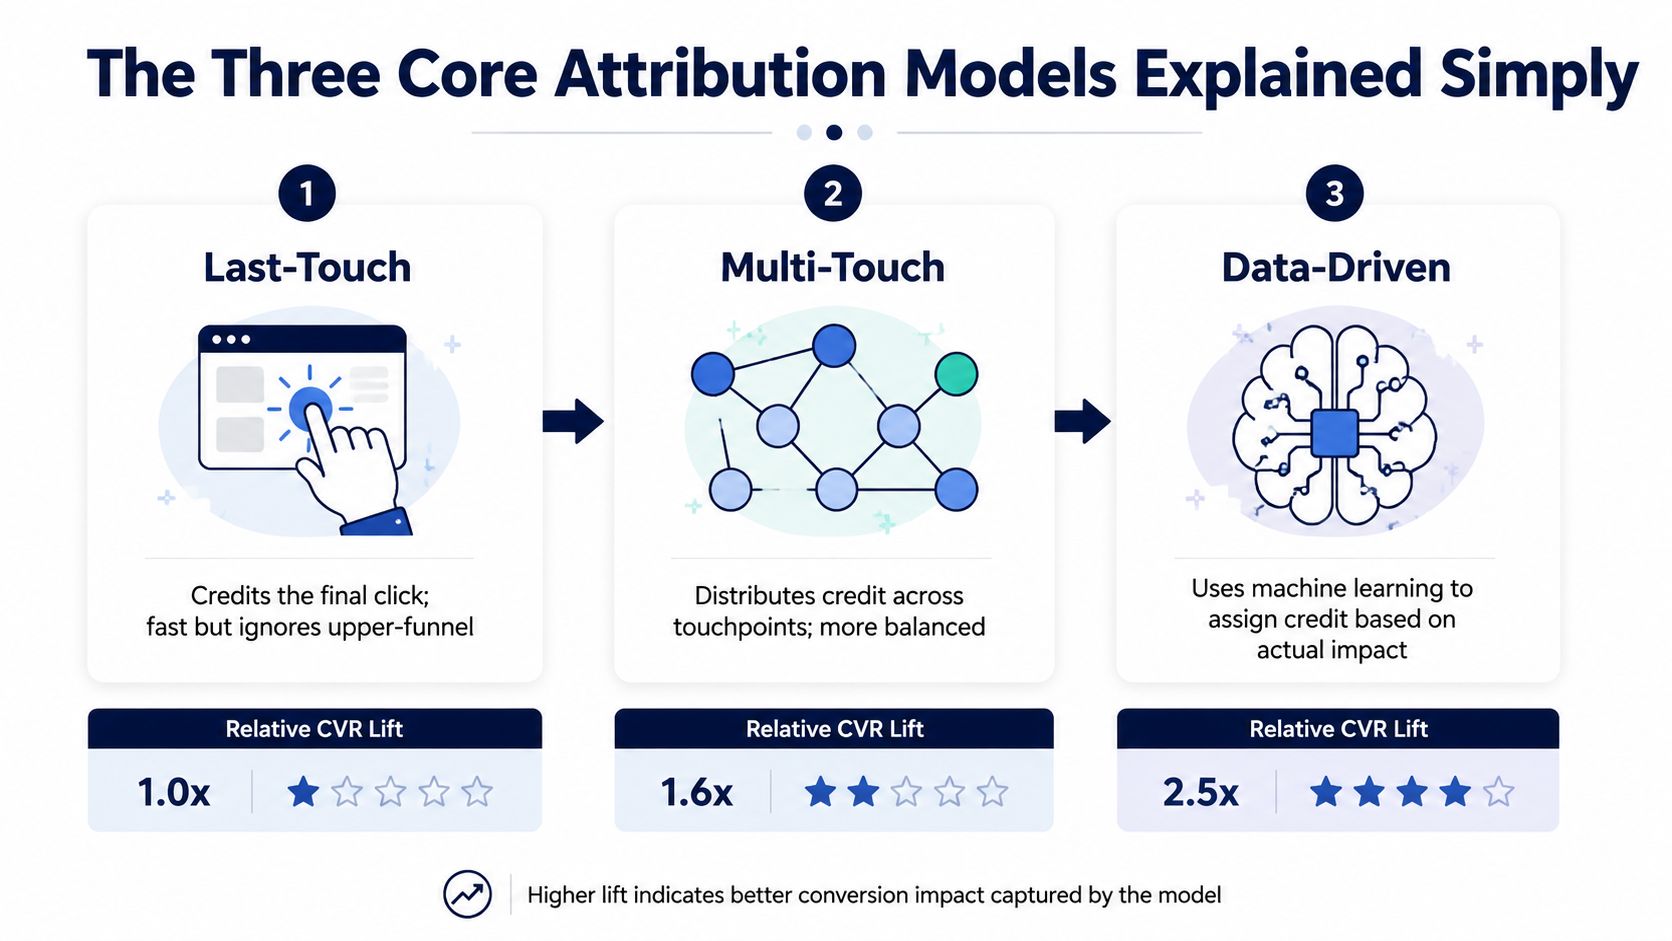
Attribution models function as progressively better lenses, while each leaves something important outside the frame. Choose the model based on the decision it must support, not on how advanced its dashboard appears.
A shopper sees a sponsored display ad for your cereal brand, encounters a retargeting ad for a related product, then clicks a sponsored search ad before buying. Last-touch attribution gives the search ad all the credit.
That approach is fast, easy to explain, and useful for checking whether campaigns generate tracked conversions. It systematically favors lower-funnel activity. The display exposure may have created awareness, while the retargeting ad may have brought the product back into consideration, yet neither receives credit for the final purchase.
First-touch attribution carries the opposite bias. It credits the interaction that introduced the shopper to the brand, which helps evaluate discovery while overlooking the work done later to convert demand. Use it as a discovery diagnostic, not as a complete account of performance.
Multi-touch models distribute credit across the shopper journey. A linear model gives each interaction an equal share. A time-decay model assigns more weight to exposures closer to conversion. A position-based model emphasizes selected points, often the first and last interactions.
Rules-based multi-touch works as a compromise between extremes. It can show how known touchpoints participate in a path, but its weighting reflects chosen assumptions rather than proven causality. Document those rules, because changing them can change the reported winner without changing campaign performance.
More advanced data-driven models use observed paths and statistical or algorithmic methods to estimate how touchpoints contribute. The benefit is a fuller account of the shopper's journey. The cost is substantial: reliable identity resolution, consistent event data, comparable attribution windows, and enough conversion volume to support the analysis.
This attribution guide for DTC brands provides useful background on how weighting approaches change the story told by a conversion path.
Incrementality asks the question attribution cannot answer: would the shopper have purchased without the ad?
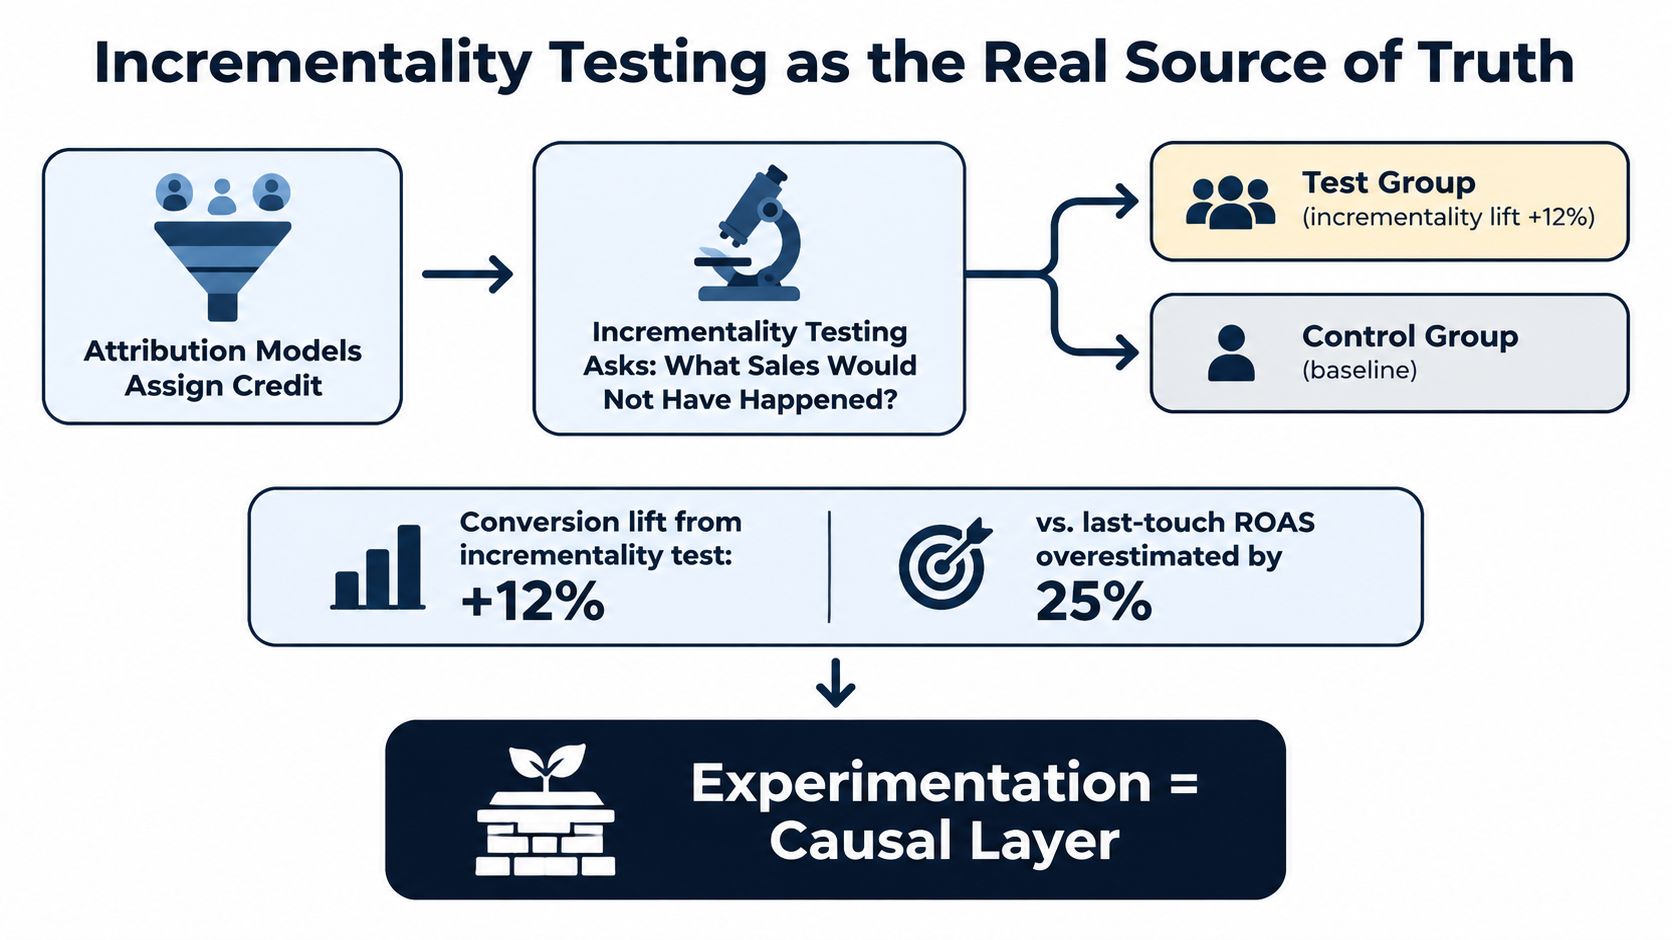
A controlled holdout separates eligible shoppers into an exposed group and a control group. The difference in outcomes estimates the causal effect of advertising. Incrementality therefore serves as the validation layer, rather than another method for distributing credit. (NielsenIQ on retail media incrementality) Industry guidance warns that last-touch and multi-touch models can explain how a purchase happened without explaining why it happened, allowing attributed ROAS to include baseline sales that would have occurred anyway.
Use last-touch for execution checks, multi-touch for journey analysis, and incrementality for budget decisions. One model should not be asked to perform all three jobs.
Sophistication is not the same as usefulness. A model earns its place only when it improves a decision enough to justify its cost, data requirements, and operating burden.
| Model | Core Use Case | Blind Spot | Best Fit For |
|---|---|---|---|
| Last-touch | Fast campaign and keyword diagnostics | Over-credits the final interaction and misses assistive demand creation | Early-stage teams that need basic delivery visibility |
| Rules-based multi-touch | Balanced journey reporting across known touchpoints | Weighting reflects assumptions rather than proven causality | Growing brands with cleaner event data and several active formats |
| Data-driven multi-touch | Estimating touchpoint contribution from observed paths | Sensitive to identity gaps, missing channels, and biased conversion data | Mature brands with strong first-party data infrastructure |
| Incrementality testing | Measuring sales caused by advertising | Requires test design, controls, adequate data, and operational discipline | Brands making material budget decisions across multiple channels |
A brand with limited retail media investment should not start with an expensive data-driven system or a full marketing mix modeling program. Rules-based multi-touch provides a workable middle layer when the team documents attribution windows, event definitions, and known exclusions.
A balanced scorecard compromises between extremes. Use last-touch for quick execution checks, multi-touch for journey analysis, and incrementality for budget decisions. Assigning every job to one model creates measurement theater, not clarity.
Seven- and eight-figure brands operating across three or more retailers have a different obligation. Layer controlled tests onto multi-touch reporting. Multi-touch helps optimize campaigns within the data available. Incrementality tests whether those optimizations created additional business value.
Budgeting standard: Last-touch can tell you what closed. It cannot tell you what deserves the next dollar.
The practical trigger for upgrading is operational complexity, not a particular revenue threshold. If your team compares several retailer dashboards, runs onsite and offsite media, sells through physical stores, or receives incompatible ROAS reports for the same period, the model has become a reporting constraint. Siloed retailer reports and missing offline sales will drain confidence from every budget decision.
A shopper's journey rarely respects retailer boundaries. She may discover a product on Amazon, compare availability at Walmart, see a social ad, and purchase at Target. The retailer recording the order gets the cleanest signal, but that signal reflects only part of the journey.
That creates structural bias. Each network reports the interactions it can observe, then presents its attributed ROAS beside another network's number as though the two were comparable. They are not automatically comparable. Impression counts can use different attribution windows, customer identifiers may fail to match, and the final retailer can claim the conversion without demonstrating that it created the demand.
Independent analysis of more than 150,000 campaigns estimated that siloed attribution missed 36% to 53% of total retail media impact, with the missed share rising to 67% to 80% for off-site video. (PPC Land's analysis of siloed retail media measurement) The figures will not match every brand's situation. They do establish the operating risk: a single-retailer report is not a complete brand ledger.
Start with an event taxonomy that each partner can map to:
Normalize attribution windows before comparing networks. Then deduplicate marketplace order IDs, loyalty identifiers, hashed emails, and household keys wherever privacy rules and platform permissions allow.
| Signal | Single-Retailer Attribution | Cross-Retailer Measurement |
|---|---|---|
| Conversion | Credits purchases inside the reporting retailer | Connects outcomes across retailer and brand sales sources |
| Reach | Counts identifiable exposure within one network | Estimates overlapping and incremental reach across networks |
| ROAS | Reflects platform-defined attributed revenue | Compares spend with incremental revenue or profit |
| Customer value | Often reports retailer-specific customer status | Evaluates new, repeat, and retained customers across channels |
| Offline sales | Usually limited or absent | Incorporates matched receipts, loyalty outcomes, or controlled lift |
Cross-retailer reporting is an identity, governance, and incentive problem, not merely a dashboard exercise. Your brand needs an independent order or customer source to challenge retailer-reported totals. It also needs one agreed definition for a sale and a new customer.
A strong omnichannel retail strategy depends on that shared view. Judge campaigns by incremental customers and contribution profit, rather than whichever platform owns the last observable transaction. That standard exposes budget waste that siloed ROAS reporting leaves hidden.
Attribution assigns credit. Incrementality measures causation. That distinction should determine how your team uses each report.
The cleanest design is a randomized holdout. Define an eligible audience, randomly withhold advertising from the control group, keep other commercial conditions as stable as possible, and compare purchases between exposed and control groups. Count the outcomes that occurred during the test window, not only conversions that the retailer assigned to an ad.
That sounds simple, but execution matters. The test design must specify eligibility, assignment, actual treatment exposure, conversion windows, exclusions, inventory conditions, promotions, and uncertainty. If a control region has an out-of-stock problem or a local promotion that the test region doesn't share, the result is contaminated.
Use audience holdouts when a retailer can randomize exposure at the shopper or auction level. Use geo-based controls when media delivery or store operations are organized geographically. Geo tests require careful matching for distribution, inventory, local pricing, promotions, seasonality, and store closures.
Marketing mix modeling has a different role. It works at an aggregate level and should incorporate granular inputs such as DMA, format, time, impressions, clicks, audience, device, and cost. Those inputs support cross-channel analysis rather than forcing every conclusion through a retailer's native attribution window. IAB and MRC guidance specifically emphasizes collecting this level of detail for attribution and MMM. (Epsilon's guidance on measuring incrementality in retail media)
An incrementality test needs enough eligible observations and a sufficient duration to distinguish signal from ordinary fluctuation. The output should communicate uncertainty, not disguise it with a single overconfident ROAS figure. Your team should also record concurrent promotions, pricing changes, distribution shifts, competitor activity, and other media that could affect the outcome.
Causal measurement rule: If the control group isn't credible, the result isn't a budget-grade answer.
Incrementality isn't a replacement for campaign optimization. Last-touch and multi-touch reports remain useful for bids, placements, creative, and audience management. Use those models to steer execution, then use controlled experiments to decide whether the channel deserves more investment. A practical explanation of true campaign impact incrementality can help teams separate attributed outcomes from causal lift.
For teams designing tests, statistical significance is only one part of the decision. The assumptions, population definition, effect size, and business cost of the test matter too, which is why a practical guide to statistical significance belongs in the operating process.
Retail media measurement still skews toward online events, even when the commercial outcome happens in a store. A shopper can see a sponsored product ad, research the brand on a phone, and later buy at a supermarket. If that purchase isn't connected to the exposure, the retailer dashboard records no conversion and the campaign receives no credit.
This isn't a minor reporting wrinkle. It changes which formats appear effective and which audiences receive funding. A high online ROAS can accurately describe the retailer's observed online audience while still understating the total business impact of the media.
Loyalty records, receipt data, circular exposure, point-of-sale feeds, and store-level sales can connect parts of the journey. None is perfect. Identity matching introduces coverage and consent constraints, non-loyalty purchases remain difficult to connect, and privacy requirements limit the level of individual detail a brand can use.
Privacy-safe clean rooms provide a practical direction. They allow a retailer and brand to match eligible exposure records with aggregated purchase behavior without exchanging raw personal identities. The correct output isn't a magical customer-level map. It's a documented, privacy-conscious estimate with clear match coverage and exclusions.
The IAB's in-store measurement work offers a structure for defining store exposure, purchase windows, eligible audiences, controls, and reporting requirements. Start with the data you can defend:
Measurement integrity: A dashboard is not complete because it looks closed loop.
Recent industry analysis describes offline commerce as a major gap in retailer-native reporting and points toward clean rooms and standardized in-store frameworks as the practical response. (MetaRouter on where retail media measurement stops) Brands should demand that every offline readout state what it observed, what it couldn't observe, and how the control group was formed.
Retail media attribution improves through operating discipline, not another year-long integration project. Assign owners, reconcile the core records, and require every vendor to show what its system can and cannot measure.
Create one spend ledger for Amazon Ads, Walmart Connect, Instacart, Criteo, and every active partner. Standardize campaign names, retailers, formats, SKUs, markets, currencies, and time zones. Then match spend dates to retailer delivery and conversion dates. A report that joins Tuesday's spend to Wednesday's orders without documenting the timing rule is already producing noise.
Set a source-of-truth hierarchy. Retailer reports should own delivery facts, the commerce system should own orders, and finance should own contribution profit. Write those rules into the measurement brief, including who approves corrections when two systems disagree.
Set up permitted customer-match workflows and privacy-safe clean-room connections for exposure and purchase analysis. Export event-level conversion data through available integrations, including Amazon Marketing Stream and Walmart APIs where the account and use case support access.
The central deliverable is a reconciled table, not a more polished dashboard. Include columns for campaign exposure, retailer of record, SKU, customer status, overlapping retailer or media exposure, observed sales, unobserved sales, and reconciliation status. Add an owner and a reason code for every unresolved row. That structure turns disputes into work items instead of arguments about whose ROAS is correct.
Match the test design to the decision. Run an always-on holdout for a major retail media line when the platform supports it. Use a geo split for a new launch when store conditions are stable. Prepare MMM inputs that combine retail media, off-retailer paid media, promotions, pricing, and distribution.
Evaluate vendors against the job they must perform:
By day ninety, produce a unified spend ledger, a cross-retailer reach report, and at least one causal incrementality read. Have finance sign off on the profit metric and data owners sign off on coverage. If those artifacts cannot be produced, buying more tooling only creates more measurement theater.
Make three moves this quarter.
First, demote retailer-reported ROAS. Keep it for delivery diagnostics, keyword management, placement evaluation, and troubleshooting. Stop using it as the final performance KPI for budget allocation. A retailer can report an attributed conversion without proving that its media created an additional purchase.
Second, fund one continuous holdout test on your largest retail media line. Don't wait for a perfect data warehouse or a universal identity graph. Define the eligible population, treatment and control groups, outcome window, exclusions, and profit metric. Get one causal number your leadership team can use within the quarter, then repeat the test as audience behavior, promotions, and platform algorithms change.
Third, push the top three retail partners toward clean-room measurement. Ask for comparable event definitions, consistent windows, cross-retailer reach reporting, offline coverage, and documented match rates. If a partner can show only its own attributed sales, you have a retailer report, not a brand measurement system.
The common reaction is to buy another multi-touch dashboard while underfunding experimentation. That reverses the priorities. MTA can help you optimize the journey you can observe. Incrementality tells you whether the observed journey created value. Cross-retailer and offline measurement tell you how much of the business journey your reports are missing.
Use this test for every new attribution vendor: if the output doesn't change a budget decision, it's decoration.
Million Dollar Sellers gives serious ecommerce operators access to peers who have already worked through the messy realities of Amazon, DTC, and omnichannel measurement. Visit Million Dollar Sellers to connect with an invite-only community focused on sharper decisions, trusted strategy exchange, and execution at scale.
Join the Ecom Entrepreneur Community for Vetted 7-9 Figure Ecommerce Founders
Learn MoreYou may also like:
Learn more about our special events!
Check Events