Chilat Doina
June 6, 2026
You can feel this moment when a brand outgrows founder math.
Sales are up. Ads are working. The catalog is deeper than it was a year ago. Amazon is moving volume, Shopify is steady, maybe wholesale or retail has entered the picture. On paper, the business looks stronger. But cash feels tighter, inventory decisions feel riskier, and every growth move seems to create a new operational problem somewhere else.
That's where a lot of e-commerce founders stall. They know how to launch products, drive traffic, and improve conversion. What they haven't built yet is the habit of reading the business through all three financial statements, not just the P&L. If you only track revenue and net profit, you can miss the full story until it's expensive to fix.
Most founders start with understanding business profitability, which is the right starting point. But once your brand gets real scale, the P&L stops being enough on its own. You also need to know why profit isn't turning into cash, why inventory keeps eating working capital, and why a “good month” can still leave you squeezed. A clean primer on the basics of a P&L helps too, especially if your team needs alignment on terminology, like this guide to the profit and loss statement.
A founder can have a strong month and still make a bad decision.
That happens when the P&L says the brand is profitable, but the balance sheet says inventory is bloated and the cash flow statement says operations didn't produce enough cash to support the next purchase order. In e-commerce, that gap gets wider fast because growth usually demands more ad spend, more stock, more people, and more channel complexity all at once.
The first warning sign usually isn't “we have a finance problem.” It's operational.
You notice one of these patterns:
The issue usually isn't that the P&L is wrong. It's that the P&L answers only one question.
It tells you whether the company was profitable over a period. It does not tell you whether cash got trapped in inventory, whether receivables stretched, whether debt is becoming a growth crutch, or whether equity is compounding. Those are scale questions, not accounting trivia.
Practical rule: If your revenue is rising and your stress is rising with it, stop asking only “Are we profitable?” Start asking “What is growth consuming?”
Founders who reach the next level usually stop treating financial statement analysis as back-office hygiene. They use it as an operating system for decisions on buying, pricing, ad pacing, channel mix, headcount, and financing.
Modern financial statement analysis is anchored in the income statement, balance sheet, and cash flow statement because each answers a different question: financial position, profitability over a period, and cash generation. Analysts also use horizontal analysis to compare line items across three to five years and vertical analysis to express each item as a percentage of a base figure like sales, which helps move from a snapshot to a trend view of the business (Financial Edge).
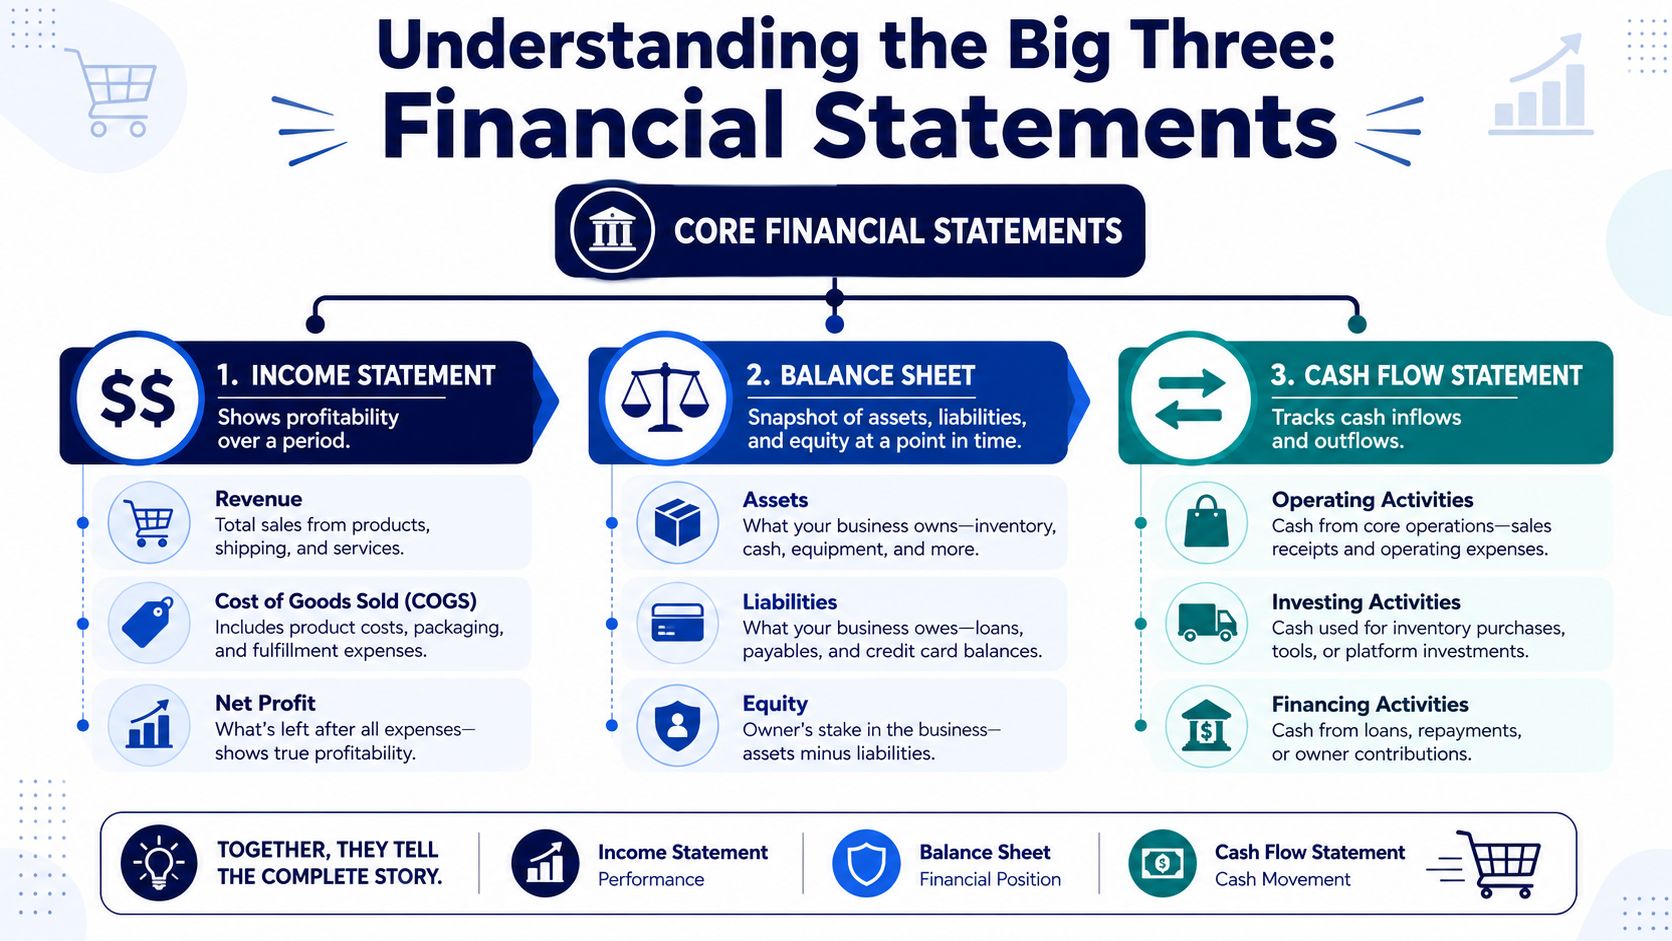
If you're training operators, not accountants, a practical way to explain the big three is simple. Think of the income statement as the game score, the balance sheet as the player condition, and the cash flow statement as stamina. You need all three to know whether the team won and whether it can keep winning.
For founders who want a straightforward non-finance refresher, this resource on mastering financial statements and KPIs is useful because it frames the numbers in management terms, not academic jargon.
This is the statement founders look at first, and for good reason.
The income statement shows profitability over a period. In an e-commerce business, that means revenue, cost of goods sold, gross profit, operating expenses, and bottom-line profit. It answers a practical question: did this period produce profit after the costs required to earn those sales?
For operators, the income statement is where pricing, discounting, freight assumptions, ad spend, payroll, software, and channel fees start to reveal whether the model is sound. It's where you notice that a top-line win might have been purchased through margin erosion.
Still, it has limits. It can make a business look healthier than it feels because accounting profit and cash movement aren't the same thing.
The balance sheet is the statement most founders underuse until cash gets tight.
It shows assets, liabilities, and equity at a point in time. For e-commerce brands, the most important balance sheet areas are usually inventory, receivables, payables, cash, debt, and retained earnings. Within these, one can observe whether growth is sitting on shelves, whether channel payments are still outstanding, and whether supplier terms are supporting or straining expansion.
A useful way to think about it is this:
| Statement area | Founder question |
|---|---|
| Assets | What do we own or control right now? |
| Liabilities | What do we owe, and how urgent is it? |
| Equity | What value is left for owners after obligations? |
A brand can show attractive profit on the income statement while the balance sheet deteriorates through excess inventory, weak collections, or increasing debt.
This is the practical assessment.
The cash flow statement tracks cash inflows and outflows. It shows whether operations generated cash, whether investing activities consumed it, and whether financing filled the gap. In e-commerce, this is often where critical insights surface. Strong sales can coexist with weak operating cash if stock is piling up or cash is delayed elsewhere in the cycle.
The cash flow statement is where optimism meets the bank account.
When founders start reading these statements together, decisions get sharper. Marketing spend stops being judged only by revenue lift. Inventory buys stop being approved only on forecast confidence. And “profit” starts being tested against liquidity, solvency, and actual cash generation.
A brand can post a strong month on paper, celebrate revenue growth, and still make worse decisions the next quarter because the wrong KPIs got the attention.
That happens a lot in e-commerce. Amazon founders focus on TACoS and rank. DTC teams focus on MER and conversion rate. Finance looks at margin and cash. The brands that scale cleanly tie those views together so one scorecard shows what is creating profit, what is consuming cash, and which channel deserves more capital.
For a practical outside perspective, this guide to financial analysis for UK entrepreneurs makes the same broader point. Numbers matter when they drive decisions, not when they sit in a report.
Gross margin is the starting point. It tells you whether product pricing and landed product cost are under control. It does not tell you whether a channel deserves more budget.
For that, contribution margin matters more.
Contribution margin strips out the variable costs attached to each order or channel. On Amazon, that usually includes referral fees, FBA fees, storage, coupons, and channel-specific ad spend. On DTC, it usually includes payment processing, pick and pack, shipping, discounts, and paid media tied to the sale. Wholesale adds a different trade-off. Lower marketing cost often comes with lower margin and less control over the customer.
This is the number I use to judge whether growth is worth funding. Revenue can rise fast while contribution margin gets worse because fees, discounting, and fulfillment costs eat the gain.
A few direct uses:
If your team needs a clearer way to connect orders, costs, and channel decisions, this guide on unit economics for e-commerce brands is worth reviewing.
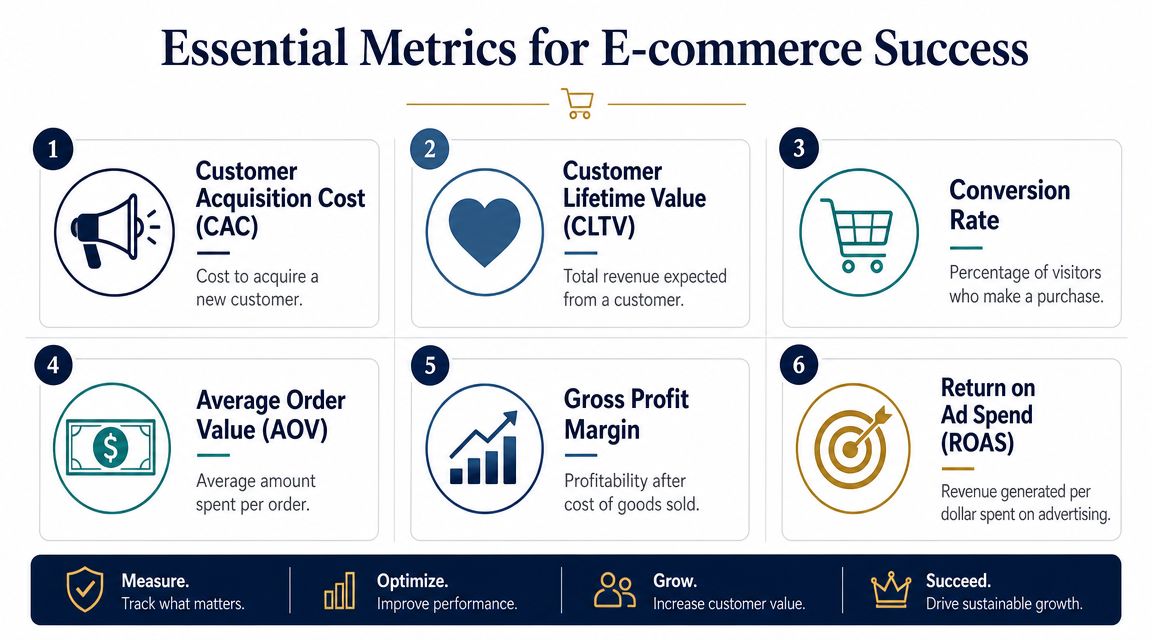
Marketing metrics belong in financial analysis. Founders who split them into a separate dashboard usually miss the underlying issue, which is revenue quality.
CAC, LTV, AOV, conversion rate, and ROAS all shape whether demand is profitable and repeatable. Looking at one in isolation leads to bad calls. A low CAC can hide weak customer quality. A strong ROAS can still produce poor contribution margin if the brand relies on heavy discounting or expensive shipping. High AOV can look great until return rates erase the gain.
Use the metrics together:
The trade-offs matter. Brands with strong repeat purchase behavior can accept a higher CAC. Brands with one-time buyers need tighter first-order economics. Subscription brands can tolerate a different payback profile than replenishment-light categories such as gifting or premium accessories.
Here's a useful visual breakdown of the metrics operators track most often:
Profitable brands still run into cash pressure when inventory, receivables, and payables move in the wrong direction.
Cash conversion cycle is one of the clearest ratios for 7 to 9 figure operators because it measures how long cash is tied up before it returns through sales. For an omnichannel brand, that means looking at inventory days, receivable days where applicable, and payable days together. A longer cycle usually means growth is demanding more cash than the P&L suggests.
Inventory turnover belongs next to it. Slow-moving stock drags down cash, raises storage and markdown risk, and usually points to forecasting or assortment problems. On Amazon, that can also turn into higher storage fees and weaker flexibility during peak periods. On DTC, it often shows up as larger promos that train customers to wait for discounts.
Current ratio still matters, but I would not stop there. A healthy-looking current ratio can hide inventory that will not convert quickly enough to cover near-term obligations.
Strong operators ask two questions at the same time. Is this sale profitable, and how long does the cash stay tied up?
For most 7 to 9 figure e-commerce brands, one monthly page is enough if it includes the right measures.
| KPI | What it helps you decide |
|---|---|
| Gross margin | Whether pricing discipline and product cost control are holding |
| Contribution margin by channel | Which channels deserve more ad spend, inventory, and working capital |
| Current ratio | Whether short-term obligations are manageable |
| Inventory turnover | Whether stock is moving at the pace the business needs |
| Cash conversion cycle | Whether growth is consuming cash faster than operations return it |
| CAC and LTV | Whether customer acquisition creates long-term value or short-term vanity growth |
The goal is not perfect scores across every line. The goal is a consistent story.
If gross margin improves while contribution margin falls, inspect fees, fulfillment, and discounts. If revenue rises while cash tightens, review inventory buys and payment timing. If paid acquisition looks efficient but LTV is soft, the brand may be buying weak customers who never become profitable. That is the level of analysis that helps Amazon, DTC, and omnichannel founders scale with less guesswork and better valuation math.
Month-end closes. Revenue looks strong. Ads are scaling. Then the cash balance says something completely different.
That gap is where founders lose control. A repeatable analysis cadence closes it.
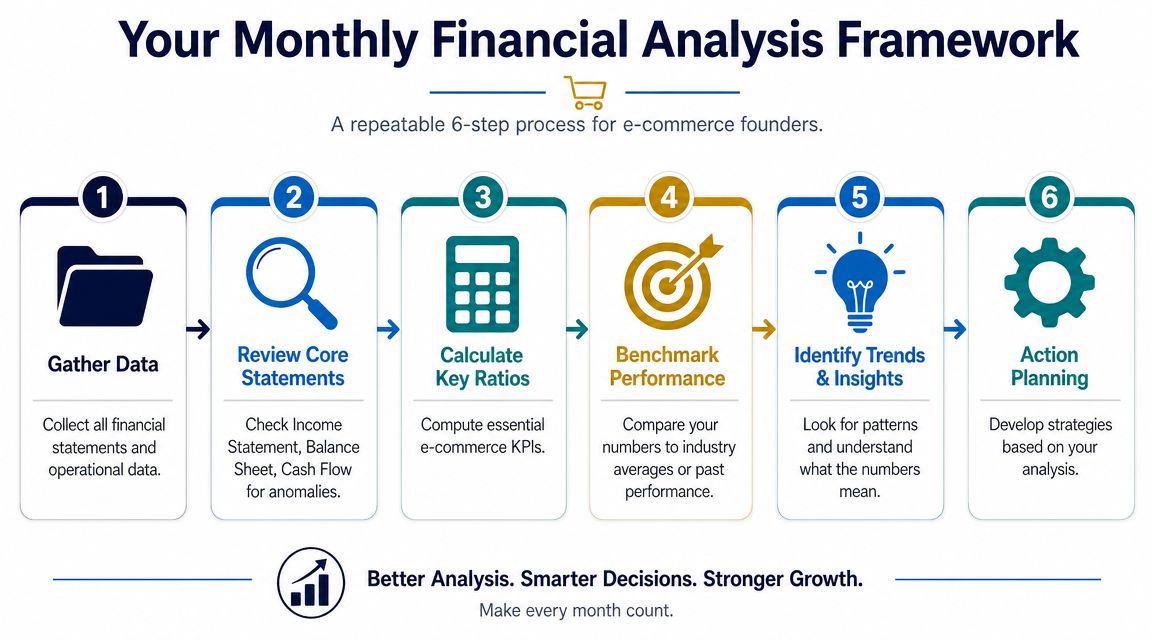
For a 7 to 9 figure Amazon, DTC, or omnichannel brand, the goal is not a bigger reporting pack. The goal is a decision routine the team can run every month without burning a week in spreadsheets. If the process only works during calm periods, it is not a process. It is a project.
A useful outside perspective on financial analysis for UK entrepreneurs makes the same point in practical terms. Raw statements matter less than the operating decisions they support.
Start with the systems that run the brand. That usually includes QuickBooks or Xero, Shopify, Amazon Seller Central, inventory software, ad platforms, and any SKU or channel reporting your team trusts.
Consistency matters more than perfection here. Pull reports on the same day each month, use the same cutoffs, and lock the same definitions for revenue, refunds, fees, COGS, and contribution margin. If one month includes accrued freight and the next does not, trend analysis breaks fast.
Look at the P&L, balance sheet, and cash flow statement side by side.
Founders who review them in isolation miss the complete story. Rising revenue with weaker operating cash often points to inventory timing, receivables drag, or margin compression hidden inside channel mix. A healthier P&L can still sit on a balance sheet that is getting harder to fund.
At this stage, look for movements that need explanation. Inventory jumps. Payables shrink. Refunds climb. Marketplace fees spike. Payroll rises without a matching gain in output. The first job is to identify what changed, not to defend it.
At this point, the routine stays useful or turns into accounting theater.
Skip the long list of textbook ratios. For e-commerce, a small KPI set usually does more work:
If cash is consistently tight, pair this review with a tighter operating system for managing cash flow.
Numbers do not fix anything on their own. Teams do.
Compare the current period against prior months, plan, and the assumptions you made when inventory was purchased or spend was approved. Then ask the questions operators ask. Did a promotion pull demand forward? Did Amazon fees move? Did a larger PO improve unit cost but strain cash? Did channel mix shift toward lower-margin revenue? Did returns hit after a heavy sales period?
Strong finance work becomes useful to a founder. The statement shows the outcome. The analysis identifies the operational cause.
Operating lens: Every material movement in the statements should connect to a pricing decision, channel shift, inventory buy, cost increase, timing issue, or execution problem the team can name clearly.
A clean monthly output can stay on one page if it answers four questions:
The fourth line matters most.
Slow purchase orders on weak SKUs. Reprice products that lost margin. Cut ad intensity where contribution is thin. Push collections. Renegotiate supplier terms. Move capital toward channels that convert profitably, not just channels that report growth. That is the difference between financial statement analysis for a generic business and analysis that helps an e-commerce brand scale, protect cash, and improve valuation.
Once the numbers are clean, the next question is obvious. Are they good?
That answer doesn't come from a random screenshot in a founder group. It comes from the right comparison set. In practice, there are two that matter most: your own history and a relevant external benchmark.

Your own trend line is usually the first benchmark to trust.
A ratio can look fine in isolation and still signal a problem if it's moving in the wrong direction. Gross margin slipping over time. Inventory turning more slowly. Ad spend rising faster than contribution profit. Those changes matter because they reflect how your model is evolving, not how some other brand operates.
Use internal benchmarking to answer questions like:
External benchmarking is still useful, but only if the comparison is honest.
An Amazon-heavy replenishable brand and a premium DTC brand with lower order frequency won't share the same economics. A business with long manufacturing lead times won't look the same as a light-inventory brand. A mature catalog behaves differently from a launch-heavy business.
So compare like with like:
| Benchmark type | Best use |
|---|---|
| Own historical trend | Spot deterioration or improvement early |
| Same channel model | Compare Amazon to Amazon, DTC to DTC |
| Same inventory profile | Avoid comparing fast turns to slow turns |
| Same margin structure | Separate premium brands from discount-driven models |
The goal isn't vanity. It's decision quality.
If your inventory turnover is weaker than your own prior periods and cash is tighter, that's enough to act. If your customer acquisition costs are climbing while repeat behavior isn't strengthening, that's enough to rework your paid strategy. Benchmarking should help you set realistic targets and expose the next priority, not make you chase someone else's business model.
The most dangerous financial mistakes in e-commerce don't look dramatic at first.
They show up as “temporary” cash strain, “normal” inventory buildup, or “strong” growth that seems to justify everything. Founders often discover too late that the business was getting harder to fund, not stronger to own.
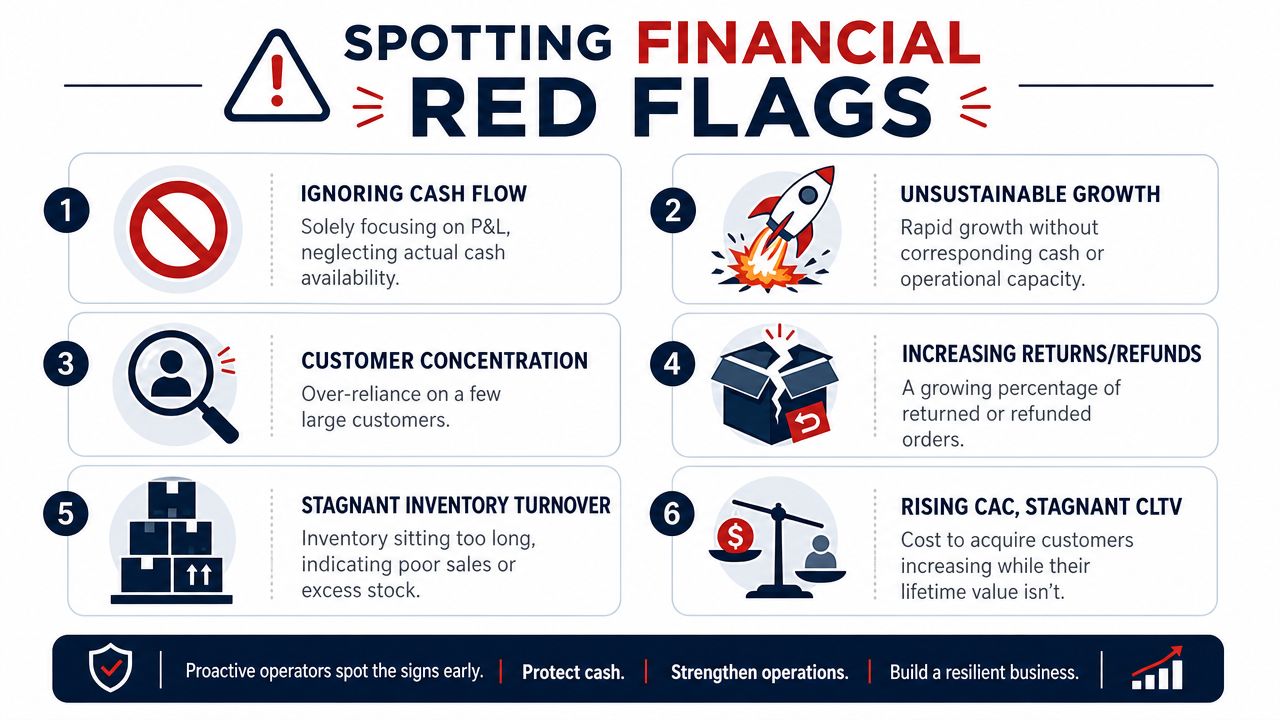
A common mistake is believing that revenue growth itself proves business quality. It doesn't.
Advanced financial statement analysis can help detect whether reported growth is real or inflated by accounting noise. Warning signs include revenue spikes that do not match cash collections, unusually fast accounts receivable growth, or declining liabilities that may conceal expenses. Strong top-line growth can be less informative than the relationship between revenue, receivables, cash flow, and inventory turnover (Harvest CPA).
For an e-commerce founder, that translates into a simple principle. If revenue rises but cash collections lag, inventory swells, and the balance sheet gets weaker, growth may be lower quality than it looks.
Some issues aren't fraud-oriented. They're operator mistakes.
Here's the practical test I'd use on any fast-growing brand:
| Question | Why it matters |
|---|---|
| Did cash improve with profit? | If not, growth may be consuming working capital |
| Did receivables and inventory grow in step with reality? | If not, the revenue story may be overstated |
| Did liabilities move in a way the team can explain? | Unusual declines can distort operating picture |
| Did contribution margin improve by channel? | If not, scale may be low quality |
Fast growth can cover weak discipline for a while. It rarely fixes it.
The founders who avoid these traps usually do three things consistently:
That mindset is what separates a business that scales from a business that just gets bigger.
Use the systems that already hold the truth. For most brands, that means QuickBooks or Xero for accounting, Shopify and Amazon Seller Central for channel data, your inventory system for stock movement, and a reporting layer that helps normalize the numbers. The best setup isn't the fanciest one. It's the one your team updates consistently and trusts.
A solid monthly review is the minimum for most established brands. Quarterly is too slow if inventory, ads, and channel mix change fast. If the business is in a volatile period, such as a launch cycle, financing event, or cash squeeze, founders should look at a tighter operating dashboard weekly and watch cash even more closely.
If I had to choose one operating finance metric, I'd watch cash movement in relation to inventory. Many e-commerce problems show up there before they show up cleanly in reported profit. If you want one broader idea to keep in your head, it's this: profit is important, but cash funds the next move.
Bring one in when the business has enough complexity that founder intuition is no longer enough. That usually means multiple channels, meaningful inventory planning, debt or outside capital, or recurring confusion about why profit and cash don't line up. A good fractional CFO won't just report numbers. They'll help you make better calls on purchasing, pricing, financing, and growth pacing.
Yes. Founders don't need to become accountants. They need to become good readers of the business. If you can understand how inventory, advertising, pricing, fulfillment, and payment timing affect cash and margin, you can use financial statement analysis well enough to make sharper decisions.
If you're building an Amazon, DTC, or omnichannel brand and want sharper insight from operators who've already handled these finance, inventory, and scale challenges, Million Dollar Sellers is where serious founders learn from peers operating at a very high level.
Join the Ecom Entrepreneur Community for Vetted 7-9 Figure Ecommerce Founders
Learn MoreYou may also like:
Learn more about our special events!
Check Events