
Chilat Doina
July 26, 2026
You've got a test running, the dashboard is open, and the result looks promising enough to make your stomach tighten. The new headline is ahead, the button color changed, or checkout copy seems to be helping, but the lift is small enough that you're not sure whether to celebrate or wait. That uneasy moment is exactly where what is statistical significance stops being an academic phrase and becomes a real operating tool.
For ecommerce founders, the hard part isn't running experiments, it's deciding whether a result is real, whether it matters, and whether it's worth rolling out to every visitor. A tiny lift can look exciting on a chart and still be too small to move revenue, margins, or customer behavior in any meaningful way. Statistical significance helps you separate signal from noise, while practical significance tells you whether the signal is worth acting on, a distinction many basic explainers skip even though it drives better decisions in live stores (National Library of Medicine, NNGroup on practical significance).
A founder changes the product page headline, waits two weeks, and sees a tiny conversion lift. The team wants to celebrate because the dashboard finally looks positive, but the question is simpler and more dangerous: did the new version create that improvement, or did the result wander upward on its own?
Bad decisions start there. A test can look better and still be misleading when traffic is uneven, customer behavior shifts from one day to the next, or someone keeps refreshing the results like they're checking the forecast. The problem is not just wasted design effort. It is shipping a change because the chart looked kind, then building a roadmap around a result that would fall apart under a cleaner test.
Practical rule: if you would not feel comfortable betting inventory, ad spend, or roadmap time on the result, the number on the screen is not enough by itself.
Statistical significance is the guardrail that keeps founders from mistaking random movement for a real effect. It does not tell you whether the change is smart, profitable, or worth scaling. It answers a narrower question, whether the data are unusual enough that chance is no longer the easiest explanation.
That matters in ecommerce because a store usually does not win or lose on one giant change. It moves through a chain of small decisions, a headline here, a checkout tweak there, a shipping message that lowers friction. Each one may look tiny on its own, but a testing program only works when you know which signals deserve rollout and which ones should stay in the notebook.
You can run a test that looks promising and still not know whether the lift is real. That is where statistical significance comes in. It helps you separate a result that is probably not random from one that could easily be a lucky bounce in traffic, order mix, or customer behavior.
The usual starting point is the null hypothesis. In plain language, it says your change had no effect. If you changed the headline, button text, or offer framing, the null assumes the old version and the new version perform the same.
From there, analysts look at the p-value. It is the chance of seeing results at least as unusual as yours if the null were true. When that chance is low enough under your chosen cutoff, the result is treated as statistically significant. That cutoff is often p < 0.05, but that is a convention, not a law of nature, and different testing situations can use a different threshold (Scribbr on statistical significance).
A coin-flip example is useful here, but the business version is more familiar. If a product page starts converting better after a change, you ask whether the lift came from the change or from noisy traffic patterns that happened to line up in your favor. Statistical significance answers that narrower question by asking whether chance is still the easiest explanation.
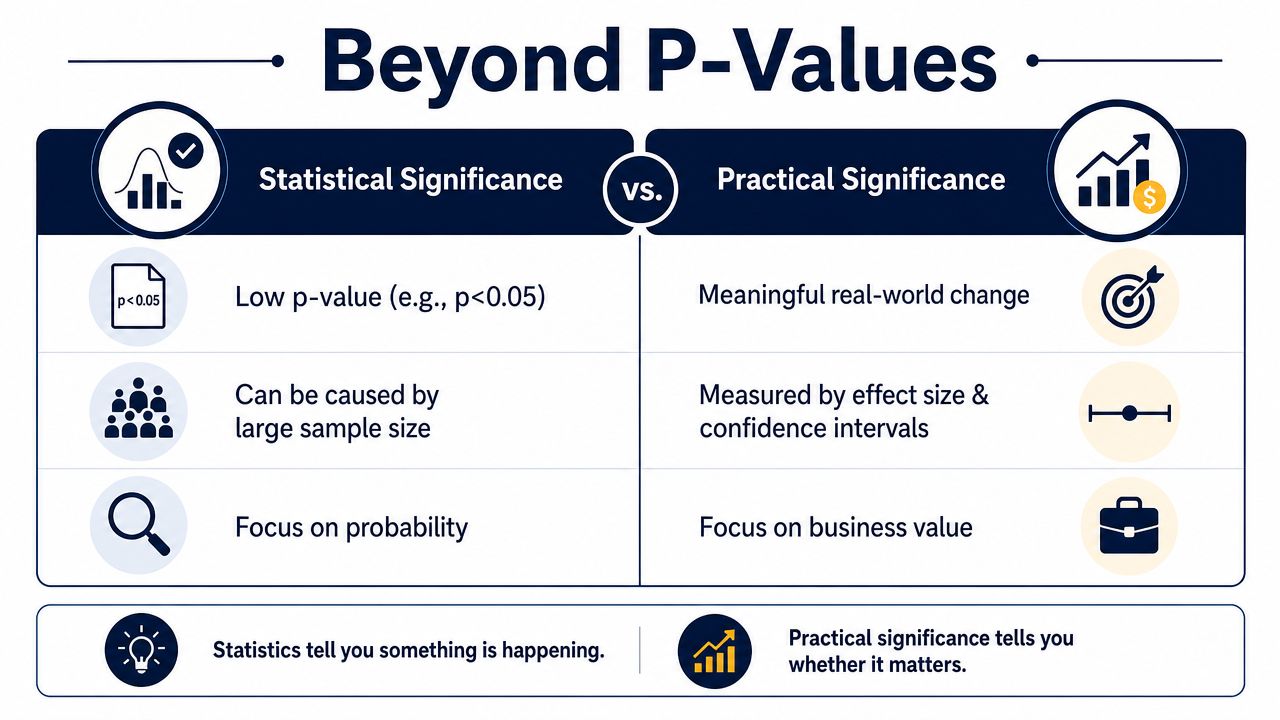
The harder part is knowing what significance does not tell you. It does not prove the idea is good. It does not prove the effect matters to revenue. It does not tell you whether the lift is large enough to justify rollout. It only says the result would be unusual if the null were true, which helps keep you from mistaking noise for signal.
Ecommerce teams also need to set an alpha level, the threshold for calling a result significant. A 0.05 alpha means you are accepting some false-positive risk under the null, which is why running many experiments at once without discipline can make fake winners look real. That tradeoff is easy to miss when a dashboard turns green. Tighter thresholds reduce false alarms, but they also make it harder to call a winner. Looser thresholds make wins easier to declare, but they raise the chance that you ship a mirage.
A test result can be “real” and still be too small to matter. That is the gap many teams miss when they stop at the p-value. A p-value can tell you that a lift is unlikely to be random noise, but it does not tell you whether the lift is worth the rollout effort, the design time, or the risk to the customer experience. That is why p-values alone are a weak basis for ecommerce decisions.
A better way to read test results is to ask three different questions at once. Is there evidence the change is real? How big is the change? How much uncertainty is still around it? Those questions line up with p-values, effect size, and confidence intervals, and each one answers a different business concern.
| What you're asking | What it helps you judge | What it does not tell you |
|---|---|---|
| Is the result likely real? | Whether chance is still the easiest explanation | Whether the lift is meaningful for revenue |
| How large is the change? | Whether the impact is big enough to notice in the business | Whether the result happened by luck |
| What range could the true effect fall in? | How much confidence to place in the estimate | Which option will definitely win after rollout |
Effect size measures the size of the difference, not just whether a difference probably exists. If a new checkout message lifts conversions, effect size tells you how large that lift is in practical terms. That matters because a result can be statistically significant and still be too small to affect revenue, customer experience, or the amount of work your team needs to invest.
A founder does not need a science trophy. They need a business answer. If the lift is tiny, the team may spend engineering effort, design time, and launch risk on a change that will not move the needle enough to justify it. That is the gap between “the test passed” and “the test mattered.”
Confidence intervals add context that a p-value cannot give on its own. They show a range of plausible values for the true effect, which helps you see both the upside and the downside. A wide interval means the result is still fuzzy. A narrow interval means you have a clearer read on what the change is likely doing.
That is why mature testers look at all three together, p-value, effect size, and confidence interval. The p-value helps answer whether the effect is likely real, the effect size shows how large it is, and the interval shows how much uncertainty still surrounds the estimate. Put together, they give you a much better decision tool than a single green number on a dashboard.
If the effect is real but too small to matter, the right move is to choose a bigger lever.
Sample size changes the quality of your evidence. Small tests are noisy, and noisy tests make it harder to tell whether a shift in conversion is real or just the market wobbling around you. The broader point is simple, more data usually gives you a clearer read, especially when the change you're testing is subtle.
Statistical power is the chance your test will detect an effect if one exists. If power is weak, you can run a test, follow the numbers, and still miss the signal. That's frustrating because the problem isn't your idea, it's the design of the experiment.
Running a test longer costs time, and time has a real business cost. But stopping too early can leave you with a result that looks tidy and says almost nothing. In ecommerce, that tradeoff is unavoidable. If the change is small, the test needs enough traffic to separate the effect from the background churn of shopping behavior.
The useful mindset is not “how fast can I get an answer,” it's “how much evidence do I need before I trust the answer?” That's the operator's version of testing. It's less glamorous than flipping a switch fast, but it protects margin, developer effort, and marketing spend.
Before you launch a test, decide what you're trying to detect. That includes how much change would matter to the business. If you don't set that boundary in advance, you'll end up interpreting every wiggle as a potential win, and that's how underpowered experiments steal weeks without producing a decision.
A lot of founders treat sample size like a technical detail. It's not. It's a cost-control tool. It determines whether your test can answer the question you care about, or whether you're just collecting expensive ambiguity.

A checkout button test is a good place to see the difference between a result that is real and a result that is worth acting on. If a clearer call to action reduces friction and lifts conversion, you have a business question, not just a design preference. That is the kind of test ecommerce teams need, because the decision affects revenue, not only the look of the page.
The setup has to happen before the experiment starts. Define the hypothesis, choose the significance threshold, decide how much power you need, and decide what size of change would justify the rollout. If those pieces are missing, the team ends up telling a story after the fact instead of running a clean test. If you need a refresher on the basic testing structure, this guide on what is A/B testing is a useful companion.
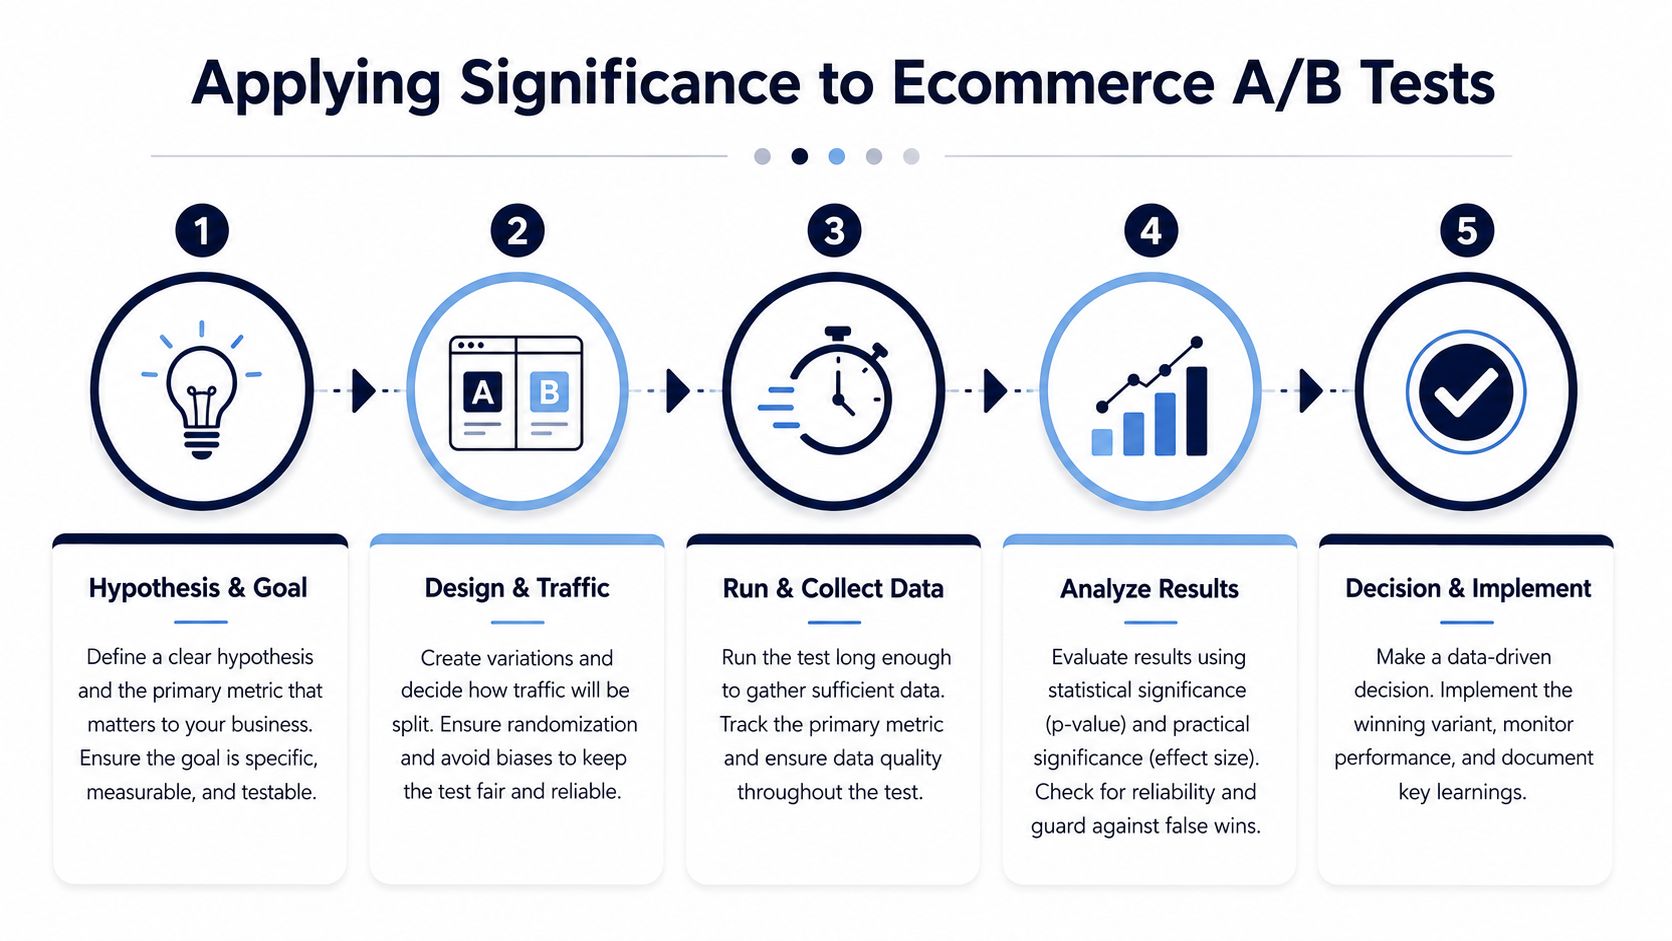
The core question is never just, “Did B win?” It is, “Did B win in a way that matters to the business?” A result can be statistically significant and still be too small to justify implementation. That is the gap between statistical significance and practical significance, and it is where many ecommerce teams make expensive calls.
Running several tests at once raises the chance of a false positive, so the caution discussed earlier matters even more here. If a team wants a clear framework for applying significance in retail experimentation, the guidance in actions for scaling with AB tests fits well with this stage of the process.
Treat the rollout like a capital allocation decision. The result has to earn implementation, not just look good on a chart.
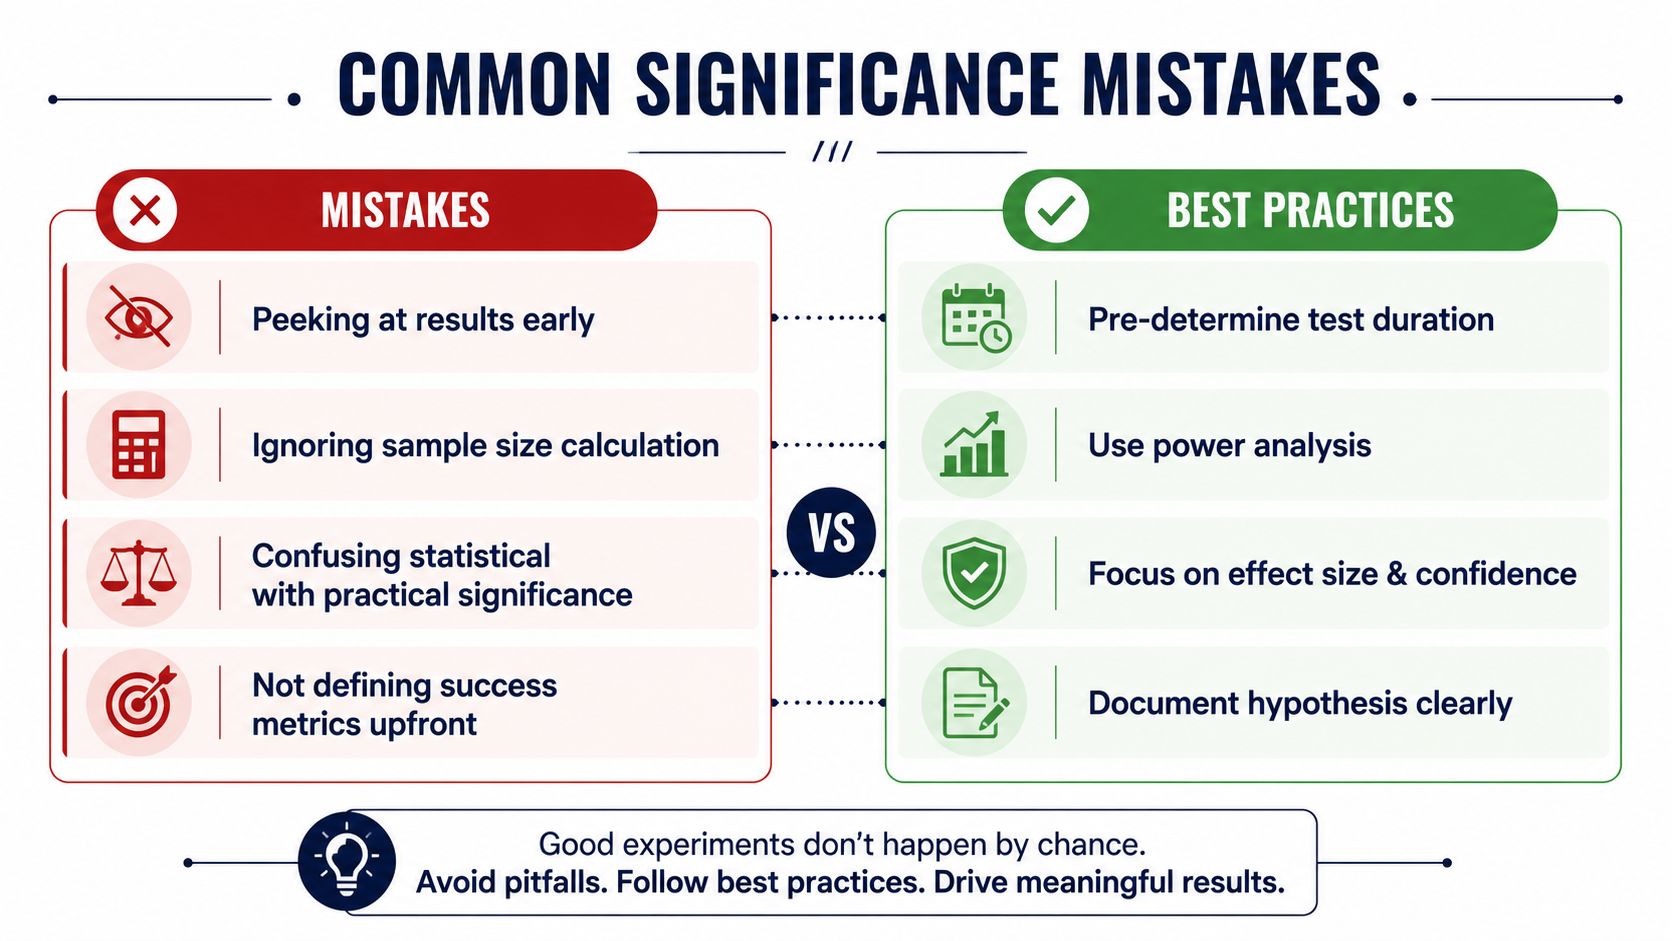
The biggest mistakes are rarely mathematical. They're process mistakes. Founders get impatient, teams check results too early, and people start treating a partial read like a final verdict.
The fix is boring, and that's why it works. Pre-define the test, let it run long enough, and judge it against the metric that matters to the business. That discipline is what separates random experimentation from a real growth system.
If you want a tactical lens on scaling experimentation across channels and retail motion, the framework in actions for scaling with AB tests is a helpful external reference point. It fits especially well when a team is moving from one-off tests to a repeatable operating rhythm.
For conversion-focused teams, it also helps to connect experiment discipline with broader optimization work. This article on how to improve ecommerce conversion rates is useful when you're deciding which friction points deserve testing first.
A clean test result can still lead to a bad decision. Statistical significance tells you whether the effect is likely real, practical significance tells you whether it is big enough to matter for the business. That split matters in e-commerce, because a tiny lift can be real on paper and still fail to move revenue, margin, or repeat purchase behavior in any meaningful way.
Start with the decision, then work backward. Define the hypothesis first, decide the minimum effect that would justify rollout, and set the test before any data comes in. That keeps the team from arguing with the numbers after the result looks inconvenient.
If you want the measurement side of this to stay grounded, a practical guide to what data analytics is helps your team separate raw reporting from decision-making. The broader habits in ReachLabs.ai on data strategy fit here too, because better data discipline makes experiment readouts easier to trust.
The founders who scale best do not stop at, “Was it significant?” They ask whether the lift is large enough to matter, and whether it justifies the rollout. That is the difference between running tests for show and running an experimentation program that changes the business.
If you want sharper testing habits, better decision frameworks, and a peer group that talks about growth with real operating depth, Million Dollar Sellers is built for that level of conversation. It is where serious ecommerce operators compare notes on experiments, conversion, and scaling decisions with founders who have already been in the trenches.
Join the Ecom Entrepreneur Community for Vetted 7-9 Figure Ecommerce Founders
Learn MoreYou may also like:
Learn more about our special events!
Check Events