
Chilat Doina
October 1, 2026
A “good” ROAS isn't automatically 4:1. That rule is easy to remember, easy to put in a dashboard, and often wrong for the business paying the bills. A brand with thin margins can lose money at 4:1, while a high-margin or repeat-purchase business may grow profitably at a lower multiple.
The better question is: what ROAS leaves enough contribution margin to cover acquisition, overhead, retention, and growth? That answer depends on product economics, attribution, channel intent, customer lifetime value, and the stage of the brand. Historical guidance has often placed ecommerce ROAS around 2:1 to 4:1, with Amazon's guide describing 2:1 as an average estimate and noting that brands often aim closer to 3:1 or 4:1 (Amazon Advertising). More recent ecommerce summaries cite an average near 2.87x, while one reports a median closer to 2.04x, which reinforces that a universal target is a poor operating rule (Trendtrack).
A 4:1 ROAS can still be a bad result. Suppose a $45 order produces $23 in variable costs before advertising. That leaves $22 in contribution. At 4:1, the ad spend is $11.25, leaving $10.75 before overhead, retention, and other operating costs. The multiple looks healthy, but the dollars available to run the business determine whether it is healthy.
ROAS only compares attributed revenue with advertising spend. It does not account for product cost, shipping, payment fees, returns, support, or whether the customer will purchase again. For a low-margin DTC brand, 4:1 may leave too little contribution to support growth. A higher-margin product, or one with strong repeat purchasing, may support customer acquisition at 2.5:1.
Practical rule: Set ROAS from the contribution your business needs, not from a dashboard benchmark. Decide how much must remain after variable costs, then choose whether the target supports immediate profit, an acceptable payback period, or profitable volume.
The same ratio can represent very different economics across channels and business models. A marketplace seller may need tighter first-order efficiency than a subscription brand with predictable repeat revenue. An apparel store that usually gets one purchase cannot set the same target as a brand that earns meaningful customer lifetime value after acquisition.
Start with contribution margin. Subtract COGS, variable fulfillment, delivery, payment, and return costs from net revenue. Compare the remaining contribution with ad spend, then layer in LTV-to-CAC. That calculation connects the target to the customer value you can afford to buy, rather than treating attributed revenue as profit.
Channel intent and brand stage also change the decision. Search traffic with clear purchase intent may justify a different target from prospecting on Meta. A launch may accept weaker first-order ROAS to build a customer base, while a mature brand may require stronger contribution and faster payback.
A lower industry benchmark does not automatically signal failure. The useful question is whether your margin and customer value can support the result. A multiple is context, not a target.
A strong ROAS multiple can still lose money. The standard formula is:
ROAS = attributed ad revenue ÷ ad spend
If a campaign receives credit for $10,000 in revenue and costs $2,000, its reported ROAS is 5.0x. That figure answers one narrow question: how much attributed revenue the platform assigned to each unit of advertising spend.
It does not show whether the campaign produced profit. To make the metric useful for decisions, connect revenue to contribution margin, which shows the dollars left after costs that vary with each sale.
Suppose a product sells for $45, with $15 COGS, $5 shipping, and $3 fulfillment fees. The contribution dollars before advertising are $22:
$45 revenue − $15 COGS − $5 shipping − $3 fulfillment = $22
The contribution margin is $22 ÷ $45, or approximately 48.9%. A campaign needs about 2.04x ROAS to cover advertising at that margin, using 1 ÷ contribution margin. This example shows why the relevant cost base includes variable fulfillment and delivery expenses, not only the product invoice.
A gross-margin shortcut works when the margin figure already includes the variable costs relevant to the decision. The standard formula is break-even ROAS = 1 ÷ gross margin, as outlined in Superscale's ROAS benchmark guide. Use the margin that matches your accounting definition, and do not mix gross margin with contribution margin.
| Metric | Standard ROAS | Margin-Adjusted ROAS |
|---|---|---|
| Formula | Attributed revenue ÷ ad spend | Contribution profit ÷ ad spend |
| What it shows | Revenue efficiency | Contribution generated after variable costs |
| Best use | Campaign and channel comparison | Break-even and scaling decisions |
| Main risk | Can overstate business value | Requires accurate cost inputs |
For a clearer distinction between advertising efficiency and broader investment returns, find affiliate program performance metrics. A break-even ROAS calculation guide can help formalize the calculation in a planning sheet.
ROAS measures attributed revenue against ad spend at campaign or channel level, based on an attribution model. MER, or marketing efficiency ratio, divides total business revenue by total marketing spend, giving a blended view. Net profit includes fixed overhead, payroll, software, rent, taxes, and other business expenses.
Keep all three visible because each answers a different question. A campaign can report strong platform ROAS while total MER weakens as prospecting spend grows. A prospecting campaign can also look modest alone while increasing demand and improving the business's overall economics. Use the multiple as an input to contribution and LTV-to-CAC decisions, not as a substitute for them.
Channel averages help set expectations, but they do not set your target. Each channel plays a different role in the customer journey. Branded Google Search captures existing demand. Meta prospecting creates demand among people who may not know the brand. Amazon Sponsored Products reaches shoppers close to a marketplace purchase, while TikTok relies more heavily on creative to build attention and intent.
Available 2026 reporting places general ecommerce near 4.0x on Google Ads and roughly 2.5x to 4.0x on Meta Ads. Broader ecommerce performance is reported around 2.87x, with median results closer to 2:1 (Hawky's industry benchmark analysis). Treat these figures as reference points, not operating targets.
| Channel | Typical ROAS Range | Why the Economics Differ |
|---|---|---|
| Amazon Sponsored Products | Qualitatively higher than prospecting channels | Captures shoppers with marketplace intent, but fees and organic cannibalization affect profit |
| Meta Advantage+ shopping campaigns | 2.5x to 4.0x | Mixes prospecting and retargeting, with creative and audience costs influencing results |
| Google Search and Performance Max | Around 4.0x for general ecommerce reporting | Search intent can be stronger, but branded and non-branded traffic behave very differently |
| TikTok Ads | Qualitatively lower or more variable than high-intent search | Creative carries more of the burden for discovery, attention, and conversion |
| Microsoft Advertising | No verified range in the supplied data | Economics depend on audience mix, query intent, and how much demand overlaps with other search channels |
Amazon often reports attractive efficiency because Sponsored Products appear while shoppers compare products. Incremental value still needs checking. Track new-to-brand behavior, organic lift, fees, coupons, and whether advertising received credit for a purchase that would have happened without the ad.
Meta Advantage+ shopping campaigns combine broad discovery with retargeting. A reported 3:1 can support a brand with strong contribution margin and repeat purchases, yet fail for a one-order business with expensive fulfillment. Rising acquisition costs may signal creative fatigue, landing-page mismatch, or a weak offer before blended ROAS makes the problem obvious.
Google requires separate branded and non-branded reporting. Branded Search can look exceptionally efficient because it captures people who already know the brand. Performance Max combines placements and intent, so assess its blended result with incrementality checks and product-level margin analysis.
Channel benchmark: Use channel ranges to diagnose account performance. Set scaling thresholds from break-even ROAS, contribution margin, and expected customer value.
Creative-led channels also require a production plan. If you are expanding creator content or influencer partnerships, resources that help you find top creators for your brand can support testing without forcing every channel into a last-click ROAS contest. For retail media and marketplace campaigns, review retail media attribution before comparing platform-reported results across channels.
A 4:1 ROAS can represent very different economics. At a 60% margin, the business keeps $0.60 from each revenue dollar before other costs. At a 15% margin, it keeps $0.15. The same reported multiple therefore creates very different room for acquisition cost, cash-flow pressure, and payback.
Build the target from contribution margin, not gross margin alone. Start with net revenue, then subtract COGS, fulfillment, shipping subsidies, payment processing, expected returns, marketplace fees, and other costs that rise with each order. The remaining contribution dollars fund advertising, fixed overhead, and profit.
The plain break-even relationship is break-even ROAS = 1 ÷ margin. Treat it as a floor, not a universal performance target. If your contribution margin includes more variable costs than gross margin, the operating floor rises. A campaign can clear the gross-margin threshold while still leaving too little contribution to support overhead or a realistic profit goal.
Your finance model should define any buffer rather than applying an arbitrary percentage. A buffer might preserve additional contribution, cover attribution volatility, or support a specific profit target. Until its purpose is agreed, leave it out of the ROAS calculation.
A repeat-purchase or subscription brand can accept a first-order ROAS below immediate break-even when future contribution supports the acquisition cost. That choice requires a cash-flow limit. Calculate payback period = CAC ÷ monthly contribution margin per customer, then set the longest period the business can finance comfortably.
A one-and-done apparel buyer usually offers one main opportunity to recover CAC. A supplement subscriber may generate contribution across several billing cycles, provided retention assumptions hold. Similar first-order values do not make these customers economically equivalent.
Use a cohort view beside channel ROAS. Separate first-order contribution from repeat contribution, compare retention by acquisition source, and set a maximum payback period before increasing spend. The unit economics guidance can help structure that model, but the decision still depends on your actual retention, contribution, and cash constraints.
ROAS is a transaction-level signal. LTV-to-CAC shows whether the acquisition can support the business over time. Judge both before lowering a target that appears inefficient on the first order.
The right target changes as the account moves from learning to repeatable acquisition. A launch campaign has a different job from a mature campaign, so applying the mature target on day one can suppress useful testing. At the same time, calling every inefficient campaign “learning” can turn experimentation into an excuse for uncontrolled spend.
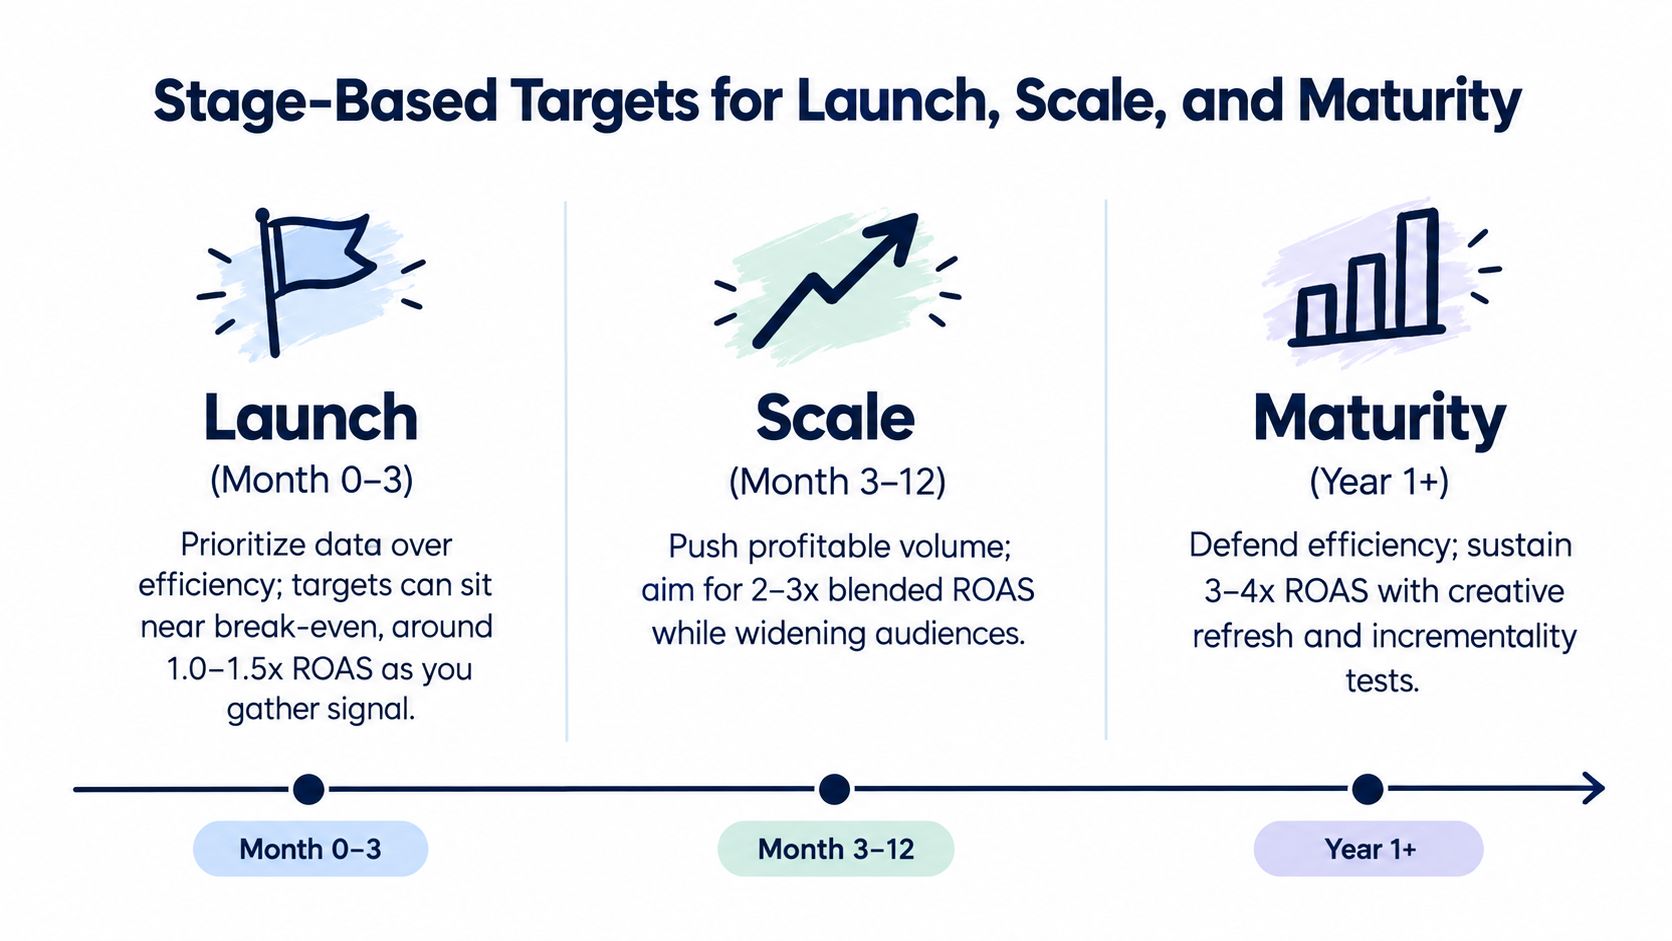
During the first month 0 to 3, prioritize signal quality over perfect efficiency. Test angles, offers, audiences, landing pages, and creative formats. A target near break-even can be rational when the account needs conversion data and the brand is still identifying which promise earns attention.
That doesn't mean spending without controls. Set a fixed learning budget, define the events that matter, and stop combinations that fail to produce qualified traffic or purchases. A weak offer won't become healthy because the campaign has more time to learn.
From month 3 to 12, shift toward profitable volume. The account should have enough evidence to identify winning creative themes, product combinations, and audience responses. Targets can tighten to approximately 1.3x to 1.8x break-even, but that multiplier is an operating framework, not a verified industry benchmark.
The scale phase requires a distinction between efficiency and capacity. If ROAS is above target but spend is flat, the problem may be audience size, creative volume, inventory, or landing-page capacity. Scaling isn't just raising budgets until the multiple falls.
At year 1 and beyond, defend efficiency while funding the next source of growth. A mature brand can use a higher target to protect contribution for overhead, product development, retention, and brand activity. It may also deliberately relax the target for a new market, a new SKU, inventory pressure, or an awareness push.
The reverse applies in steady state. If the product, audience, and funnel are stable, insist on the agreed floor and investigate slippage rather than accepting a lower multiple as normal.
A short operational sequence works well:
Consider a fictional mid-market DTC skincare brand with a 55% contribution margin, a 20% repeat-purchase rate, and a $185 AOV. The purpose isn't to declare a universal skincare benchmark. It's to show how an operator can convert business economics into channel decisions.
Start with break-even. Using the formula 1 ÷ margin, the brand's immediate break-even ROAS is approximately 1.82x. At that point, the contribution generated by attributed revenue covers the advertising cost, before fixed overhead and broader business expenses.
Next, model the customer relationship. Suppose the brand estimates $45 of additional LTV-adjusted contribution across 18 months from the repeat-purchase cohort. That value shouldn't be added automatically to every customer. It belongs in a cohort model that separates new customers, repeat purchasers, retention, refunds, and acquisition source.
The operator then chooses a six-month payback period. That decision turns LTV into a cash-flow constraint. The brand can accept weaker first-order economics when the expected contribution arrives within the approved payback window, but it shouldn't scale on an LTV assumption that the cohort data hasn't supported.
For Meta, use a blended target that reflects prospecting exposure and creative testing. Google branded traffic deserves a separate target because it captures stronger existing intent, but its reported efficiency shouldn't subsidize underperforming prospecting campaigns.
| Stage | Target ROAS | Rationale |
|---|---|---|
| Immediate break-even | Approximately 1.82x | Derived from 55% contribution margin |
| Meta working target | Set above break-even, based on payback tolerance | Allows prospecting while protecting contribution |
| Google branded target | Higher than the Meta target | Reflects stronger existing purchase intent |
| Scale decision | Compare marginal contribution, not only blended ROAS | Prevents efficient traffic from hiding weak incremental spend |
If current Meta ROAS sits above the working target and marginal performance remains stable, increase spend cautiously. If it sits slightly below target, test creative, the landing page, product positioning, and checkout friction before cutting the channel. If it sits well below the break-even floor, pause expansion and fix the offer or funnel.
Resources covering Meta advertising scaling rules can help structure the budget conversation, but the brand's own margin and cohort data should make the final call.
The operator's spreadsheet should show revenue, ad spend, contribution dollars, CAC, first-order contribution, repeat contribution, payback period, and spend by channel. With a $185 AOV, the question isn't whether the platform reports an attractive multiple. It's how many contribution dollars remain after the order, how quickly repeat value arrives, and whether the next dollar of spend produces enough incremental profit to justify its risk.
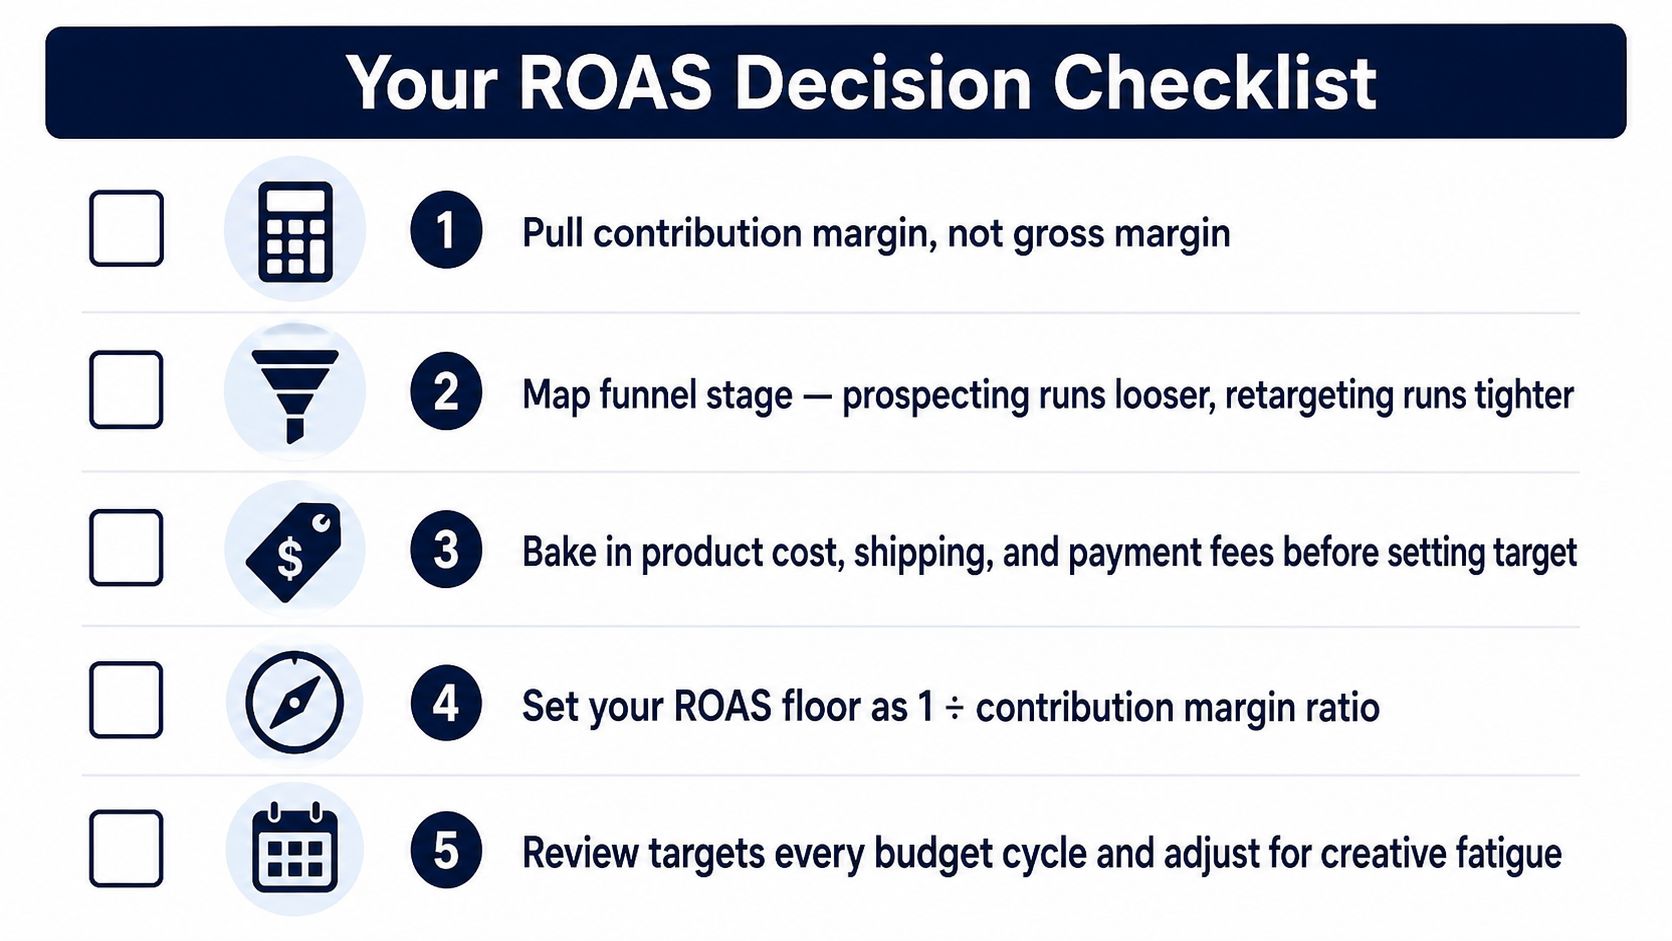
A useful ROAS review ends with a decision, not a benchmark screenshot. Bring the following sequence into the next budget meeting and write the inputs beside each step.
Pull contribution margin first. Use net revenue and subtract COGS, fulfillment, shipping, payment fees, returns, and other variable costs. Gross margin alone can make the acquisition ceiling look safer than it is.
Calculate the break-even floor. Divide 1 by the applicable margin ratio. The result is the minimum multiple required to cover the defined variable economics and advertising cost. Keep the formula visible in the planning sheet.
Add LTV-to-CAC context. Decide whether the campaign is buying a profitable first order or a customer relationship. If future contribution matters, record the retention assumption, cohort source, and maximum payback period.
Separate channels and intent. Compare Amazon, Meta, Google Search, and Performance Max according to their role in the funnel. Don't let branded search efficiency hide weak prospecting, and don't compare marketplace attribution with DTC attribution as though they were identical.
Classify the business stage. Launch accounts need signal, scaling accounts need repeatable volume, and mature accounts need efficiency plus incremental growth. The target should change with that job.
Set a range, not one magic number. Define a floor that triggers a pause or investigation, a working target for normal spend, and a ceiling that signals room to scale. A range gives operators room to respond without abandoning financial discipline.
Inspect the offer before blaming the channel. If ROAS undershoots, review creative, price, promotion, product detail pages, landing-page relevance, checkout friction, and inventory. A channel often exposes a conversion problem that the media team can't solve alone.
A good ROAS is the multiple that supports profitable growth under your actual economics, not the number that looks most impressive in a weekly report.
Review the target every budget cycle. Margin changes, creative fatigue, inventory constraints, attribution shifts, and retention performance can all change what the business can afford. Million Dollar Sellers offers peer discussions, strategy sharing, and operator insights for ecommerce founders working through decisions like channel allocation, acquisition economics, and profitable scale. Visit Million Dollar Sellers to learn how the community approaches growth with more than platform ROAS alone.
Join the Ecom Entrepreneur Community for Vetted 7-9 Figure Ecommerce Founders
Learn MoreYou may also like:
Learn more about our special events!
Check Events




.webp)