
Chilat Doina
August 23, 2026
You can have a strong month on Amazon, healthy gross margins in Shopify, and a profit-and-loss statement that looks reassuring, yet still feel anxious every time you check the bank account. The reason is usually simple: profit records economic performance, while cash forecasting tracks when money moves.
A supplier deposit may leave the account long before the inventory sells. Ad spend can rise ahead of a promotion. Marketplace payouts may arrive after the business has already committed to the next purchase order. Financial forecasting connects those moving parts, estimating future revenue, expenses, cash positions, and capital needs so you can make better decisions about inventory, advertising, hiring, and growth.
A founder sees sales rising and approves a larger inventory order. The purchase looks rational. Demand is strong, the product is profitable, and the next launch is approaching. Then freight, duties, production deposits, marketplace fees, advertising, payroll, and software bills hit before the new stock generates enough cash to replenish the account.
Nothing necessarily went wrong in the P&L. The business can remain profitable on an accrual basis while its bank balance deteriorates. That's the central distinction behind what is financial forecasting in an ecommerce context: it's the disciplined practice of estimating future financial performance and cash availability, not just projecting a sales number.

Revenue forecasts tell you what you expect to sell. Expense forecasts tell you what you expect to incur. A useful ecommerce forecast goes further and shows when cash leaves, when it arrives, and how much working capital sits inside inventory.
That matters because Amazon and DTC brands operate across several timing systems:
A forecast turns those events into a forward-looking operating view. It helps answer practical questions: Can the business place the next purchase order without restricting ad spend? Can it hire before peak season? What happens if sell-through slows while supplier commitments remain fixed?
Practical rule: Never approve a growth investment from the P&L alone. Check the cash calendar and inventory commitment first.
Financial forecasting also has a long statistical history. Formal financial-data analysis developed through the early twentieth century, the Box-Jenkins time-series approach became a major milestone in the 1970s, computing enabled scaled exponential smoothing in the 1980s, machine learning entered forecasting more visibly in the 1990s, and deep-learning methods expanded alongside big data and cloud computing in the 2000s, as described in this history of financial forecasting. For operators, the important lesson isn't to copy an academic model. It's to recognize that a forecast should combine historical evidence, operating drivers, and management judgment.
No single forecasting method works equally well for every ecommerce brand. A small Amazon seller with limited history needs a different starting point from a mature DTC company with repeat-purchase data, stable acquisition channels, and pronounced seasonality.
Top-down forecasting begins with a market estimate, category opportunity, or strategic revenue goal, then works downward toward the brand's expected share. It's useful for long-range planning, fundraising discussions, and testing whether an expansion thesis is large enough to justify investment.
Its weakness is operational distance. A market opportunity doesn't tell you how many units a specific SKU can sell next month, how much PPC will cost, or when the supplier needs a deposit. Use top-down forecasting as a reasonableness check, not as the only model driving purchase orders.
Bottom-up forecasting starts with the mechanics of the business. For an Amazon seller, that might mean units by SKU, expected selling price, promotions, return assumptions, and advertising-supported volume. For a DTC brand, the model may begin with sessions, conversion, average order value, customer acquisition, and repeat purchases.
This method usually gives growing brands the best first operating model because each assumption has an owner and a lever. The trade-off is maintenance. If the model contains too many SKU and channel inputs without clear data ownership, it becomes fragile and difficult to update.
Revenue definitions also matter. Gross sales, discounts, refunds, returns, marketplace deductions, and taxes can produce very different views of performance, so it's useful to review the distinction between net revenue vs gross revenue before building the revenue tab.
Time-series forecasting uses historical patterns to project future values. It can help mature brands account for recurring seasonality, trend changes, and demand patterns that a simple growth assumption would miss.
The method works best when the underlying business is reasonably comparable across periods. A major price change, stockout, product launch, channel shift, or advertising disruption can make historical patterns less reliable. Time-series output should therefore sit beside operational judgment, not replace it.
Cohort-based forecasting groups customers by a shared starting point, such as first purchase month or acquisition campaign, then follows their repeat behavior. It's especially useful for subscriptions, replenishment products, and DTC brands where retention drives a meaningful portion of revenue.
Cohorts expose whether growth comes from acquiring more customers or keeping existing customers active. They're less useful for a purely one-time-purchase business with limited repeat history. For a broader overview of sales projection approaches, this guide to sales forecasting methods offers useful context.
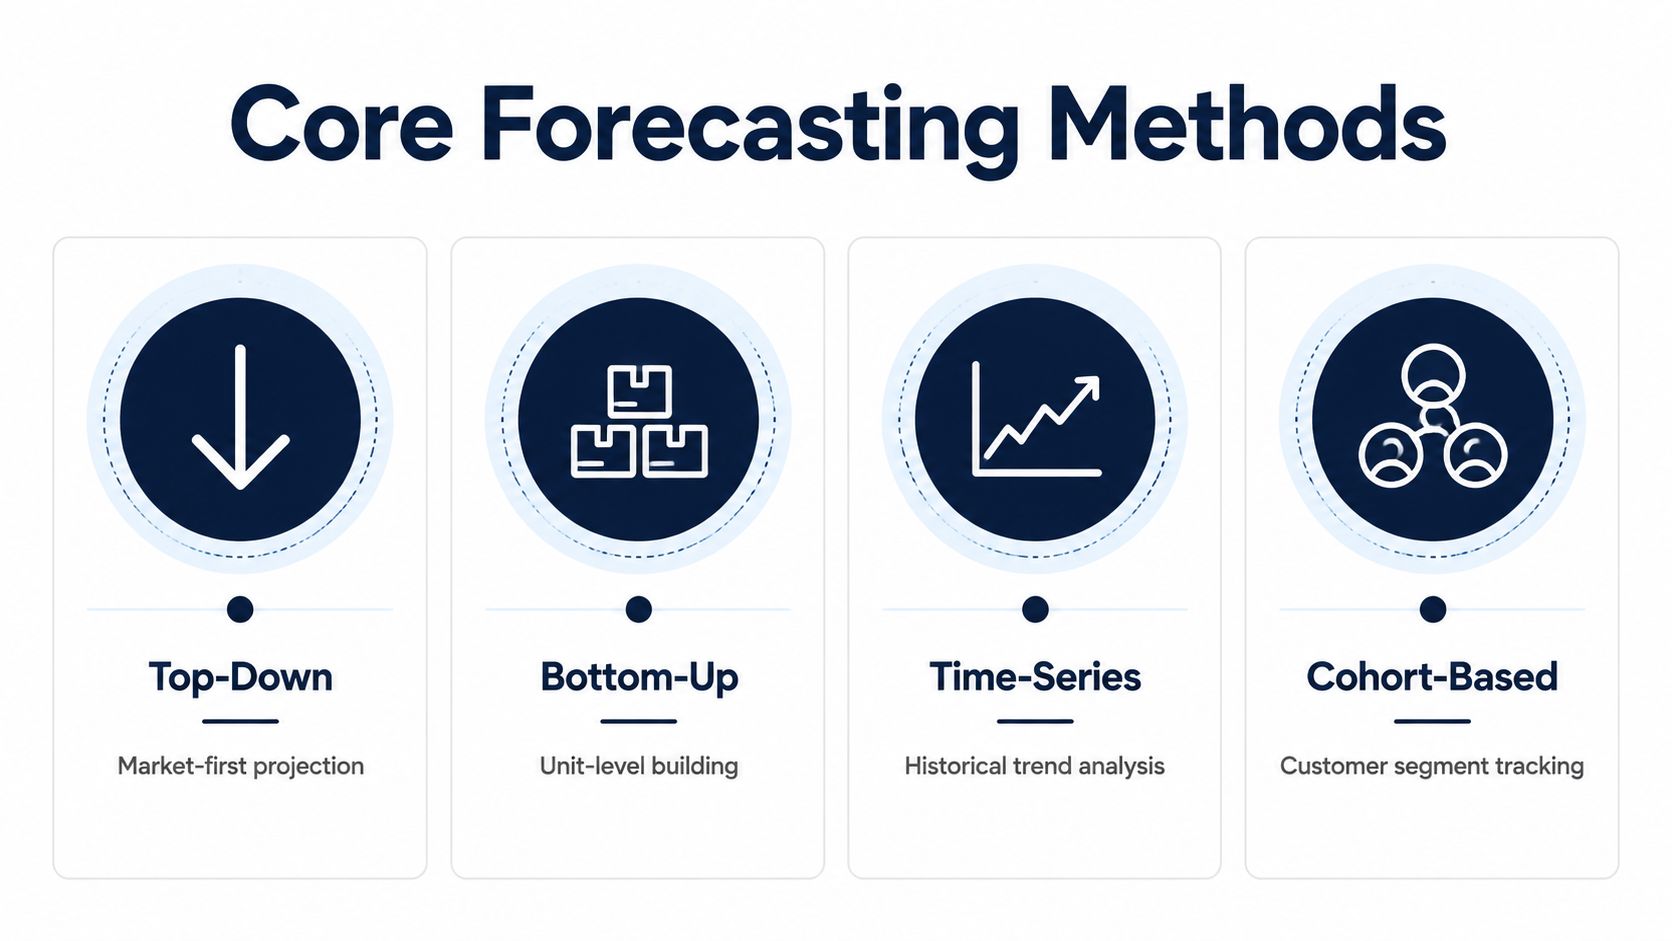
The strongest ecommerce models layer methods rather than choosing one permanently. Bottom-up assumptions can drive the near-term plan, time-series analysis can inform seasonal adjustments, cohort data can estimate repeat revenue, and top-down logic can challenge unrealistic long-term expectations.
A useful forecast doesn't need to begin as a complex planning system. A well-structured spreadsheet can work if the inputs are clear, the formulas are visible, and someone reviews actual results against assumptions.
Define the decision the forecast must support. You might be deciding whether to place an inventory order, increase advertising, hire an operations manager, launch a product, or seek outside working capital.
The decision determines the forecast horizon and level of detail. A purchase-order decision needs SKU-level inventory and cash timing. A hiring decision needs contribution margin and recurring operating expenses. A financing decision may require an integrated view of cash flow, liabilities, and balance-sheet commitments.
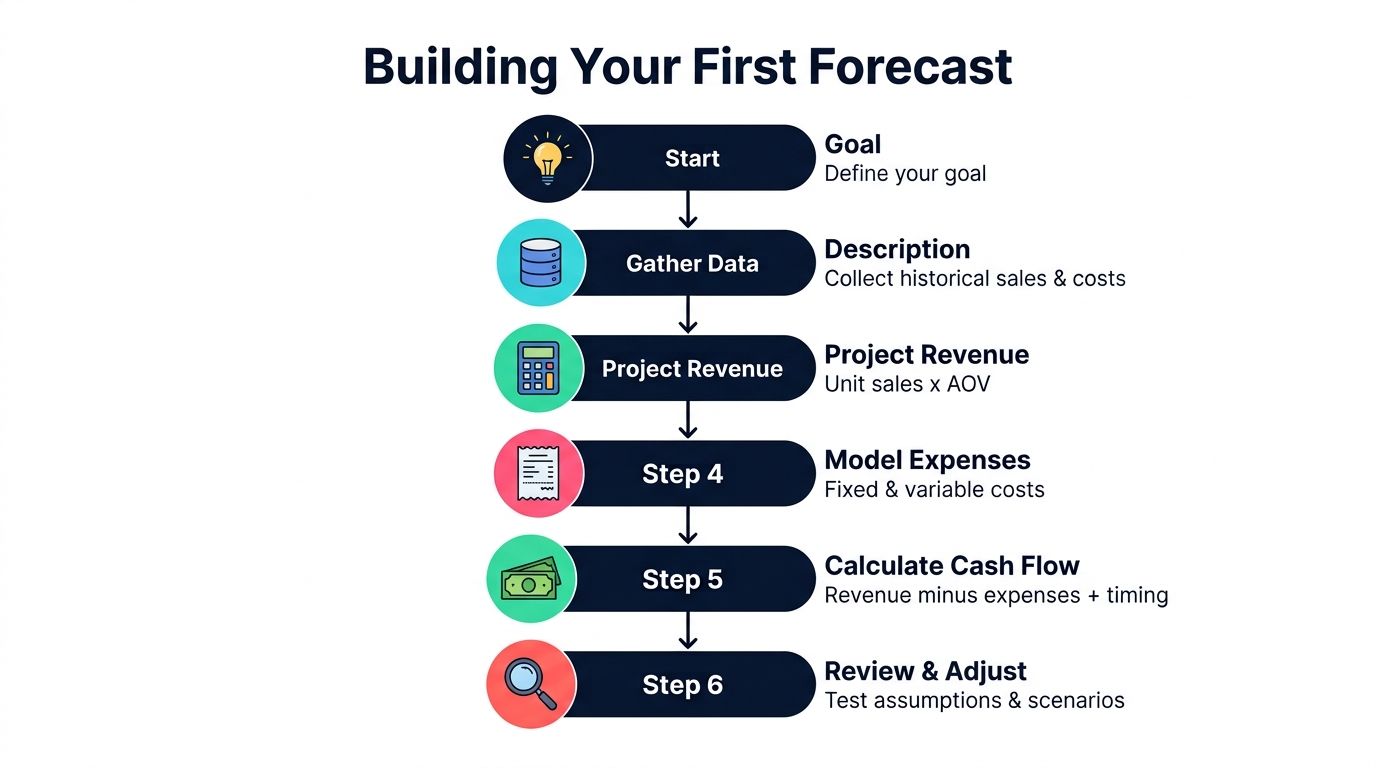
Create a revenue schedule by channel and product. The exact drivers vary, but the structure should make volume visible rather than hiding everything inside a single growth percentage.
Then calculate net revenue using consistent definitions. If one tab uses gross sales and another uses collected revenue after refunds and deductions, the model will create false margin signals.
Product cost is only part of ecommerce COGS. Include freight, duties, prep, fulfillment, storage, and marketplace-related fulfillment charges that belong in the unit economics.
Amazon FBA fees deserve their own line or clearly documented formula because they can change contribution by SKU. DTC brands should separate fulfillment and shipping subsidies from product cost when those expenses behave differently. The objective is to understand the margin generated by each order before fixed overhead.
For a practical explanation of the relationship between revenue, variable costs, and contribution, review what is unit economics. A forecast becomes far more useful when each growth assumption flows through unit economics instead of stopping at sales.
Add PPC, paid social, payroll, contractors, software, commissions, rent, professional services, and planned capital expenditure. Separate fixed costs from variable costs, then identify which expenses scale with orders, revenue, inventory, or headcount.
Next, build the cash layer. Map supplier deposits, production lead times, freight payments, inventory receipts, ad billing, payroll dates, marketplace payouts, card-payment settlement, taxes, and debt service. A model that recognizes revenue in one month but pays the supplier in another must show both events in their actual cash periods.
Many otherwise polished forecasts fail. They calculate profit correctly but don't tell the founder whether the account can fund the next inventory cycle.
Runway is the period your available cash can support planned operating needs under a defined set of assumptions. Don't reduce it to a single headline number. Test how runway changes when sales slow, inventory arrives late, ad spend rises, or gross margin compresses.
Keep an assumptions tab with the source, owner, date, and rationale for every major driver. Then compare forecast to actuals regularly and revise assumptions rather than changing historical results.
For additional practical planning examples, see these real success stories in financial planning. The lesson for ecommerce founders is straightforward: the model should help you decide what to do before the cash pressure becomes urgent.
Here's a visual walkthrough of the forecasting process:
A single forecast creates false confidence. A scenario model gives you a set of conditions and the decisions attached to each one.
Start with a base case built from the assumptions you currently believe. Then create a downside case by changing the drivers that would hurt liquidity or margin, such as slower conversion, higher acquisition cost, weaker sell-through, more returns, lower price, delayed inventory, or reduced marketplace availability. A best case can test what happens if demand accelerates, but don't let it become the plan used to approve every expense.
Forecast accuracy should be measured with defined error metrics. MAPE measures average percentage error magnitude, WAPE weights errors by actual volume, and RMSE gives greater influence to larger misses. Bias measures directional error, showing whether the model repeatedly overstates or understates performance.
A forecast can look acceptable in aggregate while hiding serious SKU or channel errors. Track accuracy by horizon, product, region, and channel where the data supports it. The forecasting error metrics reference explains why magnitude, direction, and persistence should be distinguished.
A revenue miss isn't a diagnosis. Break the variance into price, volume, mix, timing or recognition, and external effects such as foreign-exchange movement or one-off events.
That decomposition tells the operator what action to take. A volume problem may require merchandising or advertising work. A mix problem may require inventory allocation. A timing problem may be a payout or shipment issue rather than a demand issue. A price problem may call for a promotion review or contribution-margin reset.
The available benchmark guidance describes stable mature businesses as often targeting quarter-ahead revenue MAPE in the low single digits to low double digits, while cyclical or launch-heavy businesses face wider error bands. It also identifies persistent consolidated bias beyond roughly ±2–3% as a warning sign, as outlined in this budget versus actual revenue variance guide.
| Business Type | Quarter-Ahead MAPE Target | Bias Warning Threshold | Key Variance Drivers |
|---|---|---|---|
| Stable mature brand | Low single digits to low double digits | Persistent bias beyond roughly ±2–3% | Price, volume, mix, seasonality |
| Cyclical brand | Wider error band | Persistent directional error | Demand cycles, channel mix, timing |
| Launch-heavy brand | Wider error band | Persistent directional error | New-product adoption, advertising, stock availability |
The table gives orientation, not permission to manufacture a target. Your baseline should come from your own forecast-versus-actual history, with exceptions documented rather than concealed. If recurring revenue is part of the model, you can also browse Fi pricing tiers when evaluating tools that support subscription or retention planning.
Revenue and cash operate on different timelines in ecommerce. A business often pays for inventory before the product sells, spends on acquisition before the customer pays, and waits for a marketplace or payment processor to release funds. The cash conversion cycle connects these events, measuring the operating gap between paying for stock and collecting usable revenue from the resulting sale.
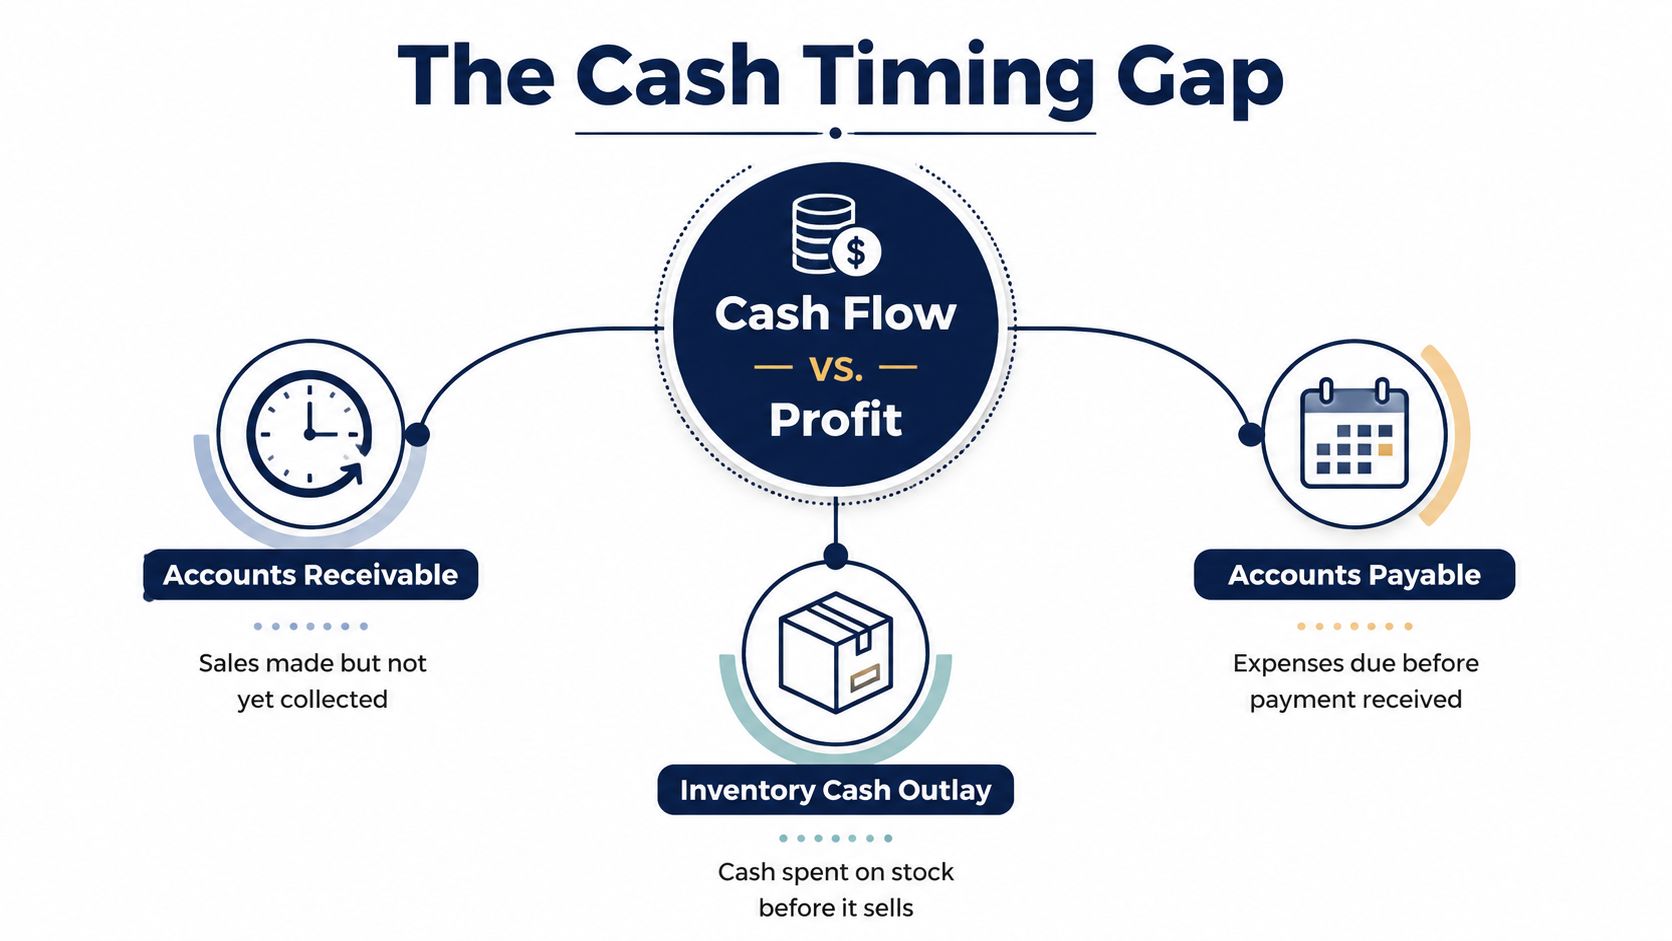
Model inventory as a cash asset alongside its balance-sheet value. Record supplier deposits, production milestones, shipment payments, receipt dates, and the expected sell-through period. If the brand buys deeper to secure availability, the forecast should show the cash tied up before the related sales arrive.
Add payment terms and collection timing for each channel. Amazon and Shopify can settle funds on different schedules, while wholesale or business customers may create receivables. What is days sales outstanding explains one useful receivables-timing measure. Sellers should also track marketplace settlement schedules and payment-processor reserves directly.
Credit-card float can temporarily soften the gap. It does not remove the obligation. Show the statement date, payment date, and the effect of paying down the balance while continuing to fund inventory and advertising.
A cash forecast becomes operational when it triggers decisions. If projected minimum cash falls below the business's chosen safety level, the founder can delay a purchase order, reduce nonessential spend, renegotiate terms, adjust promotions, or arrange capital before the shortage arrives.
Financial forecasting can cover revenue, expenses, cash flow, budgets, and balance-sheet positions. Introductory explanations often focus on future sales, while ecommerce models need cash timing, inventory, and capital requirements as first-class forecast inputs, consistent with this overview of financial forecasting.
A profitable month can fund growth only after the cash conversion cycle releases the money.
Refresh the model as actual payouts, receipts, ad invoices, inventory arrivals, and supplier commitments change. The result is a working liquidity dashboard that helps Amazon and DTC operators decide when to buy stock, fund advertising, or preserve cash. Forecasting then supports operating choices throughout the month rather than sitting as an annual document.
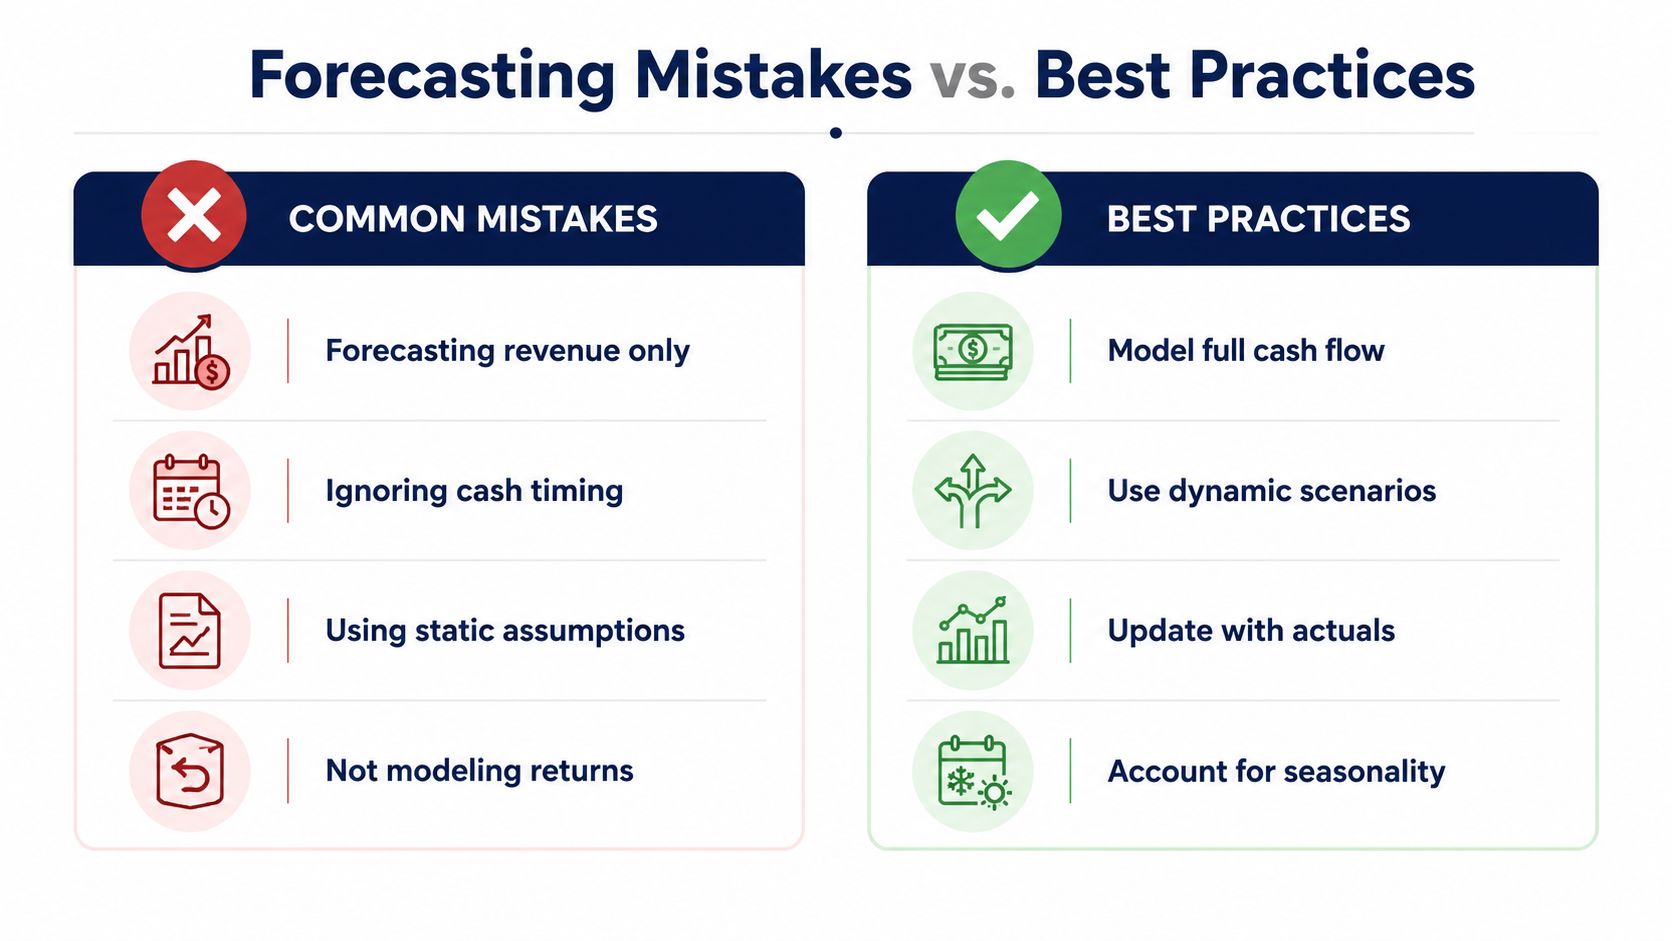
Most forecasting failures don't come from advanced mathematics. They come from leaving important operating realities outside the model.
A seller projects sales and applies a margin percentage, then assumes the remaining amount is available for growth. That approach misses inventory deposits, ad billing, returns, payout delays, and the difference between gross and collected revenue.
Model the full cash movement. Keep a separate P&L view for profitability and cash schedule for liquidity, then reconcile the two.
A forecast becomes stale when the founder sets one conversion rate, one acquisition cost, and one sell-through assumption and never revisits them. Markets change, promotions alter mix, competitors affect advertising costs, and stockouts distort historical demand.
Use driver-based assumptions that can be updated with actual results. A rolling process is more valuable than a polished annual file that nobody trusts after conditions change.
Finance can calculate the model, but operations knows the supplier schedule, marketing knows planned spend, and inventory managers know constraints that may not appear in the ledger. A corporate forecasting survey reported that only 1% of firms hit forecasts exactly over a three-year period, while 22% landed within ±5% of actual results, according to this financial forecasting market report.
The same source describes a Deloitte survey in which 77% of organizations with high cross-functional participation kept forecast revenue variances below 10%, compared with 59% among organizations with lower participation. The practical implication is clear: invite the people who control the drivers into the forecast process.
A forecast isn't a promise or a test of personal optimism. It's a set of assumptions that should become more useful as actual data exposes weak inputs.
Review forecast versus actuals on a fixed cadence, investigate material variances, and record the reason for each change. Include returns, seasonality, stock availability, and timing effects rather than forcing every miss into a generic “sales variance” category.
Start with a simple model you'll maintain. Gather your historical sales, advertising, inventory, supplier, payroll, and operating-expense data, then standardize the definitions before adding formulas.
Use this checklist:
Google Sheets is sufficient for a first version if the file has an assumptions tab, a revenue schedule, a cost schedule, a cash calendar, and a scenario selector. Dedicated planning tools can help later, but software won't rescue unclear definitions or missing timing data.
Build the first version around the next decision, not the perfect model. A forecast that changes an inventory order or prevents an avoidable cash squeeze is already doing its job.
Million Dollar Sellers gives serious ecommerce founders access to a private peer network, strategic discussions, and operating insights from entrepreneurs scaling Amazon, DTC, and omnichannel brands. Visit Million Dollar Sellers to learn how the community can help you pressure-test forecasts, working-capital decisions, and the next stage of growth.
Join the Ecom Entrepreneur Community for Vetted 7-9 Figure Ecommerce Founders
Learn MoreYou may also like:
Learn more about our special events!
Check Events