
Chilat Doina
August 2, 2026
You're staring at three different forecast numbers, and none of them match. The CRM says one thing, the spreadsheet says another, and the number heading to the board is the one you're least confident about. That's usually the moment ecommerce founders realize the problem isn't just the model, it's the handoff between model output, human judgment, and the number that ships.
Forecasting only looks like a math problem from a distance. In practice, it's a governance problem, because bad numbers turn into bad inventory buys, cash flow surprises, and uncomfortable conversations with investors and operators. The useful way to think about sales forecasting methods is not “which one is smartest,” but “which one gives you a number you can defend, maintain, and correct before it hurts the P&L.”
The failure usually starts before anyone runs the forecast. A founder, a RevOps lead, and a finance manager each open a different system, and each sees a slightly different reality. The rep says the quarter is fine. The dashboard says it's soft. The board deck says it's on track, but only if a few large deals land cleanly.
That gap matters because forecasting is supposed to help teams plan demand, budgets, capacity, and inventory. When the number is off, the damage shows up in the places ecommerce feels fastest, too much stock, too little stock, and avoidable scramble inside the operating cadence. Major planning guides warn that disconnected methodologies can leave companies with the wrong inventory posture or inaccurate sales targets, and those mistakes hit the bottom line directly (Anaplan sales forecasting guide).
Practical rule: if three people can explain the forecast three different ways, the business doesn't have a forecasting problem, it has a definition problem.
The accuracy bands tell the same story. Industry comparisons note that gut-feel and rep-submitted forecasts can vary by ±30–40%, while weighted pipeline and stage-based methods improve to ±15–25% accuracy, and more advanced multivariable approaches can reach ±5–15% accuracy (Clari sales forecast methods). That spread is the difference between a number you can use for buying, staffing, and planning, and a number that's mostly a conversation starter.
For ecommerce teams, the recurring pain isn't abstraction. It's the operational whiplash of making decisions from a forecast that wasn't calibrated for promo timing, channel mix, or deal slippage. A forecast that's “close enough” on a slide can still be far enough off to distort the next month of purchasing and the next board call.
Every forecasting method lives in one of two families, even if vendors dress it up with fancy labels. The first family is qualitative forecasting, which leans on judgment, rep input, and expert opinion. The second is quantitative forecasting, which leans on historical data, patterns, and measurable relationships between variables (Salesforce forecasting methods guide).
Qualitative forecasting answers a simple question, what do the people closest to the deals think will happen? In pipeline terms, that usually means a rep or manager assigns a probability to each stage, then the forecast multiplies deal value by that probability. It's fast, intuitive, and useful when the data is thin or the market is changing too quickly for history to be trusted.
The weakness is just as simple. Human judgment is useful, but it's also where optimism, sandbagging, and inconsistent stage definitions creep in. That's why gut-feel forecasts can swing so hard, and why the same pipeline can produce very different numbers depending on who's submitting it.
Quantitative forecasting starts from recorded performance. A historical method might ask, “What did we sell in prior periods, and what does that suggest now?” A time-series method asks a more refined version of the same question, “What patterns repeat in the data, and how should we extend them forward?” A regression or multivariable model goes further and asks which factors move the number.
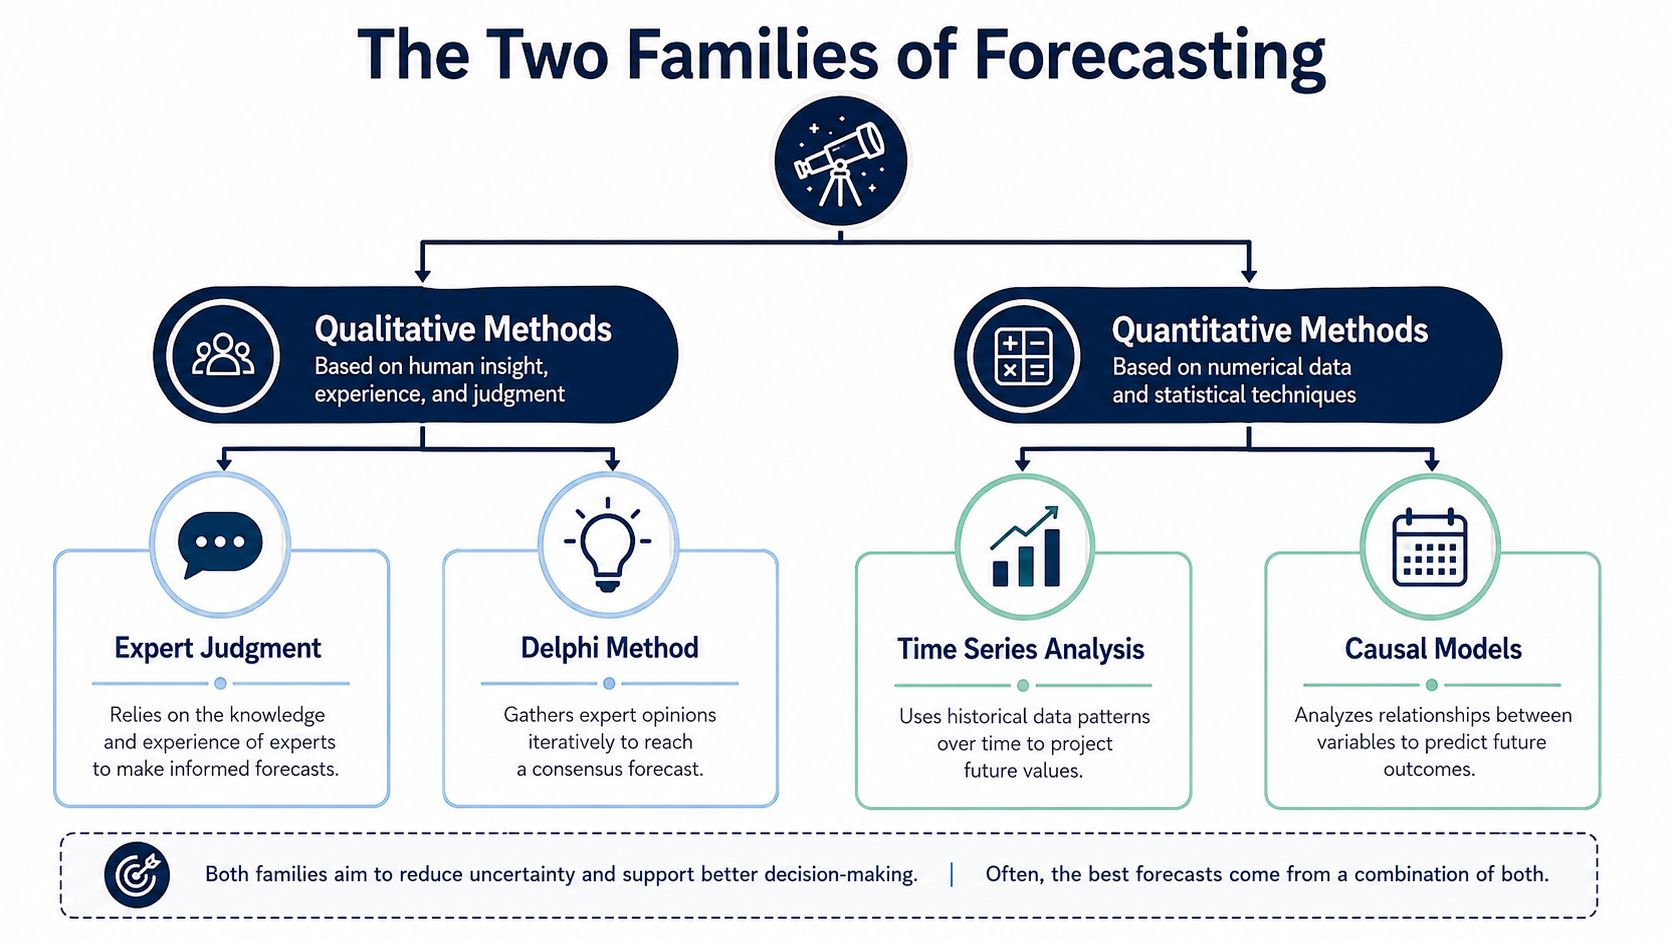
The key advantage of quantitative methods is that they force the forecast to explain itself. Instead of asking whether a rep feels good about a deal, you ask whether the data supports the assumption. That doesn't remove judgment, but it moves the judgment to the right place, deciding which variables matter and where overrides are justified.
A good forecast is rarely pure math or pure instinct. It's a controlled argument between the two, with a written reason for every override.
The shift away from intuition toward pipeline- and probability-based methods is what made forecasting measurable instead of mystical. Once teams can separate a subjective guess from a weighted, historical, or multivariable forecast, they can finally compare methods on accuracy rather than confidence.
The quantitative workhorses do different jobs, and ecommerce teams usually need all three at different stages of maturity. Time-series forecasting is the cleanest baseline, because it relies on prior sales history to project the next period. Regression and other causal models try to explain sales through variables like price, promotions, and channel behavior. Machine learning is the heaviest tool in the stack, and it's best when you've got enough clean data to let the model learn patterns across many signals.
| Method | Data Required | Typical Accuracy Band | Best Ecommerce Fit |
|---|---|---|---|
| Time-series forecasting | At least 12 months of historical sales data, with repeatable patterns | Baseline method, accuracy depends on stability rather than complexity | Stable demand, established SKUs, recurring seasonality |
| Regression and causal models | Historical data plus drivers like price, promo timing, channel mix, and other measurable variables | Better than simple historical methods when relationships are real and cleanly captured | Teams with clear promo calendars, pricing changes, and multiple demand drivers |
| Machine learning | Larger, cleaner datasets with enough history to train on many signals | Strongest when data quality, coverage, and governance are in place | SKU-heavy catalogs, fragmented behavior, and large enough data sets to support training |
The most dependable baseline is still historical and time-series forecasting, because it uses repeatable patterns in prior sales data and often needs at least 12 months of history to identify seasonality and cycles (Salesforce methods guide). That's why many teams start there before they add complexity. It's not glamorous, but it's usually the first model that makes the forecast feel anchored.
Regression is where ecommerce teams begin to ask better questions. If price changes, promo intensity, or channel mix move demand, a causal model can capture those relationships in a way a plain average can't. The trade-off is that it only works when the inputs are consistent and the team tracks them well.
Machine learning is often pitched as the upgrade path, but it's not magic. It's strongest when there's enough clean historical data and when the business can keep feeding the model reliable signals. If the inputs are noisy, the model can look advanced while just reproducing the noise faster.
A practical way to think about the three is this, time-series gives you a baseline, regression explains drivers, and machine learning handles complexity once the data foundation is solid. Most ecommerce teams don't need to start at the hardest model. They need to start at the level their data can support.
The right method is the one your data can sustain without heroic manual cleanup. A seven-figure DTC brand with a few hero SKUs doesn't need the same model stack as a marketplace operator with thousands of catalog lines and multiple acquisition channels. The question is less “what's best in theory” and more “what can survive the messiness of your actual operating data.”
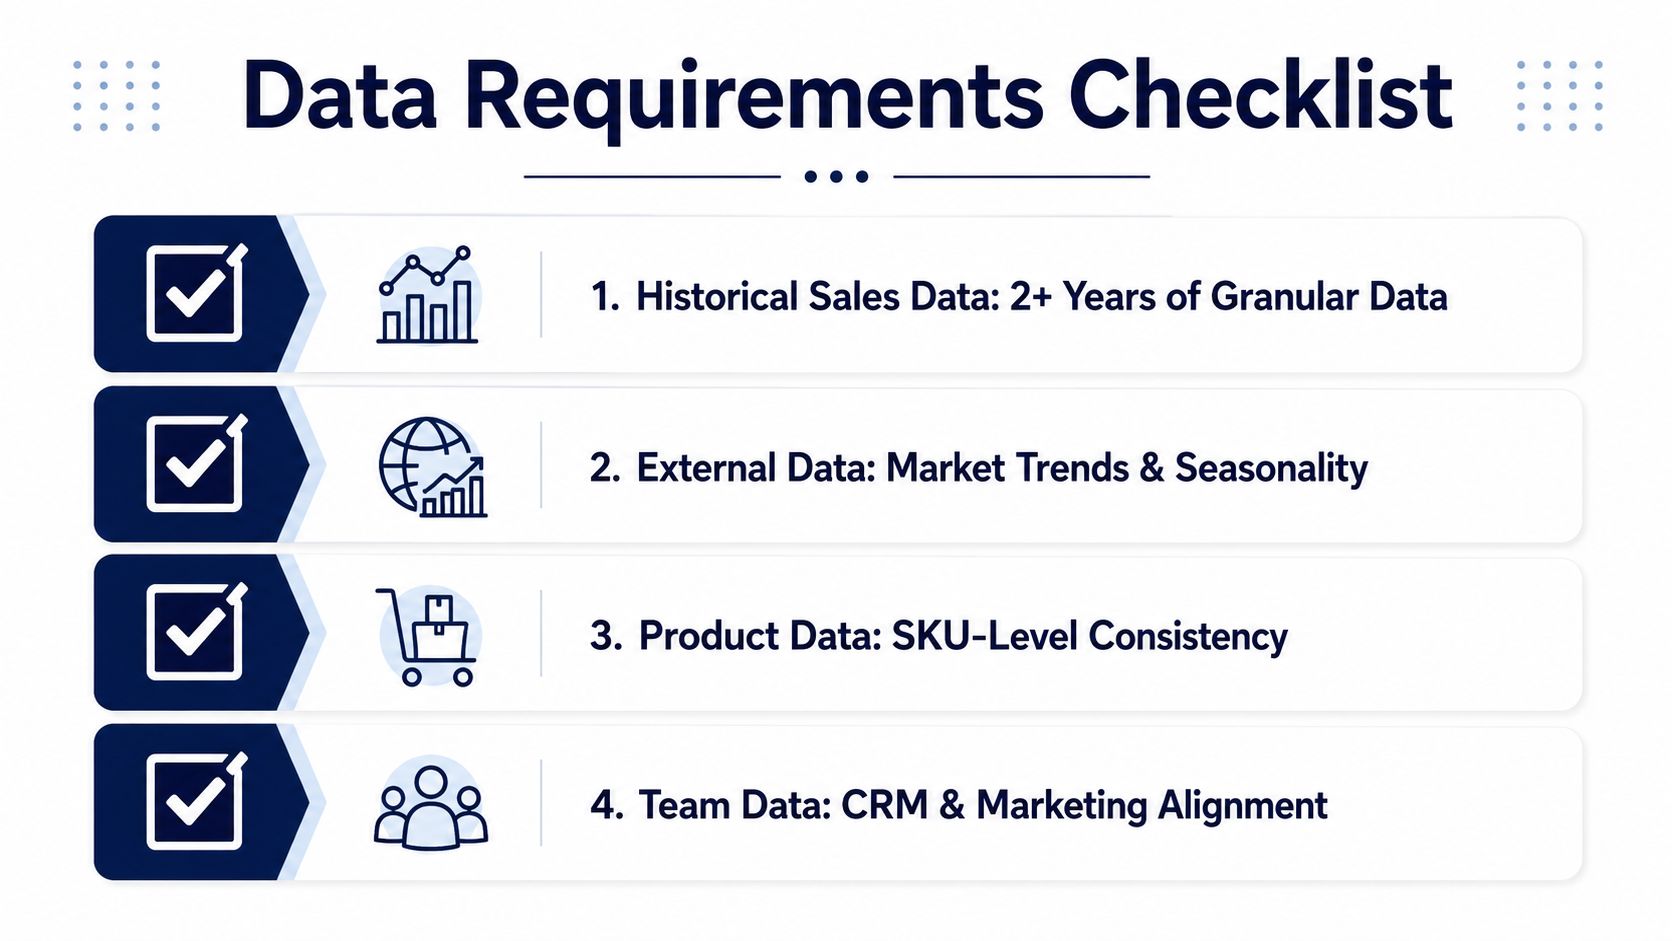
Time-series and historical methods need enough consistent history to show patterns. If your product mix is changing every few weeks, the past won't be a clean guide to the next quarter. That's where ecommerce teams often outgrow a simple baseline before they outgrow their headcount.
SKU-level consistency matters because forecasts break when the unit of analysis is unstable. If you group too many different products together, you flatten the signal. If you split too finely without enough history, you end up with noise.
Regression and causal models need more than sales history. They need usable inputs, like promo timing, pricing changes, and channel mix, and those inputs have to be maintained well enough that the model can trust them. If your promo calendar lives in one place and your spend data lives somewhere else, the model is only as good as the weakest handoff.
For teams building a real operating stack, data architecture starts to matter. The forecast can't be more reliable than the systems feeding it, and the relationship between warehouse design and forecasting discipline is worth understanding in practice, especially if your data is scattered across platforms. A useful reference is this overview of inventory forecasting methods, because inventory and revenue forecasts usually fail for the same reason, weak inputs.
Practical rule: if a person has to manually reconcile every source before the forecast runs, the model is already too advanced for the process.
A simple self-test helps. If you have clean monthly history, stable SKU definitions, and mostly repeatable demand, start with time-series. If you also have reliable drivers and the team can maintain them, move to regression. If the business has enough clean data across many signals, then machine learning starts to become realistic rather than aspirational.
Selection matters less than implementation discipline. A good model that nobody trusts will still lose to a simpler model that gets reviewed, challenged, and corrected on time. That's why forecasting has to be treated like an operating process, not a one-time modeling exercise.
A cash forecast, an inventory forecast, and a board forecast don't need the same level of granularity. If the number is going to drive buying decisions, it needs tighter controls than a high-level growth view. The use case should decide the method, not the other way around.
Check whether history, channel data, promo data, and inventory signals are usable. Missing or duplicated records will matter more than model choice. If the team can't explain where the data comes from, the forecast will drift quickly.
Start with the baseline that matches the data maturity. That usually means historical or time-series methods first, then regression, then machine learning if the coverage justifies it. More complexity only helps when it adds signal, not noise.
The baseline should be understandable by finance and operations, not just by the person who built it. Every assumption needs a reason, especially if the forecast depends on promo timing, seasonality, or channel shifts. That record is what makes later overrides defensible.
Promotions, launches, and supply shocks rarely fit a pure statistical model. Handle them as explicit overlays instead of letting them distort the core forecast. That keeps the baseline honest and the exception visible.
A parallel run catches the gaps between what the model says and what the team believes. It also exposes whether the number changes because the data changed or because the process changed. For teams that want the planning layer to hold together, a clear data flow helps, and this guide to what data warehouse architecture is is a useful companion when the stack starts getting fragmented.
The operational rule is simple. Don't go live until the model, the owner, and the override policy are all clear.
If you can't name who approves an exception, you don't have a forecast governance process yet.
AI helps most when the business has enough clean history for the model to learn from, and when the forecast team can monitor where it's right or wrong. It's not automatically better than rep judgment. It's better in the segments where pattern recognition beats instinct, and worse in segments where the market is shifting too fast for the past to be a clean guide.
A lot of teams make the same mistake, they treat AI as a replacement for governance instead of a tool inside governance. The core question isn't whether the model is smart. It's who owns the number, what happens when the rep disagrees, and how often the team checks for model drift or channel-specific bias.
If a segment has clean history, repeatable demand, and enough volume to produce a reliable pattern, model output should carry more weight. The model is usually strongest where the rep's personal intuition adds little beyond confidence. That's especially true in recurring or well-instrumented portions of the business.
New launches, promo shocks, or abrupt channel changes can make the model stale fast. In those cases, a human override is useful if it's documented and reviewed against actual outcomes later. The goal is not to trust humans more, it's to trust the segment-specific evidence more.
One blended forecast can hide where the model is failing. Segment-level accuracy tells you whether the problem sits in a product line, a channel, or a customer cohort. That's where governance becomes real, because you can decide where automation helps and where it just magnifies bias.
For operators who want a practical ecommerce example of how AI can support, but not replace, judgment, this resource on boost Shopify sales with AI is worth reading. It's most useful as a reminder that automation works best when someone still owns the outcome.
The counterintuitive lesson is that more automation doesn't always mean better accuracy. AI should earn trust by segment, by outcome, and by consistency over time. If it can't do that, the rep isn't the problem.
Most forecast misses trace back to the same few failures. Clean data gets ignored. Promo shocks get treated like noise. Channel bias gets averaged away. And the team keeps using one blended number when the business really needs several smaller ones.
The right KPIs make those failures visible. A founder doesn't need a dashboard full of vanity metrics, just enough signals to know whether the process is getting better or drifting.
If you want a broader ecommerce KPI framework to pair with forecasting, this guide to key performance indicators for ecommerce is a useful companion. Forecasting is stronger when it sits inside a bigger measurement system, not on its own.
How often should a forecast be updated?
As often as the business changes materially. Faster-moving businesses need tighter review cycles than stable ones, especially when promotions, launches, or channel shifts are common.
What if the model disagrees with the rep?
Treat it as a governance issue, not a personality issue. Compare the segment history, review the override reason, and decide who owns the final number before it goes to leadership.
Which method should a newer brand start with?
Start with the simplest method your history can support. If the data is thin, a clean baseline is better than a complex model built on weak inputs.
When does AI become worth it?
When the team has enough clean history, enough data discipline, and enough complexity that segment-level pattern recognition improves decisions.
The best forecast is the one your team can explain, update, and use without drama. If you want to see how serious operators think about forecasting, planning, and execution at the highest level, explore Million Dollar Sellers.
Join the Ecom Entrepreneur Community for Vetted 7-9 Figure Ecommerce Founders
Learn MoreYou may also like:
Learn more about our special events!
Check Events