Chilat Doina
September 15, 2026
Your quarterly P&L looks healthy until you isolate shipping. Then the problem appears: base postage is reasonable, but residential fees, delivery-area charges, address corrections, dimensional adjustments, packaging, returns, and warehouse labor have turned every order into a margin leak.
Most shipping optimization advice starts with rate negotiation. That's backwards. Surcharges, package dimensions, and routing rules usually determine whether a discounted carrier contract improves profit. Start with the invoice, build a landed-cost view, and only then decide whether to change carriers, packaging, fulfillment, or service levels.
A serious shipping audit begins with the carrier invoice, not the sales rep's rate sheet. Export every shipment and map each charge to an order, SKU, destination, service level, package dimensions, billed weight, and fulfillment location. Your objective is to replace “average shipping rate” with the amount each order really costs to ship.
The first pass should be surcharge-first. Review address-correction, residential, delivery-area, fuel, large-package, additional-handling, and dimensional-weight charges before you spend time negotiating the base rate. These fees often affect specific lanes or package types, so an attractive published discount can hide poor economics on the orders you ship most often.
Use this formula for every shipment:
Base rate + fuel surcharge + accessorial fees + dimensional-weight adjustment + packaging + returns allocation + fulfillment labor
Then divide total shipping cost by the number of orders shipped. Keep the calculation segmented by carrier, zone, service, SKU family, and package type. A blended average is useful for trend monitoring, but it's too blunt for deciding which contract or box specification to change.
Ask the same question of every invoice line:
What operational event created this charge, and can we prevent it, price it into the product, or contractually cap it?
For each surcharge category, set an internal renegotiation threshold based on its share of total ship cost and its controllability. Don't wait for a universal benchmark. If a fee category is material to your own margin, recurring, and concentrated among your top orders, it deserves action. A delivery-area charge that appears repeatedly on profitable rural lanes may justify regional coverage. A dimensional adjustment tied to one oversized carton points to packaging, not carrier selection.
Run the audit across a clean 30-day shipment sample, then validate the findings against a broader invoice history. Separate unavoidable charges from preventable ones. A fuel charge may require contract protection, while a residential fee may require a different carrier, checkout rule, or fulfillment node.
For practical packaging and process ideas, the PledgeBox shipping tips provide a useful complement to invoice analysis. For a small-business perspective on reducing costs across the fulfillment process, compare your findings with this guide to reducing shipping costs for small businesses.
| Line Item | % of Total Ship Cost | Variance vs Industry Benchmark |
|---|---|---|
| Base transportation | Measure from invoices | Compare by lane and service |
| Fuel surcharge | Measure from invoices | Compare contract treatment |
| Residential and delivery-area fees | Measure from invoices | Compare by destination mix |
| Dimensional and additional-handling fees | Measure from invoices | Compare by carton and SKU |
| Packaging materials | Measure from purchase records | Compare by package family |
| Returns and labor allocation | Measure internally | Compare against contribution margin |
The audit should end with three ranked leaks, not a spreadsheet nobody uses. That ranking makes later decisions defensible. You'll know whether to fix the box, renegotiate the contract, change the fulfillment model, or route specific orders elsewhere.
Fulfillment decisions should follow operating reality, not platform marketing. FBA, FBM, and 3PL models each trade control for reach, fixed cost, speed, and complexity. The right answer can change as order volume, SKU breadth, return behavior, and peak demand change.
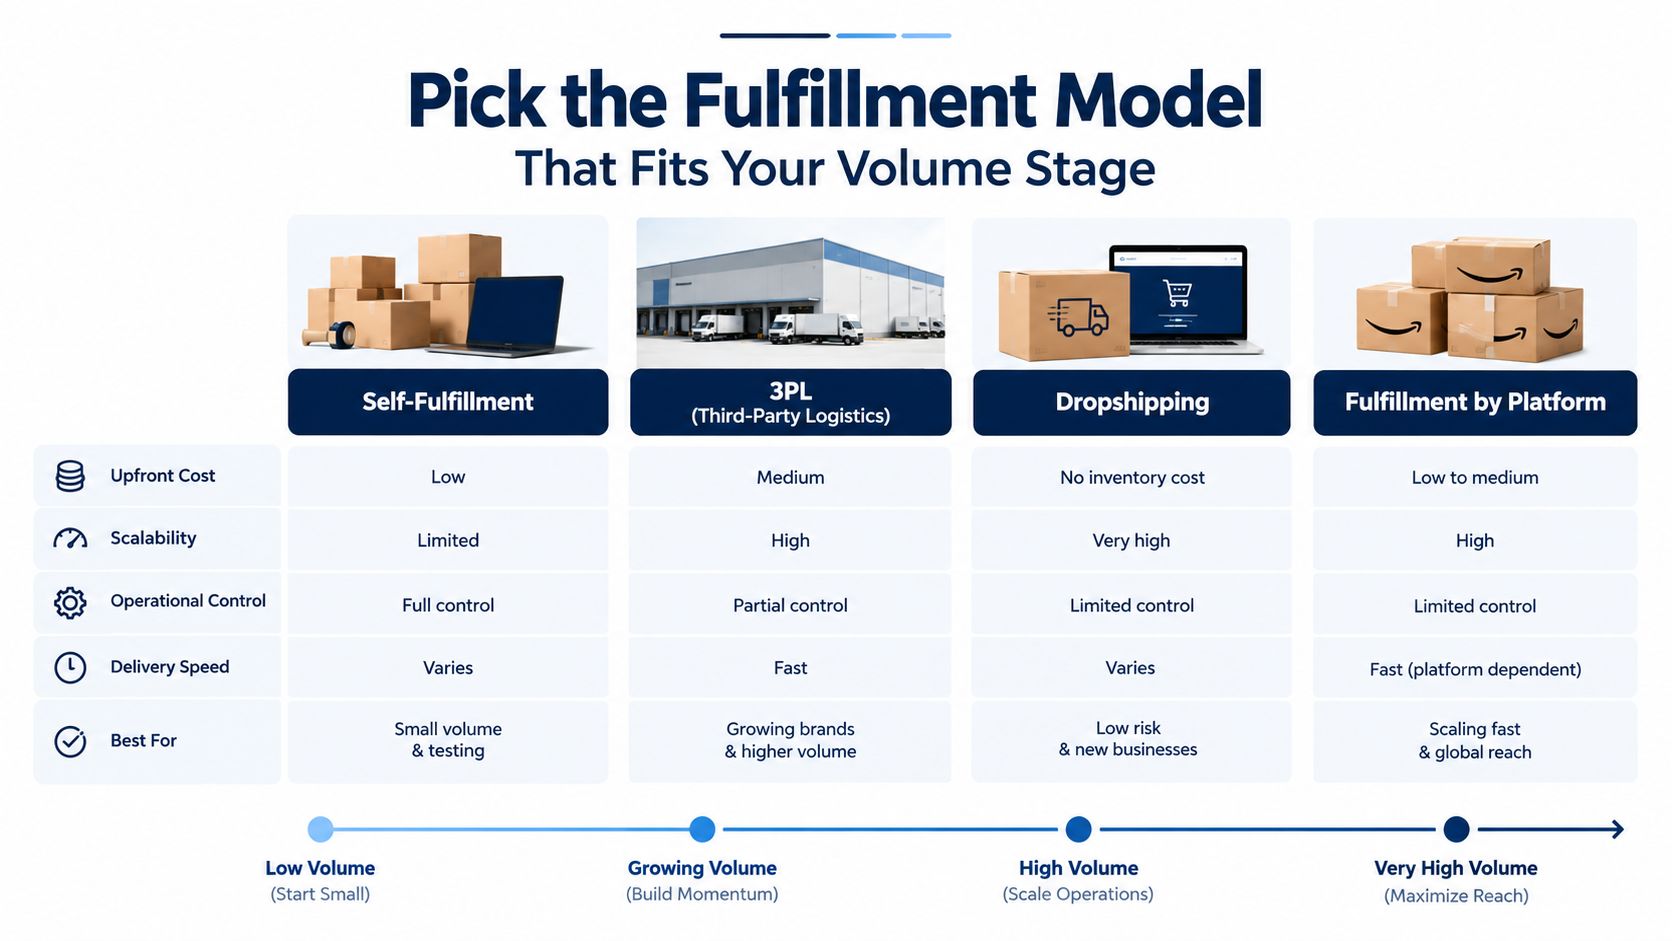
At lower volume, FBM often wins because you keep fixed costs low and maintain direct control over inventory, packaging, customer experience, and carrier choice. The tradeoff is labor. Once the founder or a small team spends its day picking, packing, printing labels, and processing returns, fulfillment becomes a growth constraint rather than an advantage.
FBA can make sense when marketplace conversion, Prime eligibility, and customer expectations justify the fees. It's a poor default for slow-moving, bulky, fragile, or highly variable inventory. Inbound preparation, storage, aged-inventory exposure, stranded SKUs, and removal decisions can erode margin long before the headline fulfillment fee becomes the obvious problem.
Think in stages rather than arbitrary volume promises.
A 3PL contract becomes a margin lever only when you negotiate the details. Review storage billing, minimum monthly charges, receiving fees, kitting, packaging material markups, return processing, inventory adjustments, account-management fees, peak surcharges, and exit terms. Ask for invoice-level transparency and a service-level remedy when orders miss the promised ship window.
Use this practical explanation of what 3PL fulfillment means to pressure-test provider proposals. Your decision model should include monthly orders, average SKU cube, peak-to-baseline spread, return rate, channel mix, and required delivery promise. If a provider can't show how those inputs change your landed cost, it's selling capacity, not optimization.
Carrier negotiations fail when the shipper brings a projected volume story instead of clean shipment evidence. Build a scorecard from 90 days of invoice data, normalized by service level, zone, weight band, destination type, package dimensions, and surcharge category. Compare UPS, FedEx, and USPS on landed cost, not list rate.
Your scorecard should show what each carrier costs for the shipments you tender. A carrier with the lowest two-day headline rate may lose once residential fees and dimensional adjustments are included. A second carrier may look more expensive overall but win decisively on specific zones, weight bands, or package profiles.
Base-rate discounts are only one part of the negotiation. Put these items on the agenda:
Use a direct script with the carrier representative:
“Here is our actual landed cost by zone, service, package profile, and surcharge category. We'll shift the lanes where your economics win, but we need protection on dimensional adjustments, residential exposure, and future rate increases. Show us the contract language, not a promotional discount.”
Run competitive negotiations in Q3, when you still have time to test labels, pickups, manifests, and exception handling. Waiting until Q4 leaves you negotiating under operational pressure, with fewer opportunities to validate the new setup.
Your fallback is credible carrier diversification. Tell each carrier which shipment profiles it can win, then route a controlled portion of volume according to agreed rules. The U.S. Department of Transportation's FLOW program, publicly described on October 24, 2024, shows the broader direction of logistics toward shared operational intelligence. FLOW combines purchase-order information with logistics supply, demand, and throughput data from carriers, ports, terminals, and railways, giving participants a daily aggregated view of network conditions and shared TEU data.
Your contract should protect against the exact volatility that caused the audit. Review general-rate-increase language, fuel clauses, rebate triggers, dimensional rules, surcharge caps, and termination rights with the same care you give the discount schedule.
Packaging is a pricing input. Treating it as a branding decision is expensive, especially when a small dimensional change moves a package into a different billed-weight bracket.
Carriers calculate dimensional weight from the package's outside dimensions and a carrier-specific divisor, then compare that result with actual weight. The billed basis is determined by the carrier's rules. That means a lightweight product in a large carton can cost more to ship than a heavier product in a compact carton.
Start with the highest-volume SKUs, not the products that are easiest to redesign. Pull the top 20 SKU and carton combinations, then compare actual weight, billed weight, outer dimensions, damage rate, void fill, and return condition. A one-inch reduction in carton height can matter when it lowers the calculated dimensional weight or removes an additional-handling trigger, but validate the result against the carrier's current billing rules before changing every box.
Apparel usually deserves a compact polybag or flexible mailer when the product can tolerate compression and moisture protection. Supplements often benefit from a small, stable carton or mailer that prevents empty cube without sacrificing tamper protection. Fragile products need a different test, because reducing carton size without maintaining protective clearance can increase damage and replacement cost.
Compare a 12 x 12 x 12 carton with a 10 x 8 x 6 carton only when the product, protective materials, and carrier rules make the substitution legitimate. Don't claim savings from a smaller box until you test billed weight, handling fees, damage, pack time, material cost, and returns. A package that ships cheaply but arrives broken is not optimized.
Zone skipping can reduce long-distance movement by injecting freight closer to the customer through a regional carrier or consolidator, then handing off to the final-mile network. It's most relevant when order density supports repeatable lanes and when shipments frequently travel through distant zones. The operating tradeoff is added planning, minimum volume requirements, and potential loss of flexibility.
| Current Box | Optimized Box | DIM Weight Change | Est. Cost Impact per Package |
|---|---|---|---|
| Oversized apparel carton | Flexible mailer or compact carton | Recalculate from outer dimensions | Validate from invoices |
| 12 x 12 x 12 carton | 10 x 8 x 6 carton where product allows | Recalculate billed basis | Test by lane and service |
| Large supplement carton | Right-sized stable mailer | Recalculate billed basis | Validate with surcharge report |
| Protective fragile-goods carton | Smaller engineered protective pack | Recalculate after drop testing | Include damage and returns |
Review box specifications monthly. Packaging vendors, product assortments, and carrier rules change. Your shipping optimization program should keep a live link between product dimensions, carton selection, billed weight, and contribution margin.
Multi-carrier shipping isn't automatically efficient. Without explicit rules, it creates label errors, inconsistent tracking, confusing support workflows, and accidental use of expensive services.
The simplest model is one primary carrier with negotiated rates. It's easy to train, easy to reconcile, and easy to explain to customer service. Its weakness is concentration risk. One carrier's pickup failure, capacity issue, surcharge change, or weak lane performance affects the entire network.
A rules-based multi-carrier model gives you more control. Use a TMS, shipping platform, or Shopify-compatible application to select the carrier from origin ZIP, destination zone, package weight band, promised service level, package dimensions, and lane-level delivery performance. Don't route on price alone. A cheaper service that misses the checkout promise can cost more through support contacts, refunds, cancellations, and repeat-purchase damage.
| Routing Strategy | Cost Profile | Delivery Consistency | Operational Complexity |
|---|---|---|---|
| Single carrier with negotiated rates | Predictable if the contract is strong | Vulnerable to carrier-specific issues | Low |
| Rules-based multi-carrier selection | Can reduce cost on targeted lanes | Depends on clean rules and monitoring | Moderate |
| Regional injection | Attractive on dense, longer-distance lanes | Coverage and handoff dependent | High |
Regional carriers such as OnTrac, LaserShip, and LSO can beat national ground services when they have strong coverage in the destination lane, reliable pickup windows, and a package profile they price well. Validate each lane from your own invoice history. Don't assume a regional label is cheaper because the carrier markets itself as regional.
USPS can remain a smart option for lightweight parcels, especially when package dimensions, destination type, and service expectations align. The decision should come from all-in cost and delivery performance, not a blanket rule about package weight.
The Federal Highway Administration's Freight Performance Measure Primer frames freight performance as a network issue involving travel time, reliability, safety, infrastructure, and congestion. That perspective matters for parcel routing too. Review the lane, not just the carrier.
For practical last-mile process design, use this resource on last-mile delivery solutions as a reference point. Your routing rules should have a primary option, a fallback option, and an escalation owner.
A routing engine only works when the team reviews exceptions. Start with the highest-volume zones and product profiles, then expand after the system proves it can preserve the checkout promise.
Total shipping spend is a finance number, not an operating diagnosis. A rising order count can make spend increase while unit economics improve, and a flat average rate can hide growing surcharge exposure. Your dashboard needs metrics that connect invoice behavior to margin and customer experience.
Cost per order shipped
Total transportation, surcharge, packaging, labor, and returns allocation divided by orders shipped. Use the blended figure for trend analysis, then segment it by carrier, zone, SKU, and service.
Actual versus billed weight
Compare the product and package's measured weight with the carrier's billed basis. Repeated gaps can reveal dimensional-weight exposure, measurement errors, or invoice disputes.
On-time delivery rate
Divide orders delivered within the promised window by total delivered orders. Track this by carrier, zone, service level, and fulfillment location so a strong overall result doesn't hide a weak lane.
Surcharge exposure
Divide surcharge cost by total shipping cost. This shows whether margin pressure comes from transportation rates or from accessorial behavior that packaging, routing, address quality, or contract terms can change.
Return-to-sender rate
Divide shipments returned to your operation by total shipments tendered. Investigate address quality, label generation, carrier handoff, delivery attempts, and customer-facing address capture.
The Federal Highway Administration's freight framework supports this network-level view because reliability and delay belong beside cost in a useful operating scorecard. At fleet scale, the BCG Shipping Benchmark Initiative uses data from more than 3,000 commercial vessels worldwide and more than 4,000 vessels in total, with benchmarks across 20+ categories covering operating cost and carbon emissions. The lesson is practical: benchmark continuously, isolate outliers, and don't optimize a lane without comparing it with the broader fleet baseline.
Assign one owner. Refresh the dashboard weekly. Escalate when a metric crosses a threshold you set in advance, such as a sudden billed-weight mismatch, a surcharge category becoming material, or an on-time decline on a high-volume lane.
Every escalation needs an action and a deadline. Finance can dispute invoices, operations can change a carton, the transportation manager can adjust a routing rule, and customer experience can revise a promise that the network can't reliably meet. If the team waits for quarter-end, the dashboard has become a historical report instead of a control system.
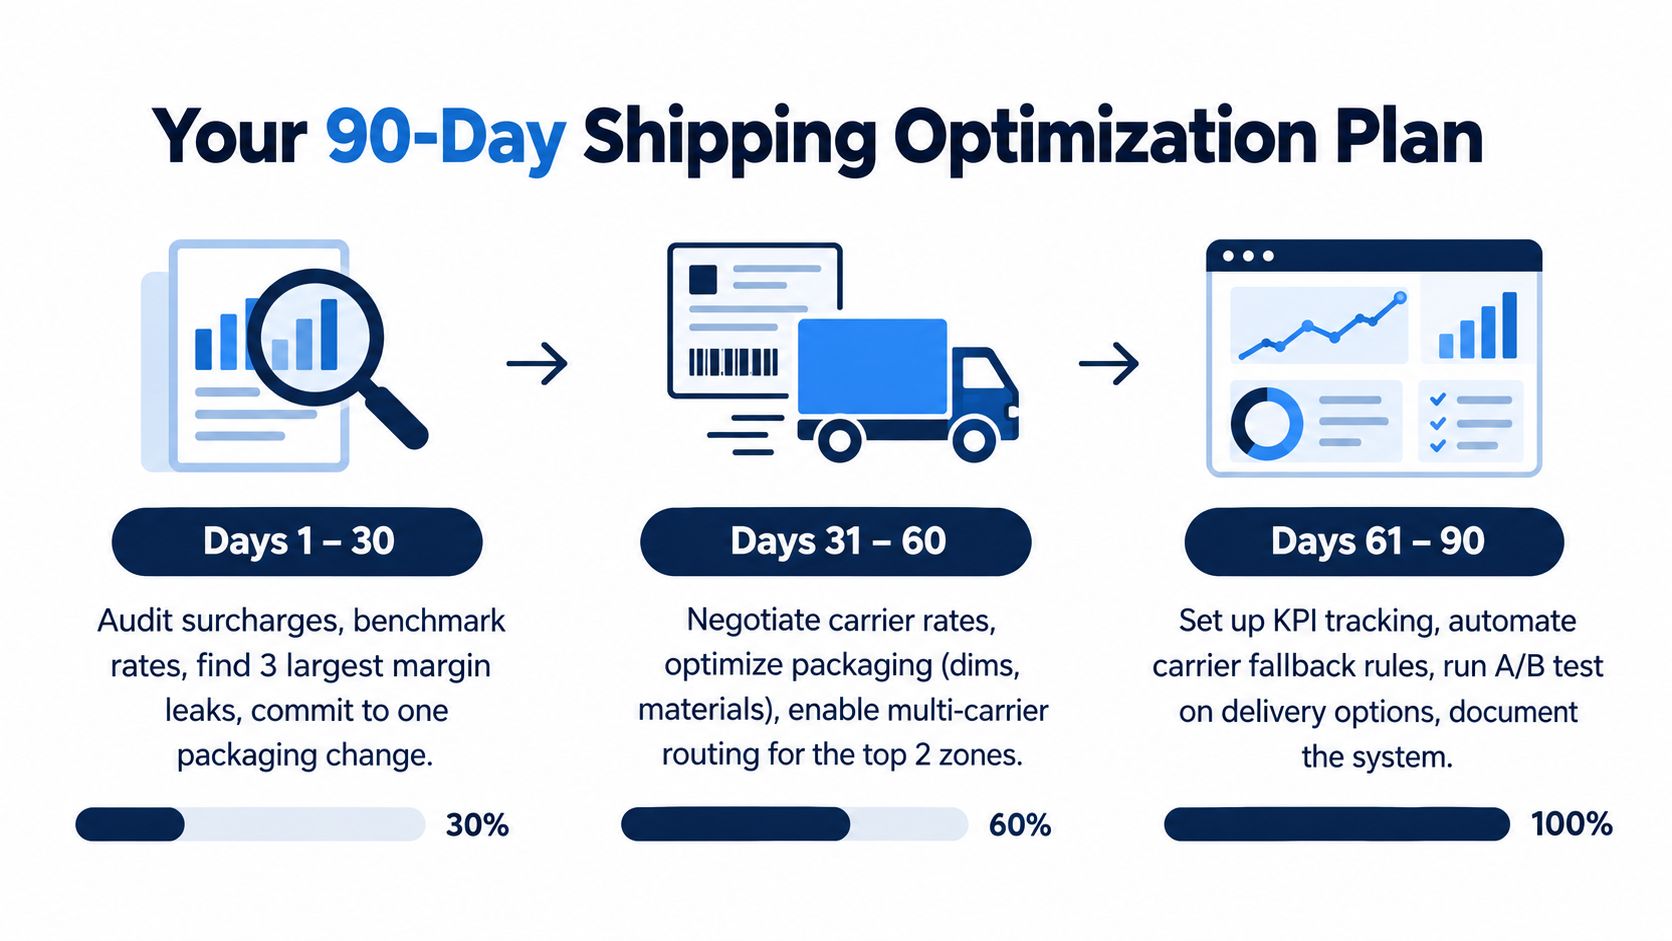
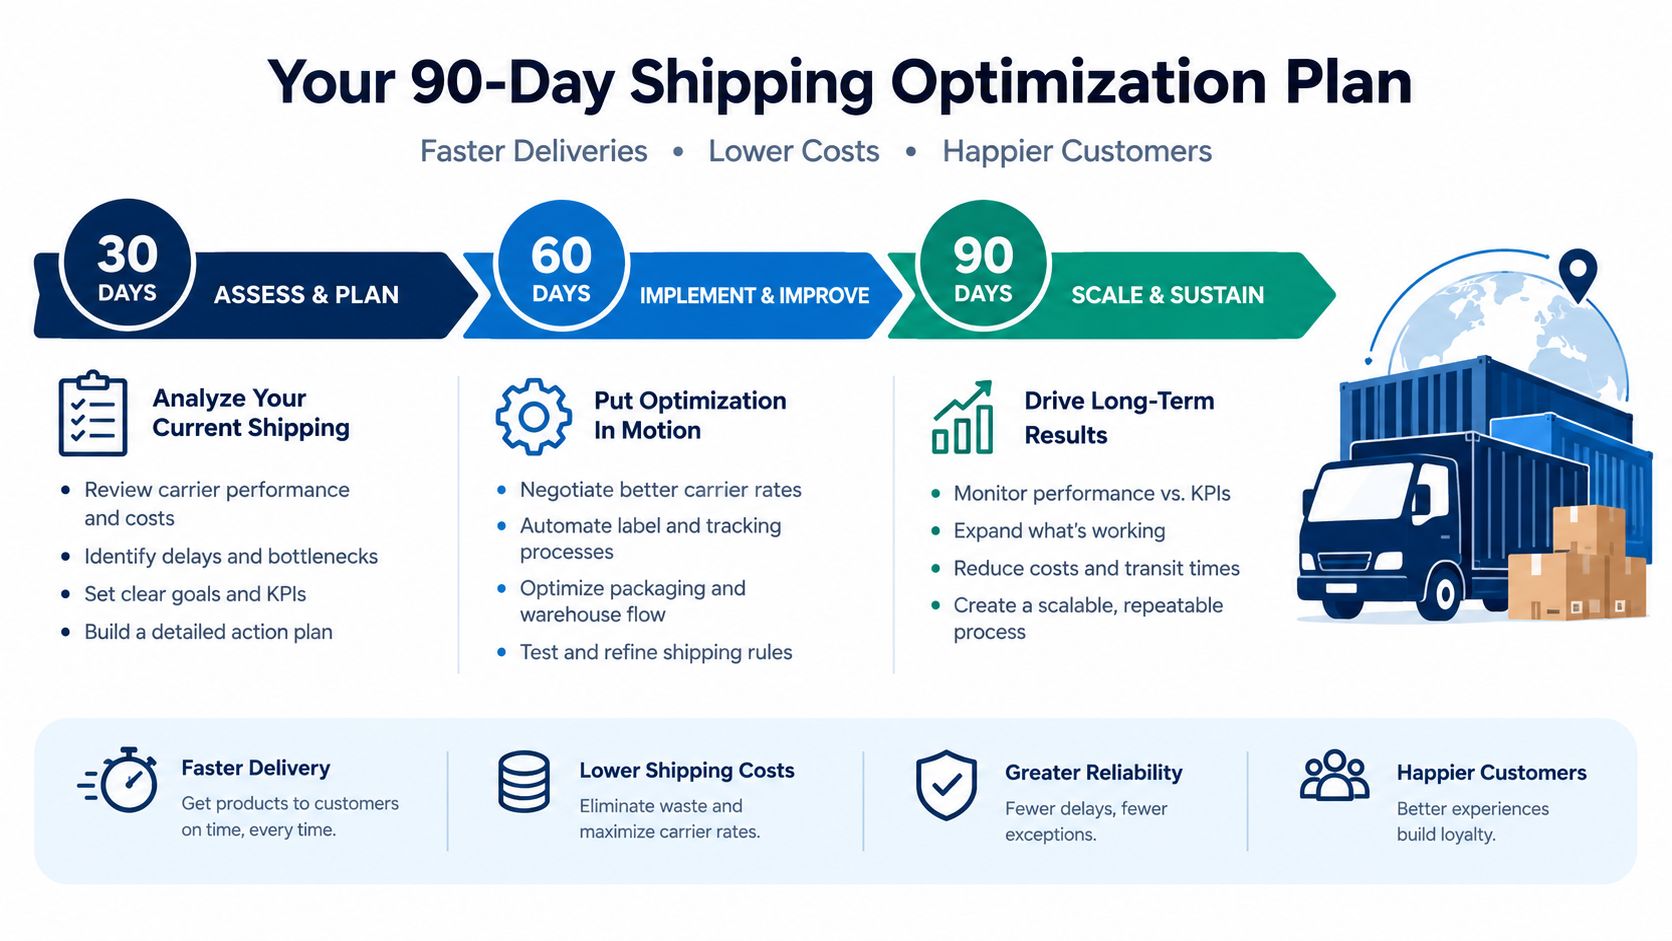
Shipping optimization works when the sequence is disciplined. Don't start by replacing every carrier or moving every SKU into a new warehouse. Start with the leaks that have clear evidence, limited implementation risk, and a direct connection to billed cost.
Pull invoices, order data, packaging purchases, return records, and labor allocations into one working file. Build the surcharge-first audit and rank the three largest preventable leaks. At the same time, identify the highest-volume SKU and carton combinations, then select one packaging change that can alter dimensional weight or eliminate avoidable handling exposure.
Use the U.S. Department of Transportation's FLOW description as a reminder that logistics visibility increasingly depends on shared operational data, not only internal dashboards. Your immediate job is simpler: create a trustworthy internal baseline before you make promises to a carrier or 3PL.
Build carrier scorecards by zone, service, weight band, and surcharge category. Start negotiations with two competing carriers in parallel, and ask for contract language covering dimensional treatment, surcharge caps, fuel, general rate increases, rebates, and payment disputes.
Pilot one rules-based routing change on your highest-volume lanes. Keep the fallback path active, monitor delivery performance, and reconcile every label and invoice. Don't expand the pilot until the system proves it can preserve both cost control and the checkout promise.
Make the fulfillment decision using landed cost, not provider marketing. Choose FBA, FBM, a 3PL, or a deliberate hybrid based on volume stage, SKU cube, peak spread, return rate, channel mix, and required control.
Then lock the five KPIs into a weekly dashboard and stress-test the process before peak. BCG's benchmark approach reinforces why this should continue after implementation, while the 2023 container-shipping study cited in the container route optimization research shows that heuristic choice can affect route outcomes across heterogeneous port networks. The broader point applies to ecommerce: test several scenarios with fresh cost inputs instead of trusting one supposedly optimal route.
The fastest payback usually comes from three moves: fix the carton that creates dimensional exposure, audit and renegotiate surcharge-heavy lanes, and enforce routing rules on the orders that drive the most volume. Treat sustainability as an operating metric too. DHL reports that over 3 in 10 orders are sent internationally, 25% of businesses not currently shipping cross-border prioritize that capability within the next 12 months, and 52% of shoppers would choose one store over another for more sustainable shipping options in its 2026 Ecommerce Trends Report. Measure carbon per shipment alongside cost per order, then use fulfillment placement, packaging, and service-level choices to improve both.
Million Dollar Sellers offers an invite-only peer network for ecommerce entrepreneurs, with strategy sharing, private forums, mastermind calls, and vetted service recommendations across Amazon, DTC, and omnichannel operations. Visit Million Dollar Sellers to connect with operators who can pressure-test your shipping model, carrier strategy, and fulfillment decisions against real scaling experience.
Join the Ecom Entrepreneur Community for Vetted 7-9 Figure Ecommerce Founders
Learn MoreYou may also like:
Learn more about our special events!
Check Events