Chilat Doina
September 26, 2026
$172 is the 2026 global cross-industry average order value, based on Dynamic Yield benchmark data covering the trailing twelve months through April 2026. Average order value, or AOV, is total revenue divided by the number of orders in a given period, so it measures transaction-level efficiency rather than customer lifetime value.
That definition is simple. Using AOV well isn't.
The popular advice says to push shoppers toward bigger baskets through bundles, free shipping, and upsells. Those tactics can work, but a larger order isn't automatically a healthier order. Discounting can inflate basket size while reducing contribution profit, and an aggressive checkout offer can lift AOV while lowering conversion or weakening the next purchase.
For an 8-figure ecommerce business, the useful question isn't only, “How do we increase AOV?” It's, “Which additional revenue per transaction remains profitable after product costs, fulfillment, acquisition, returns, and retention effects?” That shift turns AOV from a vanity KPI into an operating lever.
Average order value is the average amount spent per transaction. The calculation is:
AOV = total revenue ÷ number of orders
If a store generates $500,000 from 2,000 orders, its AOV is $250, as illustrated in the Corporate Finance Institute's AOV explanation. The period must remain consistent. Compare a month with another month, a campaign with another campaign, or a channel with the same channel. Mixing a blended store period with a narrow campaign view produces a number that looks precise but answers no useful question.
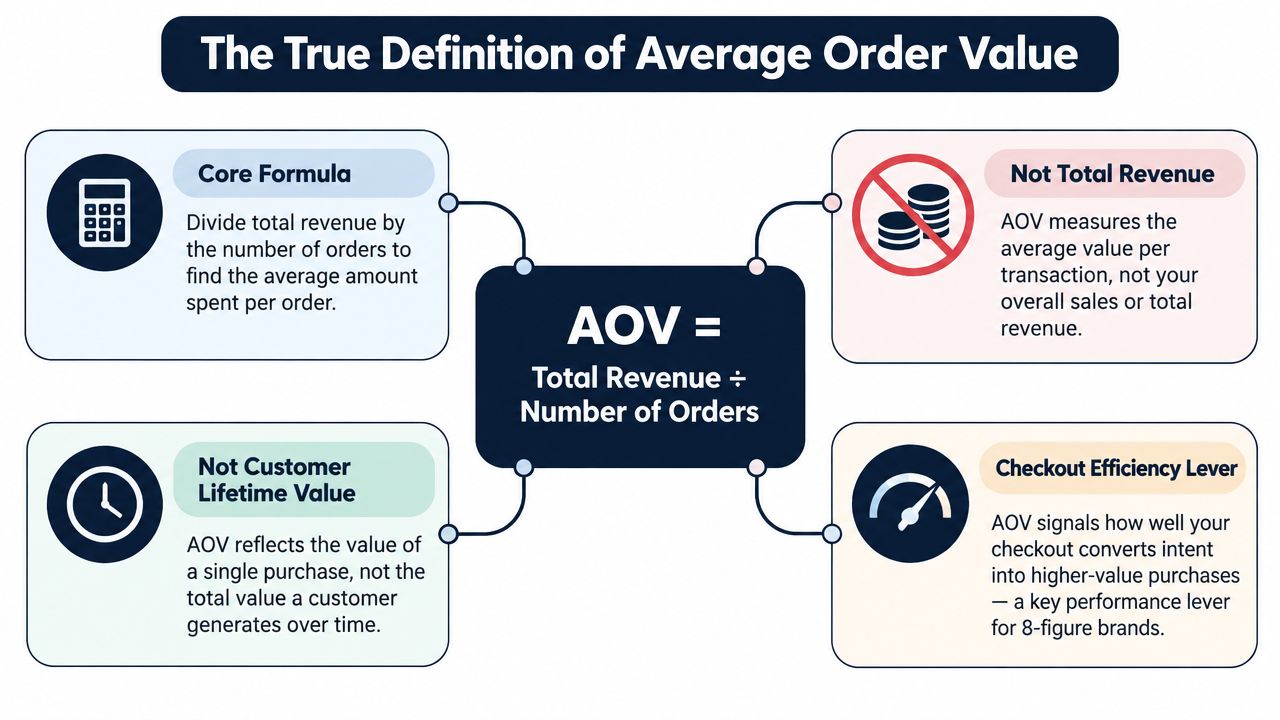
AOV counts orders, not unique customers. If one buyer places multiple orders in the reporting period, each order belongs in the denominator. That makes AOV useful for evaluating checkout performance, pricing, product mix, and promotions. It doesn't tell you how frequently that buyer purchases or how much value they create over the entire relationship.
That distinction separates AOV from customer lifetime value, revenue per user, and other customer-level measures. LTV includes repeat behavior and relationship duration. AOV gives you a narrower but cleaner operational signal: what happened in one completed transaction.
Practical rule: Use AOV to judge the economics of an order. Use LTV to judge the economics of retaining a customer.
Revenue is different as well. Total revenue tells you the size of the business or the sales generated during a period. AOV tells you the average value of each transaction. A store can grow revenue through more orders while AOV falls, or raise AOV while order volume declines. Neither movement is automatically good or bad without the surrounding context.
Merchants use AOV to understand whether pricing, assortment, merchandising, and promotions are changing what shoppers place in the cart. A premium product gaining share can lift AOV. A low-priced bestseller can pull it down while improving conversion and acquisition efficiency. A discount can increase basket size but still leave less profit per order.
AOV also differs from average selling price, or ASP. ASP generally focuses on the average price of individual units sold. AOV focuses on the whole order, so it reflects both item prices and the number of items in each transaction. If a shopper buys one premium product, ASP and AOV may look similar. If that shopper adds complementary products, AOV rises while the product-level selling price may not change.
For a concise terminology reference, the PlatformDTC AOV glossary is useful when aligning finance, merchandising, and growth teams around the metric. The operational baseline is straightforward: define the revenue field, define the order field, apply the same period, and don't confuse a bigger basket with a more valuable customer.
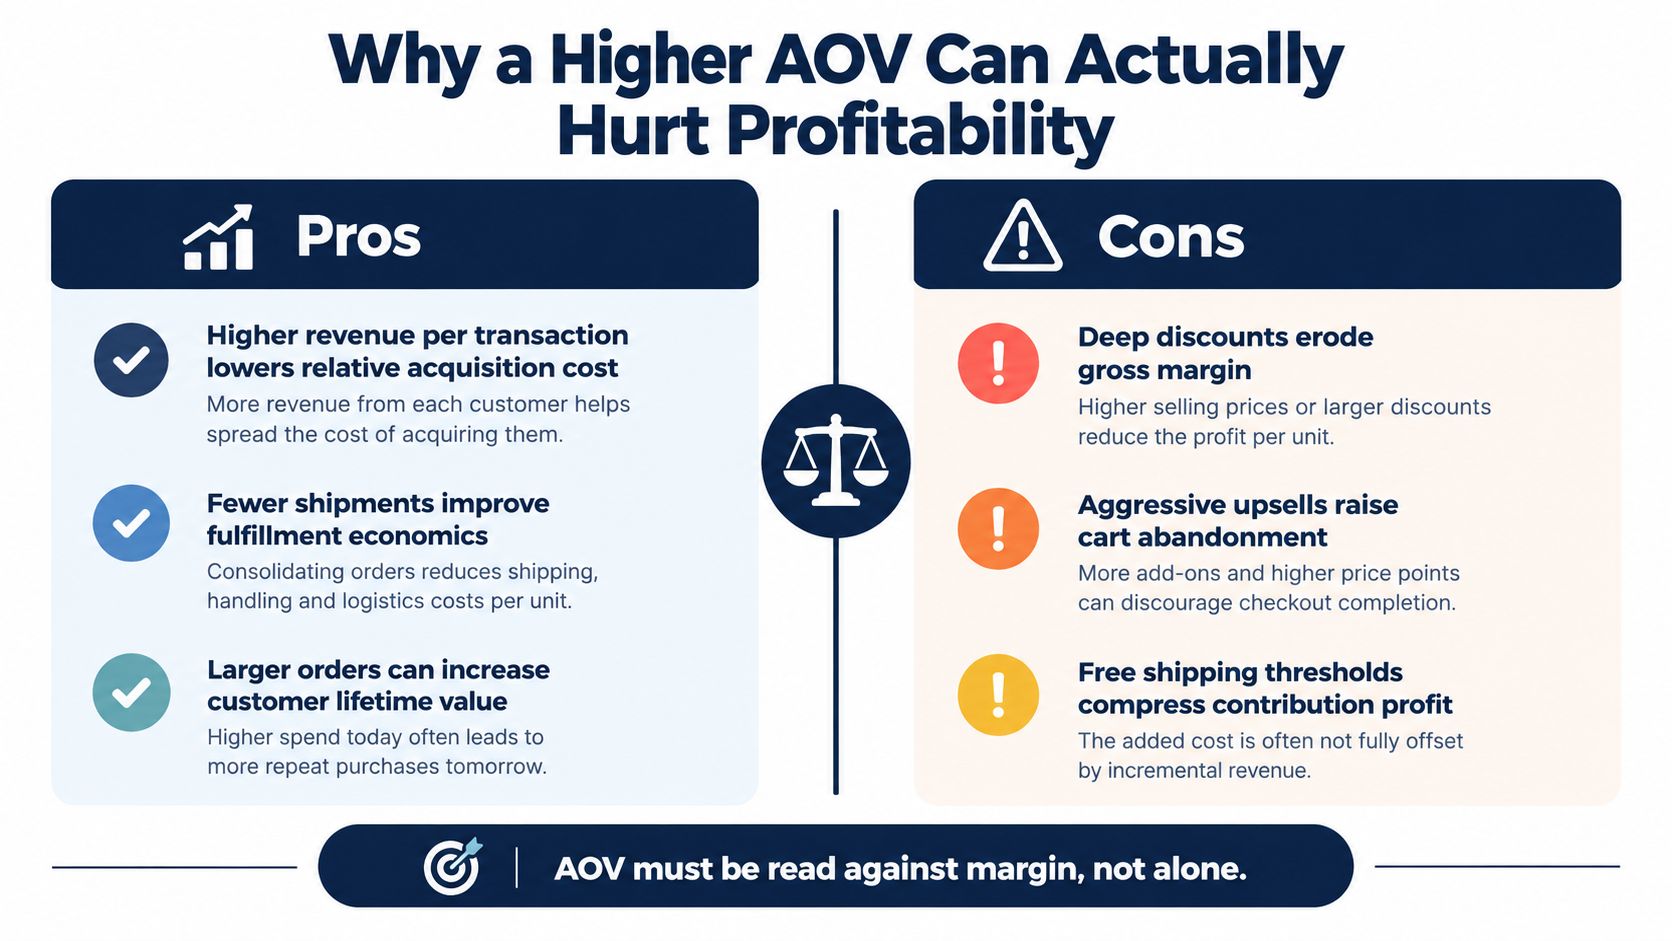
A higher AOV can make merchandising look successful while weakening the economics of every order. AOV measures revenue per transaction, but it does not subtract product cost, discounts, shipping subsidies, payment fees, returns, or the cost of the incentive that persuaded the shopper to add more.
A store may raise AOV with a deep bundle discount and still produce less contribution profit per order. Raising the free-shipping threshold can increase basket size while leaving the brand responsible for fulfillment costs that the additional revenue does not cover. The customer spends more, yet the order may be less valuable to the business.
Heavy discounting is the clearest risk. A threshold promotion can move a shopper toward a larger order, but a discount applied to the entire basket may reduce the price of products they would have bought anyway. Repeated offers create another problem. Customers can learn to postpone purchases until the next promotion, weakening full-price demand and making future conversion dependent on discounts.
Forced bundling creates a similar trade-off. A bundle works when the products address a coherent need and the discount stays controlled. It fails when unwanted items are added, price comparisons become unclear, or customers pay for inventory they do not value. The initial order is larger, but returns, dissatisfaction, and resistance to a second purchase can erase the gain.
Free-shipping thresholds need order-level margin analysis. Set the threshold around a relevant add-on rather than transferring shipping cost from the customer to the brand. A low threshold may give away shipping on orders that would have occurred without the incentive. A high threshold can frustrate shoppers and reduce conversion.
The right companion metric is contribution profit per order, not gross revenue alone. The contribution margin framework from MDS helps teams separate sales from the variable costs that determine whether an order supports growth.
Acquisition changes the calculation as well. Paid traffic may produce a lower AOV than retention traffic without being unprofitable. Compare the order's contribution profit with acquisition cost, then allow for overhead and future customer value. The idea of break-even advertising cost gives paid media teams a practical way to judge how much advertising spend an order can support before the economics turn negative.
Track the interaction among these measures:
The video below offers another visual treatment of AOV and its trade-offs.
The best AOV test is rarely the one with the largest dashboard lift. It is the one that adds profitable revenue without weakening conversion, customer satisfaction, or repeat demand.
A blended store-wide AOV is a poor benchmark when traffic sources behave differently. Paid social shoppers may arrive with limited brand intent, while organic search visitors can enter with a specific product in mind. Email and retention traffic may already understand the assortment and trust the brand enough to buy a broader basket.
The benchmark data makes the distortion visible. Triple Whale reported a 2025 paid-advertising median AOV of $74.12, while broader global ecommerce estimates clustered around $150 to $180 in the referenced comparisons. A separate 2026 dataset covering 2,934 active stores reported a median AOV of $312 and a mean of $607. These figures aren't interchangeable benchmarks. They describe different populations, channels, and distributions, which is exactly why one blended number can mislead operators. See the Triple Whale ecommerce benchmarks for the cited comparison.
| Traffic Channel | Median AOV Estimate | Primary Driver |
|---|---|---|
| Paid advertising | $74.12 | First-touch demand and offer response |
| Broader global ecommerce | $150-$180 | Mixed channel and category composition |
| Active-store dataset | $312 median, $607 mean | Store mix and high-value order skew |
Start with your own data, segmented by:
The purpose isn't to find a universal “good AOV.” A good AOV is one that supports your target contribution profit and acquisition model for a specific segment. A premium omnichannel retailer shouldn't judge itself against a low-ticket subscription store, and an Amazon seller shouldn't assume its marketplace basket behaves like a DTC checkout.
Means can be pulled upward by a small number of unusually large orders. Review the distribution rather than accepting the blended average at face value. Median order value can show the typical transaction more clearly, while product and channel cuts reveal where the outliers originate.
Use benchmarks as questions, not targets. If paid traffic has a lower AOV, test whether the channel attracts lower-intent buyers, promotes entry products, or lacks a relevant cross-sell. If retention orders are larger, identify whether that comes from customer familiarity, replenishment timing, bundles, or a different product mix. The answer determines the tactic. The benchmark alone doesn't.
AOV analysis fails when order data isn't consistent. A store platform, payment processor, ad platform, and analytics system can each report a different revenue figure because they handle refunds, taxes, shipping, discounts, currencies, and order status differently.
The fix is a measurement contract. Write down what counts as revenue, what counts as an order, which currencies are normalized, and which order types are excluded. Then make every dashboard and experiment use that definition.
1. Audit the source systems. Reconcile Shopify, Amazon, the payment gateway, and analytics feeds. Look for cancelled orders, duplicate records, partial refunds, and orders that appear in one system but not another.
2. Define net revenue logic. Decide whether AOV uses gross or net product revenue. For profitability work, teams generally need a consistent net basis that handles discounts, refunds, taxes, and shipping according to the business's reporting policy. The important point is consistency, not a universal formula.
3. Normalize currencies. Store the transaction currency and the conversion rate used for reporting. Don't compare local-currency orders with converted orders in the same view without documenting the rule.
4. Exclude noise. Remove internal test orders, employee purchases, fraud, and cancelled transactions when they don't represent normal customer checkout behavior. Keep a record of exclusions so the team can explain changes in the series.
5. Segment the dashboard. Create views for channel, device, customer status, product category, campaign, and offer. A store-wide AOV widget is useful for orientation, but it isn't enough for diagnosis.
Every pricing, bundle, upsell, and shipping test needs a defined primary metric and guardrails. AOV may be the primary revenue measure, but conversion rate, refund rate, contribution profit, and repeat behavior should remain visible. Otherwise, the team can declare a winner based on a larger order that customers complete less often or return more frequently.
Track the test population and comparison period consistently. Don't compare a campaign-heavy week with a normal week and attribute every movement to the new offer. Seasonality, channel mix, inventory availability, and product launches can shift the composition of orders even when the checkout experience stays unchanged.
For broader measurement discipline, the MDS guide to ecommerce analytics is a relevant internal resource. The practical standard is simple: one source of truth for orders, documented revenue logic, and dashboards that show AOV beside the economics that explain it.
The safest AOV strategies add value that customers already want. They don't force an unrelated item into the cart or hide the cost of a discount. Start with the customer's buying mission, then make the next logical purchase easier.
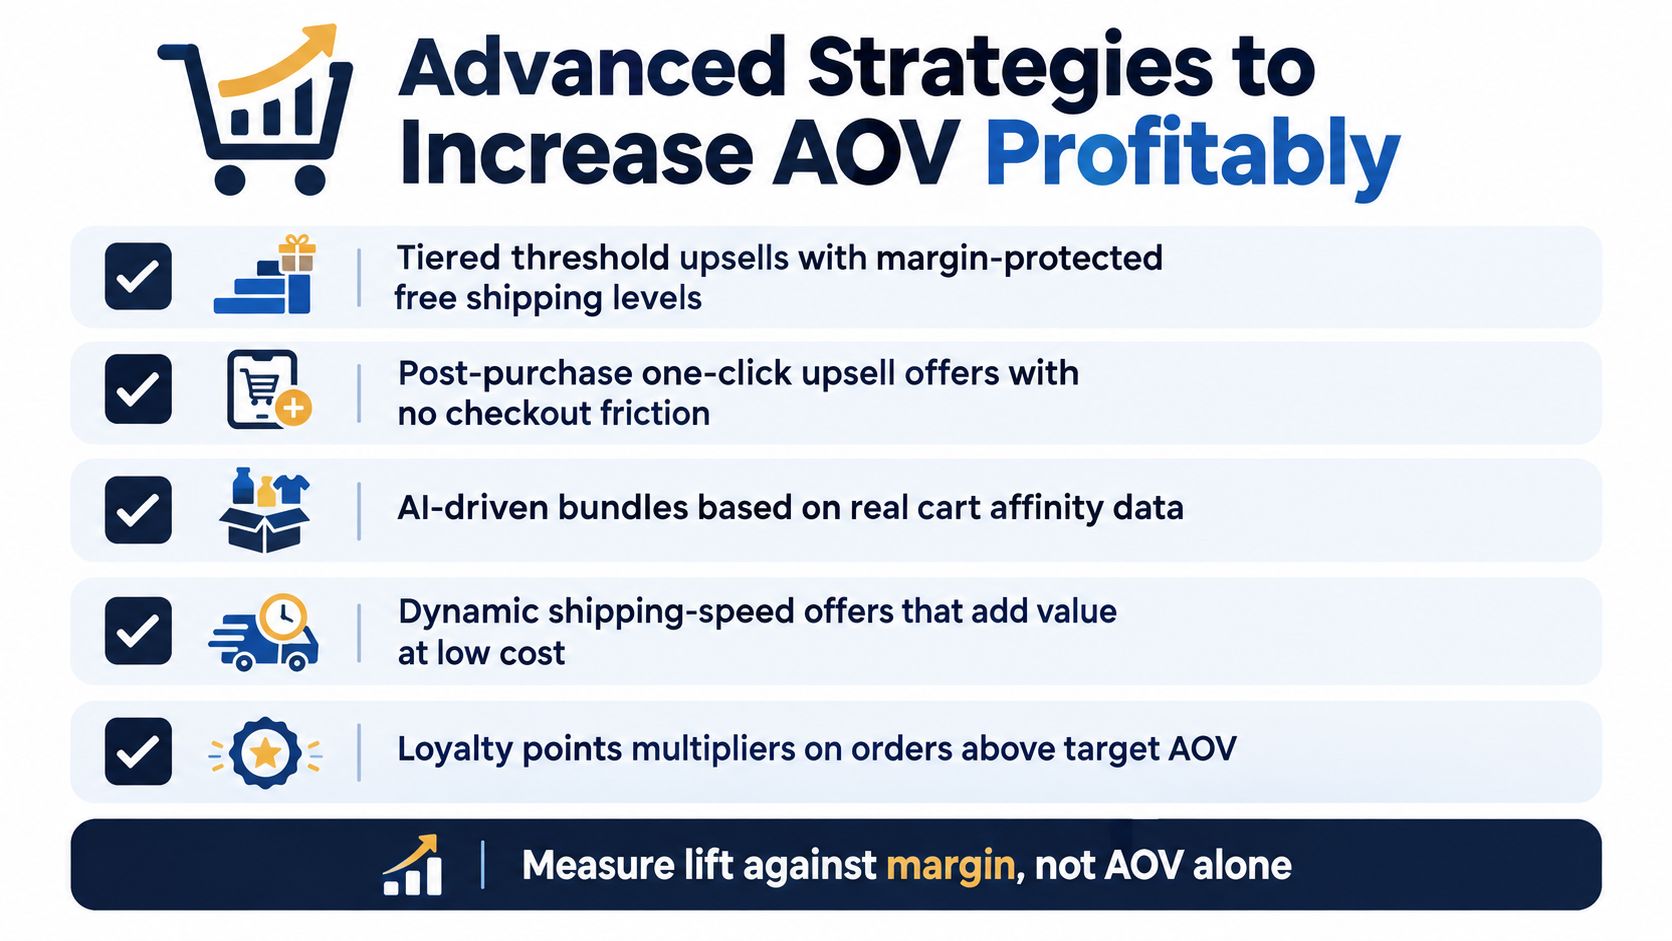
Good, better, best bundles work when each tier has a clear use case. A basic package can solve the immediate need, a middle package can add the most practical accessories, and a premium package can include convenience or performance benefits. Price the tiers so the upgrade is understandable without making the basic option feel deliberately incomplete.
Cart-based cross-sells should reflect real product compatibility. A camera buyer may need a memory card or carrying case. A skincare buyer may need a replenishment product that fits the same routine. The recommendation should answer “what makes this purchase work better?” rather than “what else can we put in the cart?”
A useful next step is to analyze actual cart affinity, not rely only on merchandising intuition. The product bundling strategies guide from MDS provides a relevant framework for pairing complementary products and structuring bundle offers.
A free-shipping or free-gift threshold can create a clear reason to add one more product. Set it using order economics, shipping cost, product margin, and the customer's natural next item. If the threshold requires an awkward leap, shoppers may abandon rather than add.
Use a margin-protected gift when the perceived value is high but the incremental cost is controlled. A low-cost accessory, sample, or replenishment item may support a better experience than a broad percentage discount. Test whether the offer changes completed orders and profit, not merely cart value.
Post-purchase one-click upsells deserve attention because they don't interrupt the original checkout decision. The buyer has already completed the main transaction, so a relevant add-on can be offered with less risk to initial conversion. Keep the offer tightly connected to the purchased product and make fulfilment, cancellation, and refund terms clear.
Subscription incentives can also increase the first order's value when the customer expects repeat consumption. Avoid using a subscription discount to disguise a poor fit. The initial order may rise while cancellation requests and support costs increase if the customer isn't ready for recurring delivery.
Not every AOV increase needs another physical item. Paid shipping speed, gift packaging, setup assistance, or a service upgrade can add revenue with a different cost structure. The offer must still be transparent, and its fulfilment promise must match operational capacity.
Loyalty multipliers can encourage customers to cross a target order value, but reward economics need the same scrutiny as discount economics. Awarding points on every incremental dollar can create a future liability. Test whether the reward drives profitable basket expansion or just delays a purchase until the customer can redeem it.
The winning offer is the one customers would choose again without needing another discount.
AOV belongs in the weekly growth conversation, but it shouldn't dominate it. Leadership teams need to see how order value interacts with acquisition, conversion, contribution profit, inventory, and repeat behavior. A rising line on the AOV chart is only positive when the rest of the system remains healthy.
Use a simple decision matrix:
This framework keeps AOV connected to the maximum CAC the business can support. A high first-order value can give acquisition more room, but only if variable costs leave enough contribution to fund growth. A lower AOV can still work when conversion, repeat purchase, and customer-level economics compensate for the smaller first transaction.
Conversion rate deserves special protection. A checkout that presents too many upgrades can confuse shoppers, slow the decision, and reduce completed orders. The better test often starts with one relevant recommendation, a clear price difference, and a control group that reveals whether the extra revenue outweighs lost conversions.
For teams connecting search demand with conversion work, the Crescade case study for SEO and conversion offers a useful reminder that traffic and on-site performance should be evaluated together. More qualified visits and a stronger buying experience can improve the growth equation without relying exclusively on larger baskets.
Review AOV by channel and offer, then pair it with contribution profit, conversion rate, refund behavior, and repeat purchase. The operating question is not whether the number moved. It's whether the business became more efficient and more durable because it moved.
A disciplined AOV program gives Million Dollar Sellers members and other serious operators a shared language for evaluating merchandising, acquisition, and unit economics across brands. Visit Million Dollar Sellers to learn how the community connects experienced ecommerce founders around practical strategy sharing, peer accountability, and scaling decisions.
Join the Ecom Entrepreneur Community for Vetted 7-9 Figure Ecommerce Founders
Learn MoreYou may also like:
Learn more about our special events!
Check Events