
Chilat Doina
August 9, 2026
Repeat customers spend 67% more per transaction than first-time buyers (customer retention statistics), and that's the number founders should keep in mind before they get lost in dashboard noise. If your paid social keeps adding customers while profit stays flat, you don't have a growth problem first, you have a retention problem.
What is customer retention rate? It's the share of your existing customers you keep over a fixed period. It sounds simple, but most founders misread it because they confuse total customers, repeat orders, and true loyalty. That mistake hides churn, flatters acquisition, and makes weak brands look healthier than they are.
The right way to think about retention is as a cohort-based loyalty metric, not a vanity count. If you only watch total customer growth, you can miss the fact that new buyers are replacing the old ones. That's why retention deserves more attention than almost any other number in e-commerce.
A brand can add thousands of new customers and still bleed value every week. Customer retention rate measures how many of the customers you already had at the start of a period are still with you at the end, after removing the customers you newly acquired during that same window (Salesforce retention rate guide).
Repeat orders are not the same thing as retention. A customer can buy again and still be a weak customer if they bought less, waited longer, or downgraded their basket. Retention asks a stricter question, did your existing customer base stay active over the period you measured?
That's why this is a time-bounded cohort metric, not a raw count of purchases. The formula isolates continuity and strips out growth-driven distortion from new acquisitions. If you don't do that, acquisition can camouflage churn for months.
Practical rule: if your total customers are up but retention is down, your acquisition engine is doing more work than your brand is.
The standard formula is straightforward, but the interpretation is where founders get burned. Retention is the inverse complement of churn, so the two numbers should always be read together when you are diagnosing product-market fit or repeat-purchase behavior. In plain English, higher churn means lower retention, even if top-line customer counts look fine. For a simple guide to the math behind churn, use this customer churn rate walkthrough.
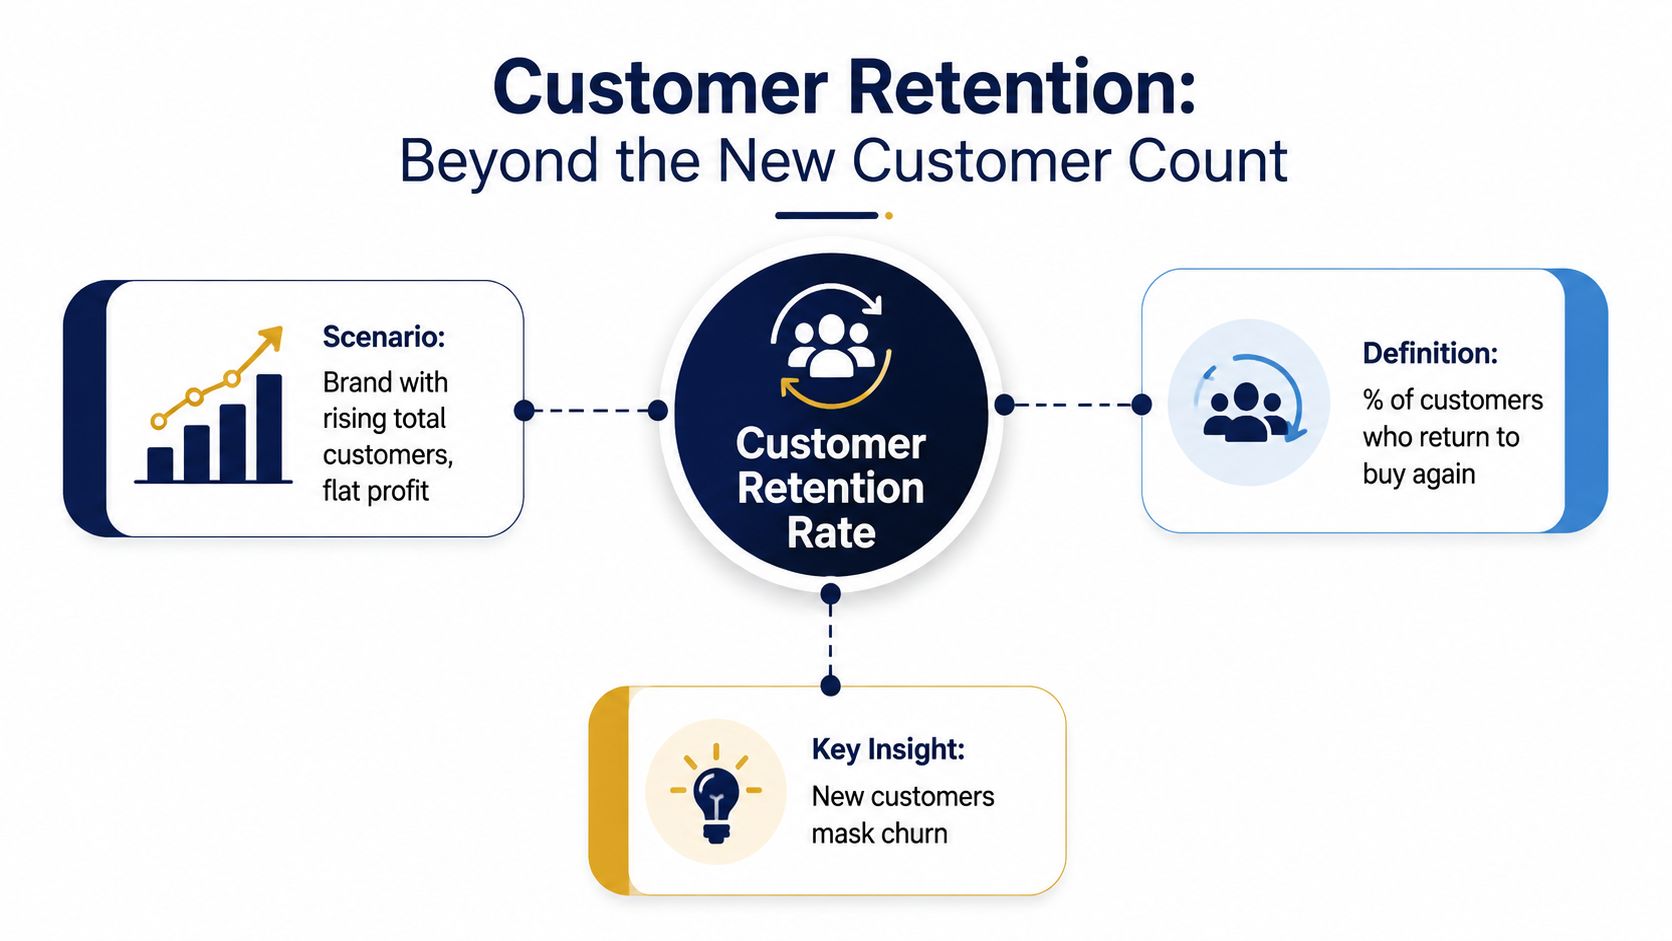
A business can post rising monthly customer totals while the actual retention curve weakens beneath the surface. That makes retention a loyalty metric, not a growth metric, and it is why founders who misread it often end up paying for the same customers twice.
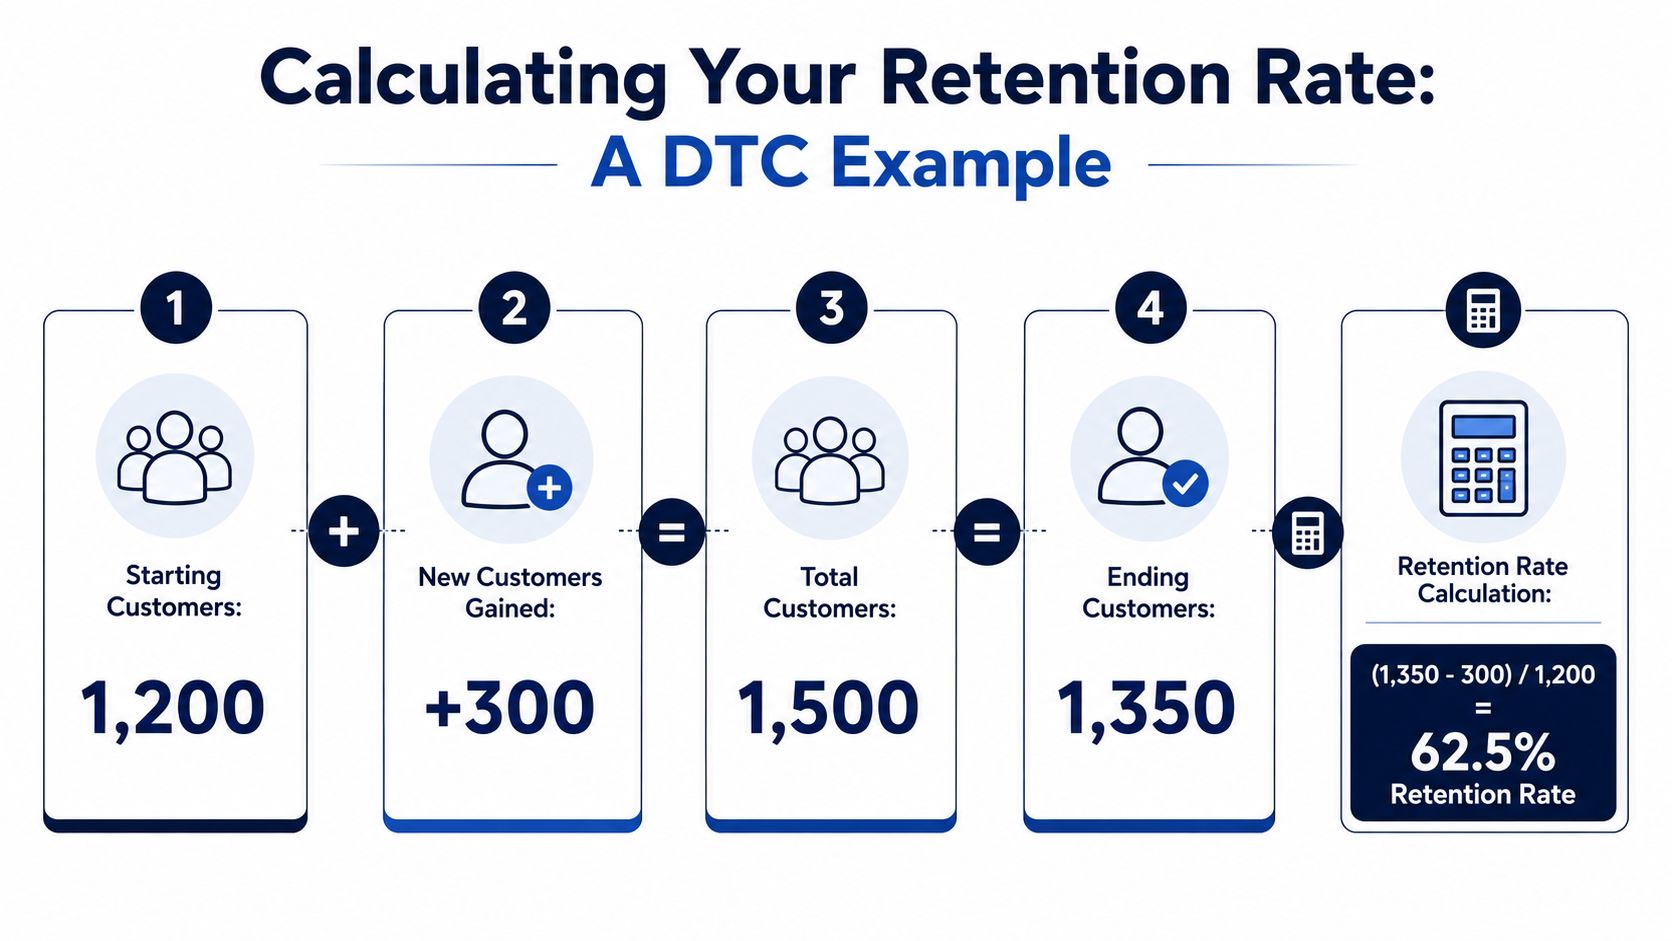
The formula only works if you keep the time window fixed. Use month-over-month, quarter-over-quarter, or year-over-year, but don't mix them and expect a clean read. The standard calculation is ((Customers at end - New customers acquired) / Customers at start) x 100 (customer retention formula guide).
Start with a DTC brand that has 1,200 customers at the beginning of the quarter. It acquires 300 new customers during the quarter and ends with 1,350 customers. The math is (1,350 - 300) / 1,200 x 100, which gives you a 62.5% quarterly retention rate.
That number matters because it tells you how many of the original 1,200 stuck around. The 300 new customers are excluded on purpose. If you didn't subtract them, growth would inflate the result and hide weak loyalty.
The period formula is useful for a quick pulse, but cohort tracking is the version I trust when I'm making decisions. Take a January acquisition cohort and follow it through month 1, month 2, month 3, and month 6. That curve shows decay patterns you'll never see in a blended quarterly number.
For example, if customers acquired in January reorder quickly in month 1 but fade by month 3, you've learned something the quarterly average won't show you. The period number might look acceptable, while the cohort curve tells you your offer attracts curiosity, not durable demand.
Keep period retention for board-level summaries. Use cohort retention for actual operating decisions.
You can also measure retention monthly, quarterly, or annually depending on the buying cycle. Fast-turn consumables deserve shorter windows, while slower reorder categories need longer ones. If your product has a natural reorder lag, a 90-day window can make healthy customers look like they disappeared.
For operators who want to connect retention and churn directly, a separate churn view helps you see the other side of the same behavior. A practical walkthrough is available in this churn-rate guide, which is useful because retention and churn should be treated as one operating system, not two unrelated dashboards.
The same brand can produce two different answers depending on the method. The period formula might show a decent quarterly number, while the January cohort decays fast enough to warn you that the business is buying short-lived customers. That's why founders should stop treating retention as one universal metric.
A single retention number is usually too blunt to run a business on. Customer retention, revenue retention, repeat purchase rate, and reorder rate all answer different questions, and confusing them leads to bad decisions. Gainsight's metric framework is useful here because it separates customer retention from revenue retention and shows why retained-customer counts alone can miss contraction, downgrade, and expansion behavior (Gainsight retention glossary).
If you run a mixed DTC catalog, track logo retention and repeat purchase rate together. Logo retention tells you whether buyers come back at all. Repeat purchase rate tells you whether your base keeps transacting.
If you run a subscription brand, watch net revenue retention. A subscriber can stay on the books while buying less, trading down, or delaying renewals. In that case, a healthy customer count can hide a weaker revenue base.
If you sell on Amazon, focus on reorder rate and Subscribe & Save attach. Amazon retention rarely looks like Shopify retention because the platform pushes convenience, substitution, and brand switching in different ways. The customer may be loyal to the platform first and your brand second.
Bottom line: logo retention tells you who stayed, revenue retention tells you what they're worth, and reorder rate tells you whether the shelf still earns its spot.
A subscription-plus-one-time business can show high customer retention while revenue retention falls. That happens when customers stay active but buy smaller baskets, downgrade packs, or stretch purchase intervals. The logo count looks fine, but the economics are slipping.
That's why I'd never let a founder run on retention alone. Pair it with customer lifetime value so you can see whether the customers you're keeping are compounding profit. The mechanics of that pairing are laid out in this CLV guide, and it belongs in the same operating conversation as retention.
My recommendation is simple. Do not trust a single retention number unless your business model is extremely clean. Most ecommerce brands aren't clean. They have discounts, bundles, one-time gifts, subscriptions, and marketplace traffic all mixed together, which means the right metric depends on how money flows through the business.
Benchmarks only matter when you compare like with like. A retention rate that looks weak in media can still be normal in e-commerce, and a subscription benchmark can mislead a transactional store. Salesforce notes that retention varies sharply by industry, with figures as high as 84% in media and professional services and as low as 38% in e-commerce (Salesforce retention rate guide).
| Industry / Model | Typical Retention Range |
|---|---|
| Media | 84% |
| Professional services | 84% |
| Banking | 75% |
| Retail / e-commerce | 63% |
| Hospitality | 55% |
| E-commerce | 38% to 63% |
The spread says everything. Retention is shaped by business model and sector, not by a universal standard you can paste across every brand. An annual retention rate for a transactional DTC brand does not mean the same thing as a 12-month survival rate in a subscription model.
For e-commerce, the lower published estimates should make founders cautious. Many online businesses lose a large share of customers each year, especially in commoditized categories or acquisition-heavy brands. That is why a headline benchmark should never replace cohort analysis.
Amazon sellers should judge loyalty differently from Shopify operators. On Amazon, reorder rate and Subscribe & Save attach often tell you more than a simple logo-retention metric. The platform changes the meaning of loyalty, because the customer experience is filtered through marketplace behavior, not just your own site.
Use benchmarks as a floor, not a target. A retailer with a complex product mix cannot compare itself directly with a single-SKU subscription brand. The only honest comparison is against your own cohorts by channel, SKU, and acquisition source.
A strong retention number from the wrong channel mix is still a bad number. A weak number in a low-frequency category may be less alarming than it looks. Benchmark obsession is a distraction unless it is paired with segmentation.
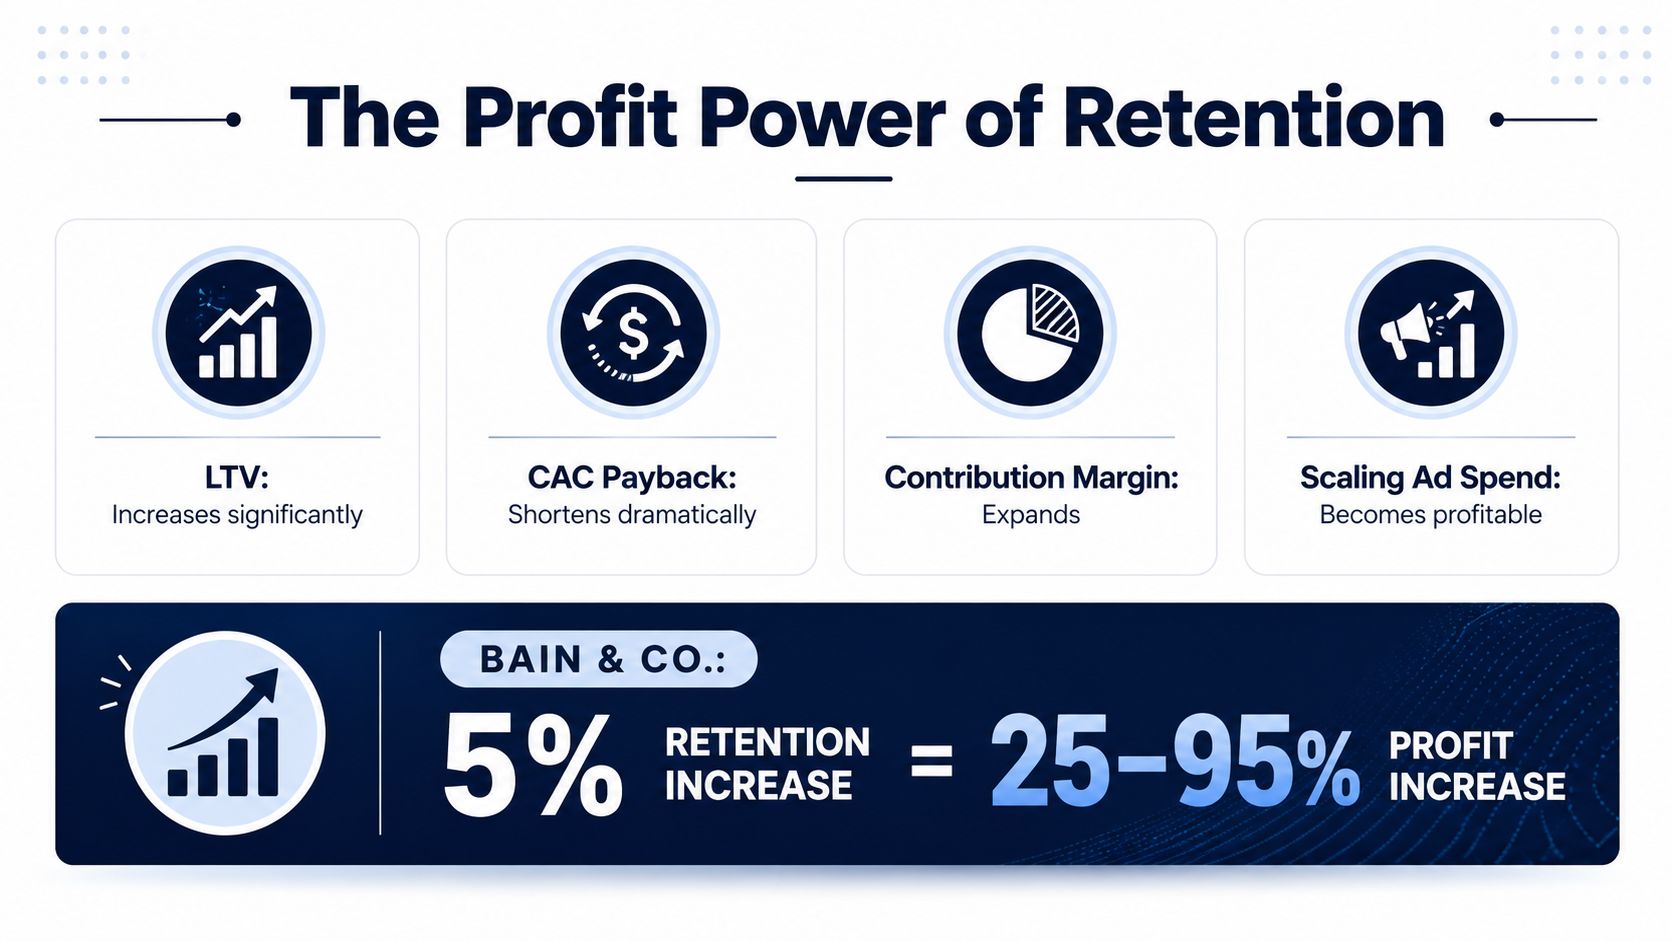
Retention is where revenue math gets brutal in a good way. Keep more customers and you raise the value of every acquisition, shorten payback, and protect contribution margin without having to bid harder in the ad auction. That is not a theory problem. It is unit economics.
The classic Bain finding, popularized in Harvard Business Review discussions of retention economics, is that a 5% increase in customer retention can raise profits by 25% to 95%. That range changed the way serious operators think about retention, because it turns the metric from a support KPI into a profit driver.
Repeat customers spend 67% more per transaction than first-time buyers, and one current retention source says repeat customers account for about 65% of typical business revenue. Those two facts explain why acquisition-heavy brands can look busy while still underperforming.
Retention also compresses CAC payback. If customers return faster and spend more on later orders, the original acquisition cost gets spread across a larger revenue base. That makes paid traffic easier to scale without crushing margin.
If you want to spend more on acquisition, earn the right to do it by keeping the first customer longer.
This matters even more in 2026 because acquisition is noisier and pricing is less stable. A 2024 McKinsey estimate said personalization can lift revenue by 5% to 15% and improve marketing spend efficiency by 10% to 30%. Adobe's Digital Price Index reported that U.S. ecommerce prices were 14.0% higher in June 2025 than in January 2019, and the June 2025 index was up 0.4% month over month. That combination makes loyalty more valuable and more fragile at the same time.
My view is blunt. Retention is the cleanest defensible advantage a scaling brand can build. Ads get more expensive, discounts get copied, and product features get matched. Customers who come back because your brand is structurally useful are much harder to steal.
If your retention reporting is blended, you're probably making the wrong decisions. A cohort dashboard segmented by acquisition month, channel, and first-purchase SKU is the minimum setup I'd accept. Anything less gives you averages that hide behavior.
Track retention curves at day 30, 60, 90, 180, and 365. Those checkpoints reveal whether customers are falling off early, stabilizing, or coming back on a long reorder cycle. Use the same windows for every cohort so the data stays comparable.
Break out paid social from organic, marketplace from direct, and promo-led buyers from full-price buyers. When you blend all of that together, you get a useless average that can't tell you where the leak is. A channel that acquires cheap customers can still destroy retention quality.
The biggest mistake is using a short window on a slow-reorder product. If your category naturally restocks every few months, a 90-day view can make loyal customers look inactive. The second mistake is ignoring the lag between a marketing push and the repeat-order spike that follows it.
Operating rule: don't let a blended dashboard make a segmented business look simple.
Use the tools that fit the model. Shopify cohort apps help DTC teams track repeat behavior. Amazon Brand Analytics gives sellers a view into repeat purchase behavior. Klaviyo and Postscript are useful for lifecycle flows when you want to connect retention patterns to owned-channel messaging. If your team wants peer context and operator-level discussion around this stuff, Million Dollar Sellers is one place founders use to compare retention systems across brands.
The measurement checklist is simple:
If you can't answer where retention is strong and where it breaks, you don't have a retention strategy. You have a summary table.
Retention gets messy when teams try to fix everything at once. Start with the highest-friction moments first, because those are the places where repeat behavior is usually won or lost.
The cheapest lever is also the one founders ignore most often. If the box arrives sloppy, support response is slow, or the product is hard to use, you are paying to acquire customers who never turn into repeat buyers. Remove disappointment before it turns into churn.
The post-purchase experience and unboxing should sit at the top of the list. A handwritten insert, better packaging, and clearer usage guidance can turn a forgettable first order into a second order, especially for products that need a little education before the value is obvious.
Welcome, abandonment, replenishment, and win-back flows should come from cohort data, not a single message blasted to the full list. A customer who bought once at full price does not need the same follow-up as a discount-first buyer. Lifecycle messaging only works when timing and purchase intent match the message.
Use the 90-day roadmap to compound growth as the order of operations, not the tactics menu. Fix the handoffs first, then build flows that respond to how customers buy again.
Loyalty programs, subscription conversion, and personalization belong after the fundamentals are tight. Personalization only helps when the retention offer is already strong, because weaker offers just get targeted more precisely. First-party data should sharpen what is already working, not cover up a weak product experience.
For operators who want a practical framework for organizing the work, this customer loyalty playbook fits well alongside the retention dashboard and the lifecycle stack. If you run an Amazon brand, the same logic applies, but reorder behavior and subscribe-and-save attach should drive the sequence.
Here is the cadence I would use:
Retention improves when the customer experience feels intentional at every touchpoint. That is the part teams skip, and then they wonder why the same revenue costs more to generate each quarter.
Join the Ecom Entrepreneur Community for Vetted 7-9 Figure Ecommerce Founders
Learn MoreYou may also like:
Learn more about our special events!
Check Events