Chilat Doina
June 1, 2026
Data analytics is the process of examining raw business data to find patterns, make decisions, and improve profit, not just stare at sales reports. It has already become a massive business discipline, with the global big data analytics market valued at $307.52 billion in 2023, because companies use it to answer practical questions like what to reorder, where ad spend is leaking, and which customers are worth keeping.
If you're running an e-commerce brand, you probably already have more data than you can use. Shopify shows sales. Amazon shows sessions and conversion. Meta shows spend. Google Analytics shows traffic. Klaviyo shows opens and clicks. Your 3PL shows fulfillment delays. None of that automatically helps if you're still making the important calls from instinct.
That's the gap. Most founders don't have a data shortage. They have a decision shortage.
When people ask what is data analytics, they usually get a classroom answer. Descriptive, diagnostic, predictive, prescriptive. Technically correct. Not very useful when you're trying to decide whether to push a reorder, cut a campaign, raise price, or stop restocking a product that looks good on revenue and bad on contribution margin.
A founder's version is simpler. Data analytics is the discipline of turning scattered operational data into decisions that make more money. It helps you move from “sales were up” to “sales were up because discount depth increased, CAC worsened, and we pulled demand forward from next month.”
That's a different level of control.
A lot of brands hit the same wall. Revenue grows, channels multiply, and reporting gets noisier. The founder still knows the business cold, but the business now moves too fast to manage from memory alone.
One dashboard says a product is winning. Another says return rate is creeping up. The ad team wants more budget. Ops wants a smaller forecast. Finance says margin is thinner than it looks. Everybody has numbers. Nobody has the same answer.
That's where data analytics stops being a nice-to-have and becomes operating infrastructure. One industry summary puts the global big data analytics market at $307.52 billion in 2023, and reports that 91.9% of organizations saw measurable value from data investments in 2023, which tells you this isn't a back-office support function anymore. It's a management capability tied directly to action and outcomes, as noted in these data analytics market figures.
Most businesses start with reporting. Reporting tells you what happened. Orders were down on Tuesday. ROAS improved. Inventory on one SKU is low.
Analytics starts when you ask the second and third question:
That difference matters. A weekly sales report is a scoreboard. Analytics is the coaching staff reviewing game film, spotting the weakness, and changing the playbook before the next drive.
Practical rule: If a report doesn't help someone make a decision, it's overhead.
In e-commerce, the point isn't to become “data-driven” as a slogan. The point is to stop letting profitable decisions hide inside disconnected tools. The brands that win don't collect the most numbers. They build a repeatable way to turn numbers into moves.
The easiest way to understand data analytics is to think about driving a car. You don't drive safely or profitably with one signal. You use different signals for different decisions.
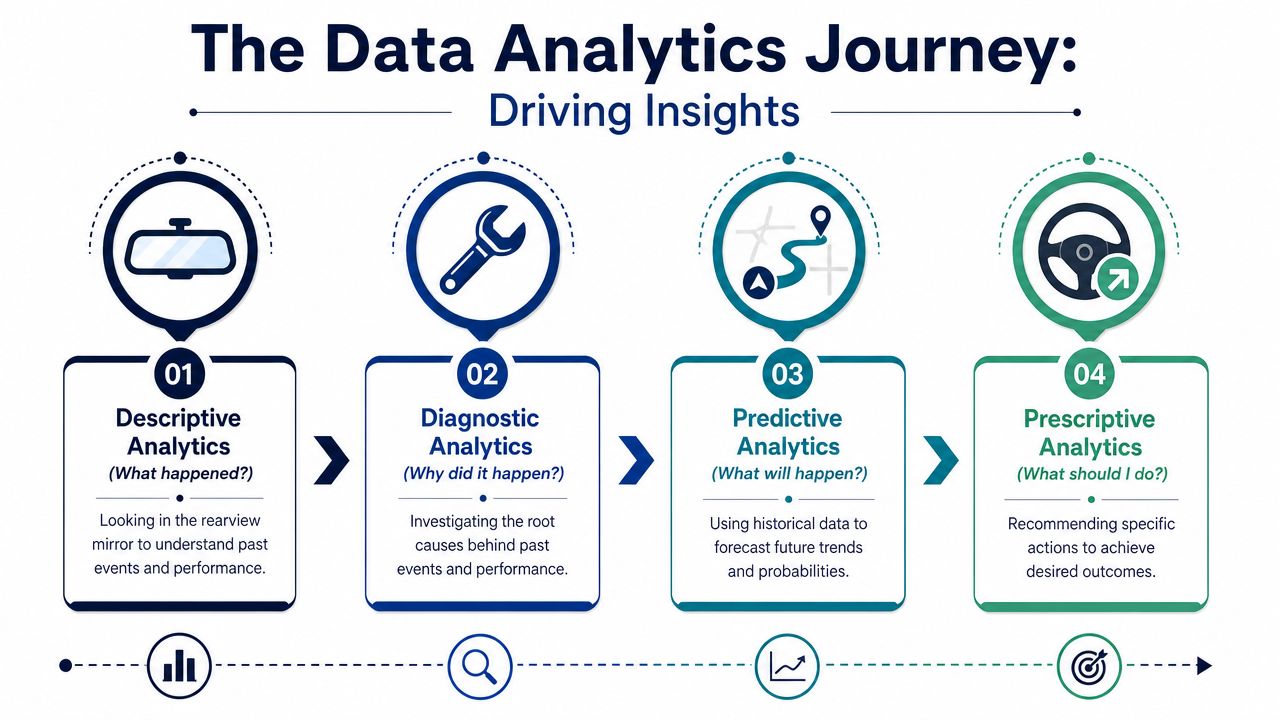
This is the rearview mirror. It tells you what happened.
In e-commerce terms, descriptive analytics covers things like sales by channel, units sold by SKU, refund trends, AOV by week, or email revenue by campaign. It's useful, but limited. Looking backward helps you understand the road you've already traveled. It doesn't tell you what caused the turn or what's coming up next.
This is the mechanic's wrench and warning light. It explains why something happened.
If conversion dropped, diagnostic analytics looks at where the change came from. Was mobile checkout slower? Did traffic mix shift toward colder audiences? Did a discount expire? Did one marketplace listing lose visibility? At this point, analysts start connecting variables instead of reading isolated metrics.
A lot of founders stop at descriptive reporting and call it analytics. That's why they end up reacting late.
This is your GPS with traffic data. It estimates what's likely to happen if current conditions continue.
In practice, predictive analytics helps with questions like:
If you want a plain-English resource focused specifically on this layer, DataTeams has a solid beginner's guide to predictive analytics.
This is the self-driving suggestion layer. It doesn't just predict traffic. It recommends the route.
Prescriptive analytics helps answer the operator's question: what should we do now? Raise price. Reduce discounting. Shift budget toward branded search. Pause an unprofitable SKU. Reorder earlier from one supplier and later from another.
According to TechTarget's definition of data analytics, mature analytics workflows use statistical analysis, machine learning, and SQL/Python-based work to move from descriptive questions like “what happened” to prescriptive ones like “what should happen next,” with workflows that include collection, cleaning, governance, and model training.
Here's the part that matters. Most brands already have enough data for descriptive analytics. Few have the discipline to move consistently into diagnostic, predictive, and prescriptive work.
A dashboard becomes valuable when it changes behavior, not when it looks sophisticated.
For e-commerce operators, analytics is valuable because it can handle large, complex, often near-real-time data and turn it into decisions on pricing, inventory, marketing, and operations. Oracle's overview of data analytics in business frames it well: the work is about identifying hidden performance drivers and converting raw data into actionable outcomes.

The money shows up when analytics changes a decision that would otherwise be made by habit.
Most inventory mistakes come from one of two bad habits. Reordering off gut feel, or reordering off top-line sales without context.
A product can look healthy in revenue and still be a problem if demand is highly seasonal, margin is thin, or returns are climbing. Analytics helps you combine sell-through, lead time, returns, promotions, and channel-specific velocity. That's how you avoid the classic founder trap of overbuying the wrong winners and stocking out of the quiet products that generate stable profit.
A simple spreadsheet can take you surprisingly far if the logic is sound. The key is to model demand with context instead of treating every recent sales spike as permanent.
Founders often underprice because they're afraid demand will soften, or over-discount because revenue screenshots feel good. Analytics changes the conversation.
Look at units sold, margin after ad spend, return behavior, discount depth, and repeat purchase patterns together. Sometimes a lower conversion rate at a higher price produces better profit. Sometimes the “winning” promo only wins because it borrowed demand from next week.
Useful pricing analysis isn't philosophical. It asks one question: which price point leaves more money after the actual costs are included?
Ad platforms are built to convince you to spend more. Founders need a second layer of truth.
When you join ad data with store data, gross margin, and post-purchase behavior, you stop rewarding campaigns that only look good inside the platform. That's when you notice that one campaign drives cheap first orders but poor repeat behavior, while another brings fewer conversions and better customer quality.
If you want a broader operational overview, this ecommerce analytics guide is a useful companion read. It's especially helpful when you're trying to connect marketing, fulfillment, and commercial performance instead of reviewing each function in isolation.
Not all customers are equal, even when they bought the same product. Some respond to launches, buy at full price, and reorder predictably. Others appear once, use a discount, and disappear.
Analytics helps you separate these groups so you can stop treating your customer file like a single audience.
A practical framework:
| Customer group | What to look for | Likely action |
|---|---|---|
| VIP buyers | High frequency, stronger basket behavior, lower discount dependence | Early access, premium bundles, retention offers |
| At-risk repeat buyers | Purchase gap widening, lower engagement | Win-back sequence, replenishment reminder |
| Discount-trained buyers | Purchase spikes around promos | Tighter offer strategy, protect margin |
| Low-quality acquisition pockets | Weak repeat behavior by channel or campaign | Reallocate spend, adjust targeting |
A lot of teams call this “being data-driven,” but it's really just disciplined commercial management. If your team needs a stronger process for deciding what matters, this guide to data-driven decision-making is worth reading alongside your analytics work.
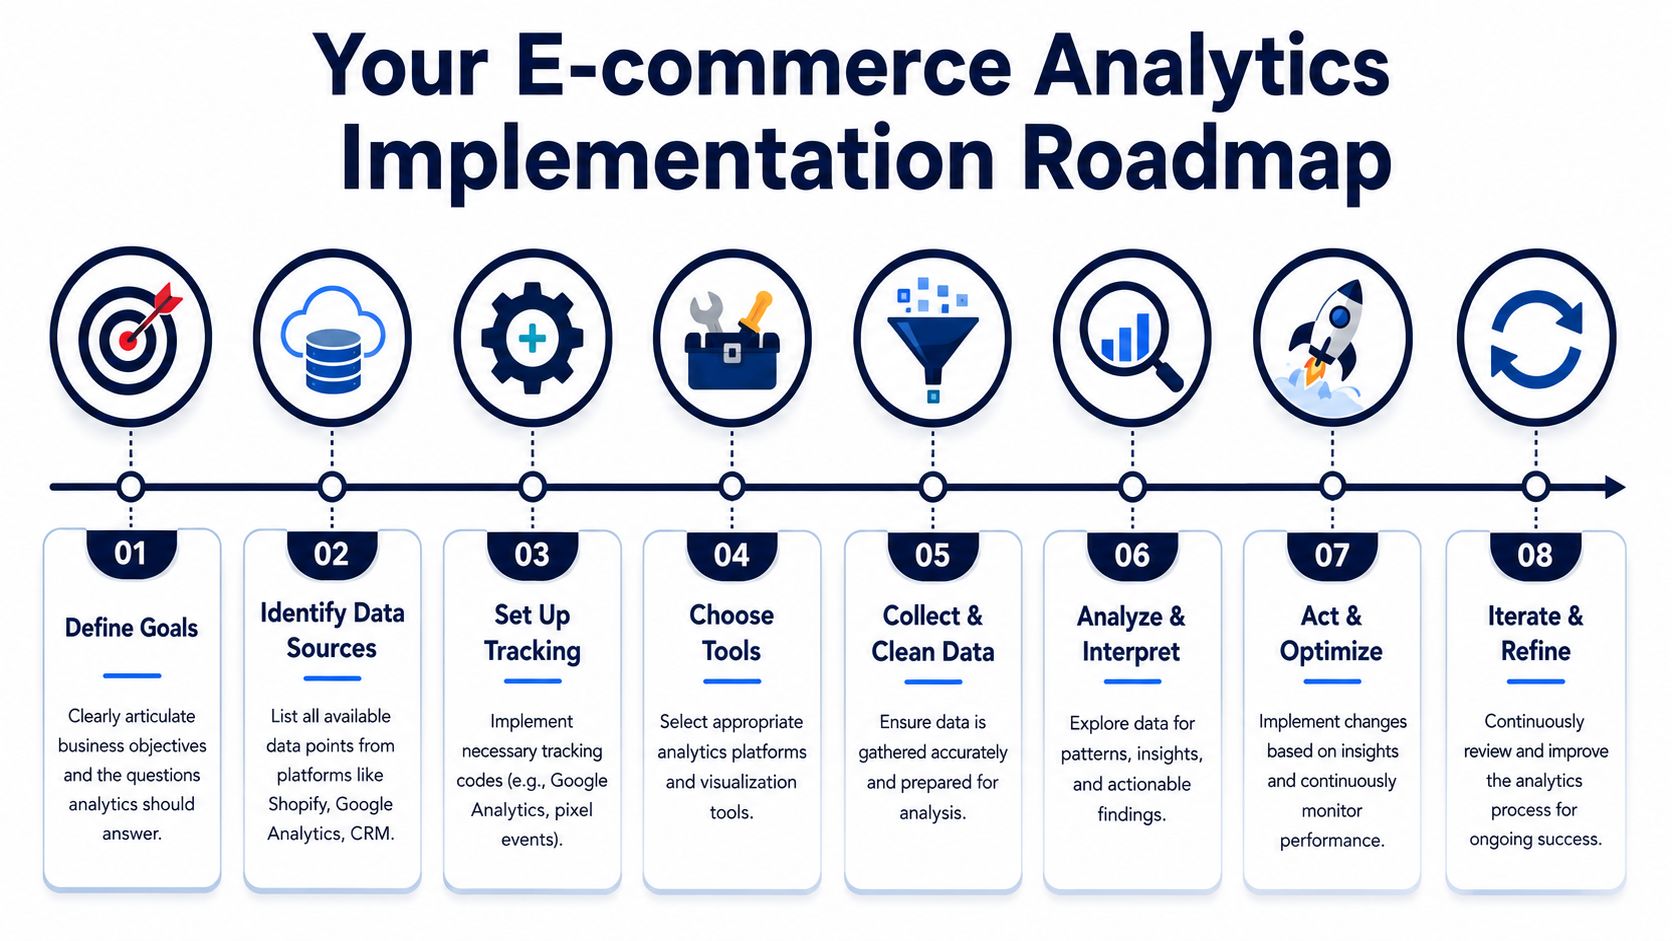
Most brands don't need a data team on day one. They need a progression. Start too small and you stay blind. Start too big and you waste money on tooling nobody uses.
One reason this matters is scale. An industry summary valued the global data analytics market at $49.03 billion in 2022 and reported that data-driven decision-making increased operational productivity to 63%, which is a useful reminder that analytics is tied to efficiency, not just prettier reports, according to this data analytics statistics summary.
At the beginning, the goal isn't sophistication. It's consistency.
You need a usable view across the systems that already run the business:
If those sources don't agree on product names, dates, or order IDs, the first job is cleanup. Many founders skip this because it feels unglamorous. It's not optional. Bad joins create fake insights.
Early on, spreadsheets are fine. They break when too many people edit them, source files change, or weekly reporting turns into manual copy-paste.
At that point, move to a basic warehouse and BI layer. The exact tool matters less than the discipline behind it. You want one trusted place where data lands, gets cleaned, and feeds the reporting your team uses every week.
A healthy middle-market setup often includes:
| Need | Early-stage option | More mature option |
|---|---|---|
| Storage | Google Sheets or Airtable | Warehouse like BigQuery or Snowflake |
| Transformation | Manual cleanup | Scheduled SQL models |
| Visualization | Native dashboards | Power BI, Looker Studio, Tableau, Daasity, Glew |
| Distribution | Shared files | KPI dashboards with owner-specific views |
That's also the stage where dashboard design matters. A cluttered dashboard wastes attention. A tight one drives action. This guide to building a performance metrics dashboard is useful if your current reporting is dense but not decision-ready.
Founders get in trouble when they track everything equally. You don't need more KPIs. You need a hierarchy.
A practical starter set often includes:
Operator's filter: Every KPI should tie to an owner and an action. If nobody owns it, it's trivia.
The first analytics hire usually shouldn't be a data scientist. It should be someone who can clean data, write sensible queries, build clear dashboards, and talk to operators.
That person often sits between finance, marketing, and operations because that's where the commercial truth lives.
If you're not ready for a full-time hire, fractional support can work well. So can leaning on trusted peer communities where founders compare systems, vendors, and reporting setups. For brands exploring where analytics connects with automation and AI, this piece on AI strategies for ecommerce leaders is a good next read.
A short walkthrough can help if you're building this from scratch and want a visual explanation of the moving parts.
You don't need a full warehouse project to get value from analytics. You need a few decisions with immediate commercial payoff.
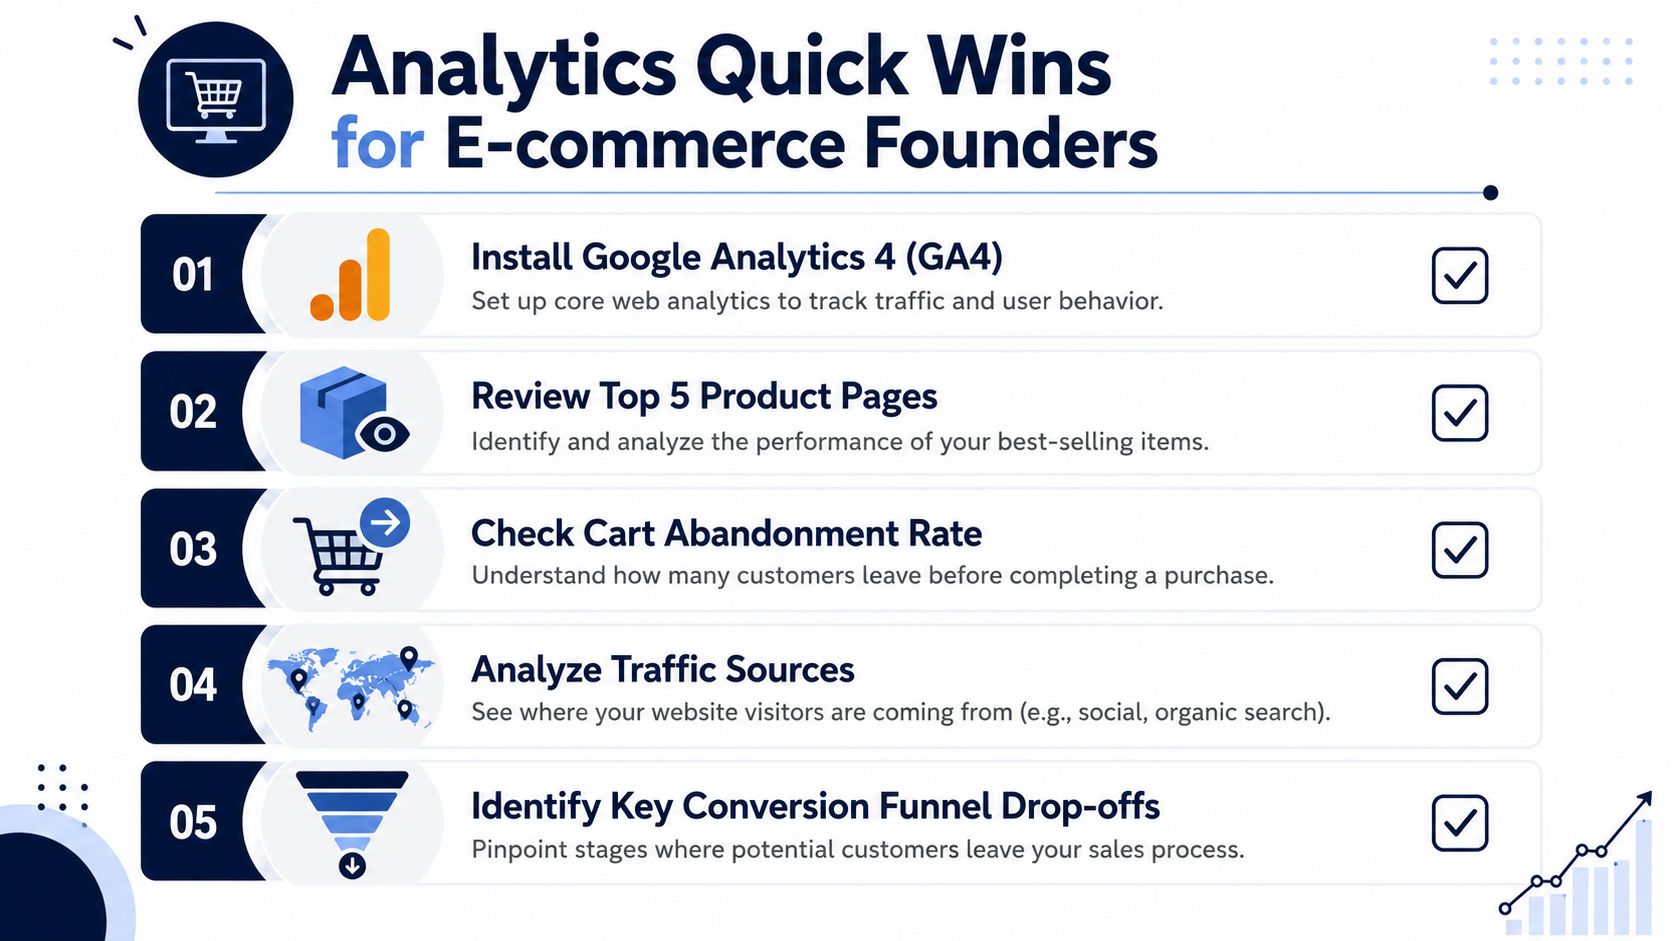
Export your customer list and sort it by recency, frequency, and monetary value. Don't overcomplicate it.
You're looking for three buckets: customers who buy often, customers who used to buy often and have gone quiet, and one-time buyers who only show up on discount. That one exercise can change your email strategy fast. VIPs should get access and retention treatment. At-risk repeat buyers should get win-back attention. Discount-only buyers shouldn't define your offer calendar.
Take your top products and map current stock against recent unit velocity and supplier lead time. The model doesn't need to be perfect to be useful.
What you want is a visible flag for which SKUs need a decision now. Reorder, hold, or intentionally let demand cool. Founders often wait until inventory becomes an emergency because the signal was buried in separate tabs.
Pull campaign-level spend and orders, then compare that view against what happened after purchase. Which campaigns brought low-value customers, high return behavior, or weak repeat performance?
Don't try to optimize everything in one pass. Reallocate budget from weak pockets to stronger ones and watch whether quality improves.
For founders who want a tighter framework for deciding which metrics matter in the first place, this guide to key performance indicators for ecommerce helps keep attention on the few numbers that drive action.
Start with one recurring decision you already make badly. Reorder timing, discount strategy, or budget allocation. Then build the smallest analysis that improves it.
Analytics projects usually fail for boring reasons, not technical ones. The business asks for truth, then rewards speed, opinions, or shiny dashboards instead.

Some teams keep slicing the data until the decision window closes. More cuts, more tabs, more scenario modeling. No action.
At founder level, you rarely get perfect certainty. You get enough signal to place a smart bet. Analytics should reduce uncertainty, not eliminate it.
Traffic is up. Followers are up. Revenue is up. That doesn't mean the business got healthier.
Vanity metrics feel good because they're easy to share. They're dangerous because they can hide declining margin, weak customer quality, or inventory problems. A founder who manages to profit sees a different business than a founder who manages to optics.
Nothing wrecks trust faster than reports that change every time someone refreshes them. If your order totals don't tie, if SKUs are labeled differently across systems, or if refunds are missing, the team will stop believing the numbers.
Then the company falls back to politics. Whoever speaks with the most confidence wins the argument.
A lot of operators buy software before they define the business question. The result is a polished dashboard nobody opens after the first month.
Good analytics doesn't start with tools. It starts with repeated decisions that need better inputs.
Here's the less obvious mistake. Many teams throw away outliers too quickly. One useful perspective from Dataversity's discussion of the art of data analytics is that outliers shouldn't automatically be treated as noise. They can signal new segments, hidden opportunities, or process failures.
That matters in e-commerce.
| Outlier | Lazy interpretation | Better interpretation |
|---|---|---|
| Sudden surge in one SKU | Probably a fluke | Check channel mix, creator mention, or emerging segment |
| Higher refund rate in one product variant | Ignore until trend confirms | Investigate product quality, listing clarity, or fulfillment issue |
| One campaign with odd customer behavior | Platform glitch | Compare first-order economics and repeat quality |
| Unexpected geographic demand pocket | Random anomaly | Test market fit, shipping economics, and local creative |
The point of analytics isn't to prove you were right. It's to notice what your intuition missed.
The cleanest answer to what is data analytics is this: it's an operating capability that turns business data into better commercial decisions. In e-commerce, that means better forecasts, cleaner pricing choices, sharper ad allocation, and stronger retention moves.
Don't treat analytics like a side project for “when the team has time.” Put it where it belongs. Inside the weekly decisions that affect cash flow and profit.
A practical next-step stack for growing brands often looks like this:
If you do one thing after reading this, don't buy another tool yet. Pick one decision that affects profit, build one clean view of the inputs behind it, and force the team to use it every week.
That's how analytics stops being a cost center and starts acting like a profit driver.
Million Dollar Sellers is an invite-only community for serious e-commerce founders who want sharper execution, vetted operator insights, and direct access to peers building across Amazon, DTC, retail, and emerging channels. If you want practical conversations about scaling smarter, visit Million Dollar Sellers.
Join the Ecom Entrepreneur Community for Vetted 7-9 Figure Ecommerce Founders
Learn MoreYou may also like:
Learn more about our special events!
Check Events