
Chilat Doina
September 10, 2026
You can have a warehouse full of product and still lose sales every day. Slow-moving colors, obsolete packaging, and wholesale cartons consume cash while a hero SKU disappears from Amazon or your Shopify store. The problem isn't always that you need more inventory. Often, you need a better answer to where stock should sit, how much service reliability each channel deserves, and when cash should move back into the business.
That's the practical meaning of inventory optimization for an ecommerce brand. It's a working-capital discipline built around demand, supply constraints, lead-time variability, and customer expectations. SAP defines it as calculating inventory targets that meet desired service goals at the lowest possible inventory cost, using algorithms and scenario planning across the supply chain. SAP's explanation of inventory optimization captures the important distinction: the target isn't minimum stock. It's the lowest-cost stock position that supports the service level your business has chosen.
A founder reaches the warehouse and sees inventory everywhere. Pallets are stacked with slow variants, old bundles, and sizes that looked promising at launch. Then the Amazon dashboard shows a hero product unavailable, while the Shopify team is delaying campaigns because the best seller can't support demand.
That paradox is a working-capital trap. Cash trapped in dead inventory can't fund the replenishment order for the product customers want. A brand might hold months of stock on unpopular variants while losing visibility and conversion on its strongest listing. The exact figures vary by business, but the pattern is familiar at both seven and eight figures.
Founder-level diagnosis: A full warehouse doesn't prove that the business has enough inventory. It may prove that inventory is in the wrong SKU, channel, or location.
Gut-feel reordering works when the catalog is small and the founder sees every purchase order. It breaks when sales spread across Amazon, DTC, wholesale, and multiple fulfillment partners. Copying last month's purchase order carries forward old assumptions about demand, promotions, supplier timing, and channel mix.
Treating every SKU alike creates a second failure. A top seller with volatile demand shouldn't have the same reorder logic as a predictable accessory, and a seasonal variant shouldn't be governed by the same target as a replenishable staple.
The operational symptoms usually appear before the financial diagnosis:
A useful starting point is the operational guidance in this MDS guide to preventing stockouts. The fix isn't ordering more. It's assigning different policies to different products and channels, then reviewing whether those policies protect revenue without consuming the cash needed for growth.
Inventory optimization is the process of choosing stock levels, locations, and reorder timing that meet a defined service goal at the lowest practical cost. That cost includes the money tied up in units, landed cost, storage, obsolescence risk, freight decisions, and the operational consequences of running short.
Think about a restaurant kitchen rather than a grocery shopper. A chef doesn't buy the maximum amount of every ingredient. The chef plans prep around expected covers, shelf life, supplier timing, freezer capacity, and the consequences of disappointing a customer. Inventory optimization applies the same logic to products moving through factories, 3PLs, Amazon fulfillment centers, wholesale distributors, and customer orders.
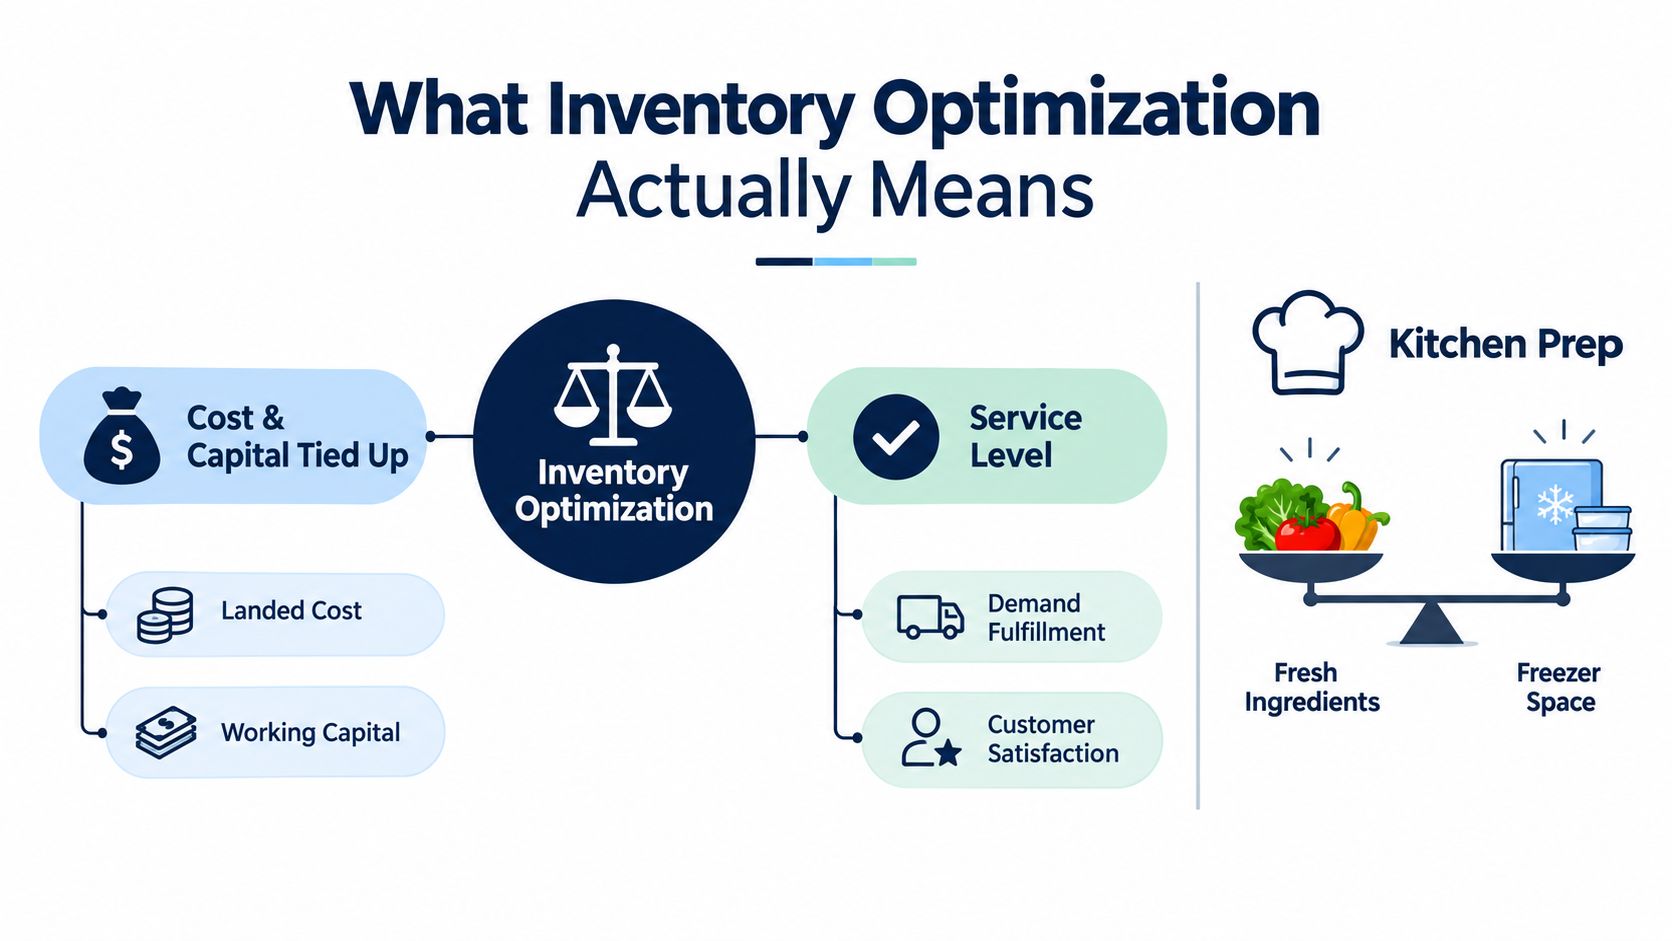
Inventory management records on-hand units, receives purchase orders, tracks shipments, and reconciles warehouse counts. Those controls matter, but they don't answer the strategic questions:
Optimization answers those questions across the network. A unit at a supplier isn't equivalent to a unit at a 3PL, and a unit at a 3PL isn't necessarily available for an Amazon order without a transfer delay. The business needs a network view rather than a single spreadsheet total.
Every inventory decision sits between cash, service level, and lead-time variability. Increasing safety stock can protect availability, but it also ties up capital. Reducing stock can improve liquidity, but it exposes the business to supplier delays and demand spikes. Shorter lead times may allow leaner positions, while unreliable lead times require more protection or a different supplier strategy.
The target also changes by channel and by week. Amazon may require inventory positioned early enough to protect listing availability, while DTC can sometimes use a more responsive warehouse. Wholesale orders may be constrained by customer commitments and production batches. There isn't one universal “optimal stock level” for a SKU. There are channel-specific policies connected to a shared product master.
Inventory decisions touch the P&L through three routes. A stockout can remove revenue and waste paid traffic, excess stock can consume cash and storage capacity, and unreliable fulfillment can damage the buying experience through backorders, split shipments, or late deliveries.
The bullwhip effect makes naive ordering worse. In classic supply-chain research, four structural causes are identified: demand signal processing, order batching, shortage gaming, and price variations. The original bullwhip-effect research explains why a small change in customer demand can become a much larger order swing upstream. Each participant reacts to a partial signal, and lead times give those reactions time to compound.
A forecast isn't just a prediction. It becomes a purchasing decision, a production batch, a freight commitment, and eventually a cash-flow decision.
A founder often evaluates inventory by unit margin and misses the financing cost of waiting for the sale. The longer a slow SKU sits, the longer the business carries its purchase cost, storage expense, insurance exposure, and markdown risk. This overview of inventory carrying cost is useful because it connects holding inventory to the broader cash equation rather than treating storage as an isolated warehouse line.
The practical consequence is that inventory optimization can be a more impactful decision than adding another channel. Before expanding, ask whether the current network can place the right units in the right channel, whether purchase orders reflect actual demand signals, and whether the business can finance the growth without filling the warehouse with speculative stock.
| Outcome | Revenue Impact | Cash Flow Impact | Customer Experience Impact |
|---|---|---|---|
| Hero SKU stockout | Missed orders, interrupted advertising, weaker channel momentum | Replenishment may require rushed freight or unfavorable terms | Customers wait, switch products, or choose another seller |
| Slow-moving overstock | Discounting and reduced assortment productivity | Cash remains tied up in aged units and storage | Customers encounter confusing variants or unavailable popular options |
| Poor channel allocation | One channel misses demand while another holds excess | Transfers and rebalancing consume operational cash | Delivery promises become inconsistent |
| Unreliable supplier timing | Campaigns and launches become difficult to support | Emergency purchase decisions increase cost exposure | Backorders and delayed delivery reduce trust |
Academic simulation work also shows why service-level policy matters. Explicit safety-stock optimization lifted simulated service levels from 94.8% to 98.8% compared with no safety stock, with lower variability in service outcomes as the policy became more deliberate. The safety-stock simulation research doesn't mean every brand should target the highest possible service level. It shows that the target needs to be chosen and managed, not left to intuition.
Founders don't need to jump straight into a complex planning platform. The strongest approach is layered. Start with clean visibility, add simple rules, then increase model sophistication only when the business has enough reliable data and operational complexity to justify it.
For an early-stage catalog, a moving average can establish a useful baseline. As SKU count and channel mix grow, weighted averages can give recent demand more influence, while seasonality-adjusted or exponential-smoothing methods can separate recurring patterns from temporary noise. Promotions, launches, stockouts, and price changes must be marked, or the model may interpret constrained sales as weak demand.
A forecast should produce a range of plausible demand, not just one number. The wider the uncertainty and the less dependable the supplier, the more carefully the business needs to set its buffer.
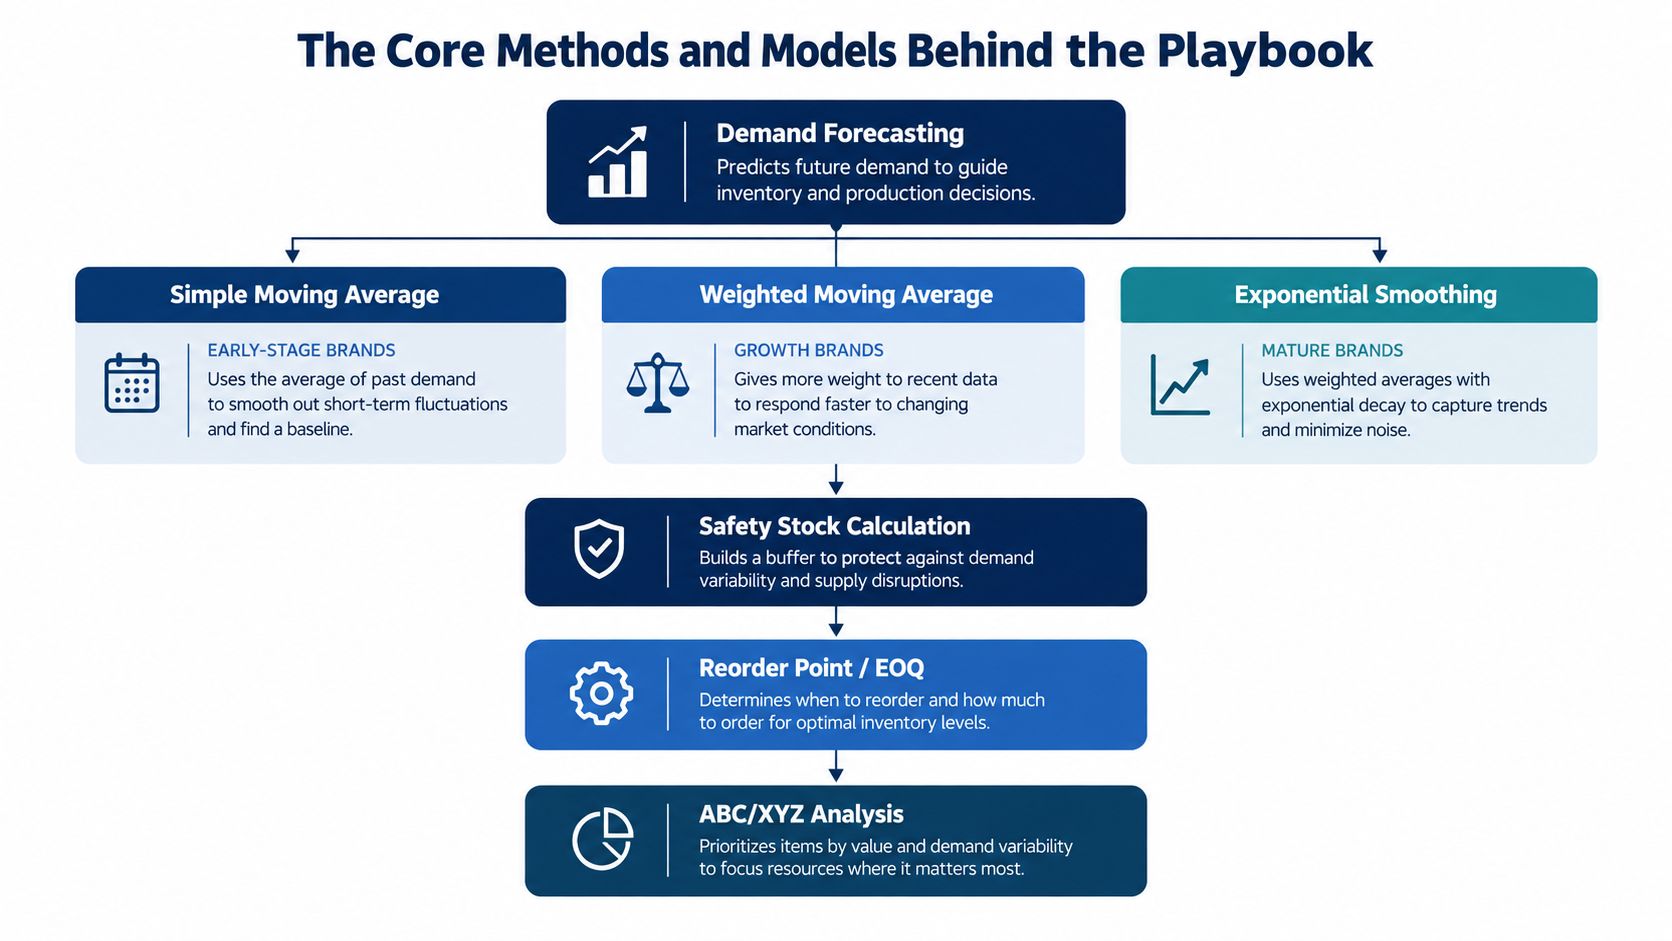
Safety stock should reflect a chosen customer service level, demand variability, and lead-time variability. Reorder points then connect expected demand during lead time with the buffer required for uncertainty. A reorder point based only on average daily sales is fragile because it ignores what happens when the supplier ships late or demand accelerates.
For a founder, the important discipline is not memorizing a formula. It's documenting the assumptions and reviewing whether they still match reality.
The ecommerce demand forecasting guide from MDS provides useful context for building this foundation. For a broader operational example outside conventional ecommerce, Vendmoore Enterprises vending inventory offers another perspective on matching replenishment decisions to actual product movement and location-level demand.
ABC analysis separates products by financial importance or contribution, so the team spends more attention on the items that matter most. XYZ classification adds demand predictability. An A-X product is commercially important and relatively predictable, while an A-Z product is important but volatile. Those combinations deserve different review frequencies, buffers, and escalation rules.
Multi-echelon thinking becomes necessary when units sit at several nodes. Stock at an Amazon fulfillment center, a 3PL, a factory, or a wholesale distributor has different availability, transfer timing, and customer obligations. Multi-echelon inventory optimization treats those positions as an interconnected network instead of allowing each node to build a separate defensive buffer.
A dashboard can look busy while the business gets poorer. The useful metrics connect inventory policy to customer availability, cash velocity, and gross profit.
Service level is the customer promise. Track fill rate for demand fulfilled from available stock, and OTIF when delivery timing matters. A high aggregate service level can hide a serious problem if the result is carried by low-priority SKUs while the products that drive acquisition and repeat purchase remain unavailable.
Inventory turnover shows how quickly stock converts through the business, but it needs category context. Sell-through rate often gives a seven-figure founder a clearer first signal because it exposes whether purchased units are moving before more capital gets committed. GMROI, or gross margin return on inventory investment, asks the harder question: how much gross margin does each dollar of stocked inventory produce?
At seven figures, focus on SKU-level sell-through, aged inventory, and the relationship between purchase orders and actual demand. The goal is to stop cash leakage before the catalog becomes too complicated to manage manually.
At eight figures, channel-level profitability matters more. Review OTIF and GMROI separately for Amazon, DTC, and wholesale, because one channel's healthy turnover can conceal another channel's service failure or margin drag.
| KPI | 7-Figure Focus | 8-Figure Focus | Healthy Range |
|---|---|---|---|
| Service level | Protect hero SKUs and identify avoidable stockouts | Set channel-specific targets and review exceptions | Depends on promise, margin, and customer tolerance |
| Inventory turnover | Find slow movers and prevent repeat buys | Compare turns by channel, category, and location | Category and channel dependent |
| Sell-through | Decide which SKUs deserve the next purchase order | Connect sell-through to promotions, allocation, and replenishment | Varies with lifecycle and seasonality |
| GMROI | See whether inventory produces enough gross margin | Compare return on inventory capital across channels | Depends on gross margin and operating model |
Don't chase a benchmark without understanding the category. A turnover level that looks acceptable in one assortment can indicate stockout risk in another. The right question is whether the metric supports your chosen service level while releasing cash from inventory that doesn't earn its keep.
The same SKU can need three different inventory policies. Treating Amazon, Shopify, and wholesale as identical demand pools creates false precision because each channel has its own promise, replenishment path, and penalty for being wrong.
Amazon requires forward positioning and careful replenishment planning. Stockouts can affect listing momentum and customer availability, while slow-moving units create storage pressure. The practical posture is usually a disciplined buffer on proven winners, close monitoring of inbound timing, and fast action on products that aren't moving as planned. Repricing and advertising decisions should reflect the actual inventory runway, not just the campaign calendar.
DTC gives the brand more control over fulfillment, merchandising, and customer communication. A central warehouse may support deeper protection for hero SKUs, while bundles, subscriptions, and variant tests can change the demand profile quickly. The trade-off is that the brand owns the customer promise directly, so inventory decisions affect shipping speed, split shipments, and support workload.
Wholesale introduces commitments, case packs, minimum order quantities, and longer planning windows. A purchase order may be economical at the factory but excessive for the current retail demand. Forecasting and allocation must account for agreed customer orders without allowing wholesale batches to consume the units needed for higher-contribution DTC or marketplace demand.
For operators building an omnichannel model, these simple inventory tips for makers provide a practical reminder to keep availability and synchronization visible across selling surfaces.
| Channel | Lead Time | Safety Stock Posture | Top KPI | Biggest Trade-Off |
|---|---|---|---|---|
| Amazon FBA | Inbound and fulfillment timing must be planned in advance | Protect proven winners, but avoid letting slow movers accumulate | Availability and channel-specific profitability | Ranking and sales continuity versus storage exposure |
| DTC Shopify | Brand-controlled fulfillment can respond more directly | Hold protection where the customer promise and contribution justify it | Sell-through, delivery performance, and GMROI | Conversion and experience versus cash tied up |
| Wholesale | Production batches, MOQs, and customer commitments shape timing | Use disciplined buffers around supplier and order uncertainty | OTIF, order profitability, and forecast adherence | Batch economics versus flexibility |
| Omnichannel | Multiple replenishment paths compete for shared units | Allocate by channel promise and contribution | Channel-level service and GMROI | One shared supply base versus different customer promises |
A founder running all three should manage three inventory problems with one SKU master, not one undifferentiated pool divided by instinct. The units may be physically related, but their commercial value changes with location and commitment.
A new forecasting tool can't compensate for unreliable inputs. Algorithms learn from the sales history, lead times, product relationships, and channel labels the operator gives them. If those inputs contain stockout-censored demand or incorrect supplier timing, the output can look precise while recommending the wrong purchase.
The most dangerous leadership mistake is accepting a green dashboard without checking whether demand sensing reflects reality. A model may report healthy projected coverage because it doesn't know a promotion is starting, a supplier has slipped, or an important listing lost visibility.
Governance rule: Automation can recommend the purchase order. It shouldn't remove human review from the revenue-critical SKUs.
Before buying software, clean the item master and establish a baseline using the current method. When testing a new model, compare out-of-sample forecast error over a meaningful review window, such as 13 weeks, against the existing approach. Then keep human approval for the top 20% of SKUs by revenue, especially when market conditions are volatile. Those thresholds are operating rules for governance, not universal laws, and each business should document why it chose them.
Inventory optimization works best as a focused working-capital project. Start with the SKUs and channels where a wrong purchase decision can trap cash or create a stockout. Amazon may reward high availability, DTC may require room for campaign spikes, and wholesale commitments can force inventory into lower-margin orders. One stock target will not serve all three.
Pull 12 months of unit sales by SKU, current on-hand inventory, open purchase orders, supplier lead times, landed costs, and channel allocation. Calculate inventory turnover and weeks on hand, then classify the catalog with ABC analysis. Identify the 10% of items tying up the most cash. Separate true slow movers from products intentionally held for a seasonal launch, promotion, Amazon replenishment window, or wholesale commitment.
Add channel context before changing reorder rules. A DTC item may look overstocked against its recent sales while a planned campaign needs that inventory. An Amazon SKU may justify more protection against lost ranking, while a wholesale order can consume stock that appeared available for direct customers.
Set reorder points for A items first. Use a simple service-level approach to define safety stock, document lead-time assumptions, and align purchase-order cadence with supplier realities. Keep the rules visible. Operators should know which inputs trigger a buy, how much uncertainty the buffer covers, and when a founder must approve an exception.
A weekly review should flag stockouts, excess coverage, late purchase orders, channel conflicts, and demand changes. The goal is a faster decision process, not a full forecast rebuild every week.
Layer in forecasting after the baseline rules are stable. Review service level, sell-through, turnover, aged inventory, and GMROI by channel. Check whether the tools can handle multiple warehouses, marketplace inventory, wholesale commitments, and transfers. If they cannot, the first phase provides a business case for upgrading instead of buying software based on a demo.
The broader market reflects this shift beyond spreadsheets. One 2026 market analysis estimated the global inventory optimization market at USD 6.60 billion in 2026 and projected USD 14.02 billion by 2033, implying an 11.5% CAGR over that period. The market analysis from Coherent Market Insights describes tools built around algorithms and scenario planning for demand, supply, and service-level targets. A separate 2026 industry projection puts inventory optimization software at USD 1.44 billion in 2026 and USD 2.31 billion by 2031, with a 9.91% CAGR, identifying North America as the largest market and Asia Pacific as the fastest-growing region. That projection supplies the second market context.
Inventory optimization is a weekly allocation decision. Put the next dollar of working capital where it protects service and contribution, then adjust the answer by channel.
Million Dollar Sellers gives qualified ecommerce founders a private peer environment for sharing practical strategies across Amazon, DTC, and omnichannel operations, including the realities of scaling inventory and cash flow. If you're ready to compare your decisions with other seven-, eight-, and nine-figure operators, visit Million Dollar Sellers to learn how the community works.
Join the Ecom Entrepreneur Community for Vetted 7-9 Figure Ecommerce Founders
Learn MoreYou may also like:
Learn more about our special events!
Check Events


