Chilat Doina
July 1, 2026
Inventory turnover ratio tells you how many times you sell and replenish your inventory over a period, and the standard formula is COGS / Average Inventory. In most industries, 5 to 10 turns is often treated as healthy, but that headline number can mislead ecommerce founders if they ignore margin structure.
If you're sitting on a warehouse full of product, watching cash get tighter while sales reports look “fine,” this metric matters more than most founders realize. Inventory turnover ratio isn't an accounting trivia term. It's one of the clearest ways to see whether your cash is working or sleeping on a shelf.
For Amazon sellers and DTC operators, that distinction gets expensive fast. A ratio can look respectable while the business still bleeds from storage costs, weak reorder discipline, and poor gross profit velocity. That's why serious operators don't just ask what is inventory turnover ratio. They ask what their number means for their margin profile, lead times, and cash position.
You wire a large PO because lead times look shaky. Sixty days later, sales are decent, but cash is tight, ad spend is getting trimmed, and the warehouse is full. That is what trapped cash looks like in ecommerce.

The problem often shows up as a cash flow crunch long before anyone calculates the ratio. Inventory turnover gives you a practical way to see whether inventory is producing cash or just consuming it.
If you need a plain-English refresher, this inventory turnover definition covers the basics. What matters for operators is what the number reveals about buying discipline, margin structure, and how much room the business has to breathe.
Turnover sits right at the intersection of merchandising, operations, and finance. You can have healthy revenue and still create a cash problem if too much money stays tied up in inventory for too long.
Here is where founders get burned. Generic advice says higher turnover is always better. That is not how serious ecommerce businesses run.
High turnover can be a trap too. If a low-margin brand keeps chasing ultra-fast turns but stocks out every few weeks, it can lose ranking, ad efficiency, and repeat purchase momentum. On the other side, a premium brand with strong margins may accept lower turns on hero SKUs because the cost of going out of stock is higher than the cost of carrying extra units.
That is the core purpose of this metric. It helps you judge whether your inventory position matches your economics.
You will usually see the issue before you see it in a spreadsheet.
I have seen brands with strong top-line growth still end up cash-poor because they kept buying for optimism instead of demand. If that pattern sounds familiar, working capital optimization starts with tighter inventory decisions, not another sales dashboard.
A founder looks at the warehouse and sees “inventory.” The cash flow statement sees trapped cash. If you calculate turnover with sloppy inputs, you will make the wrong reorder decisions and convince yourself the business is healthier than it is.
Use this:
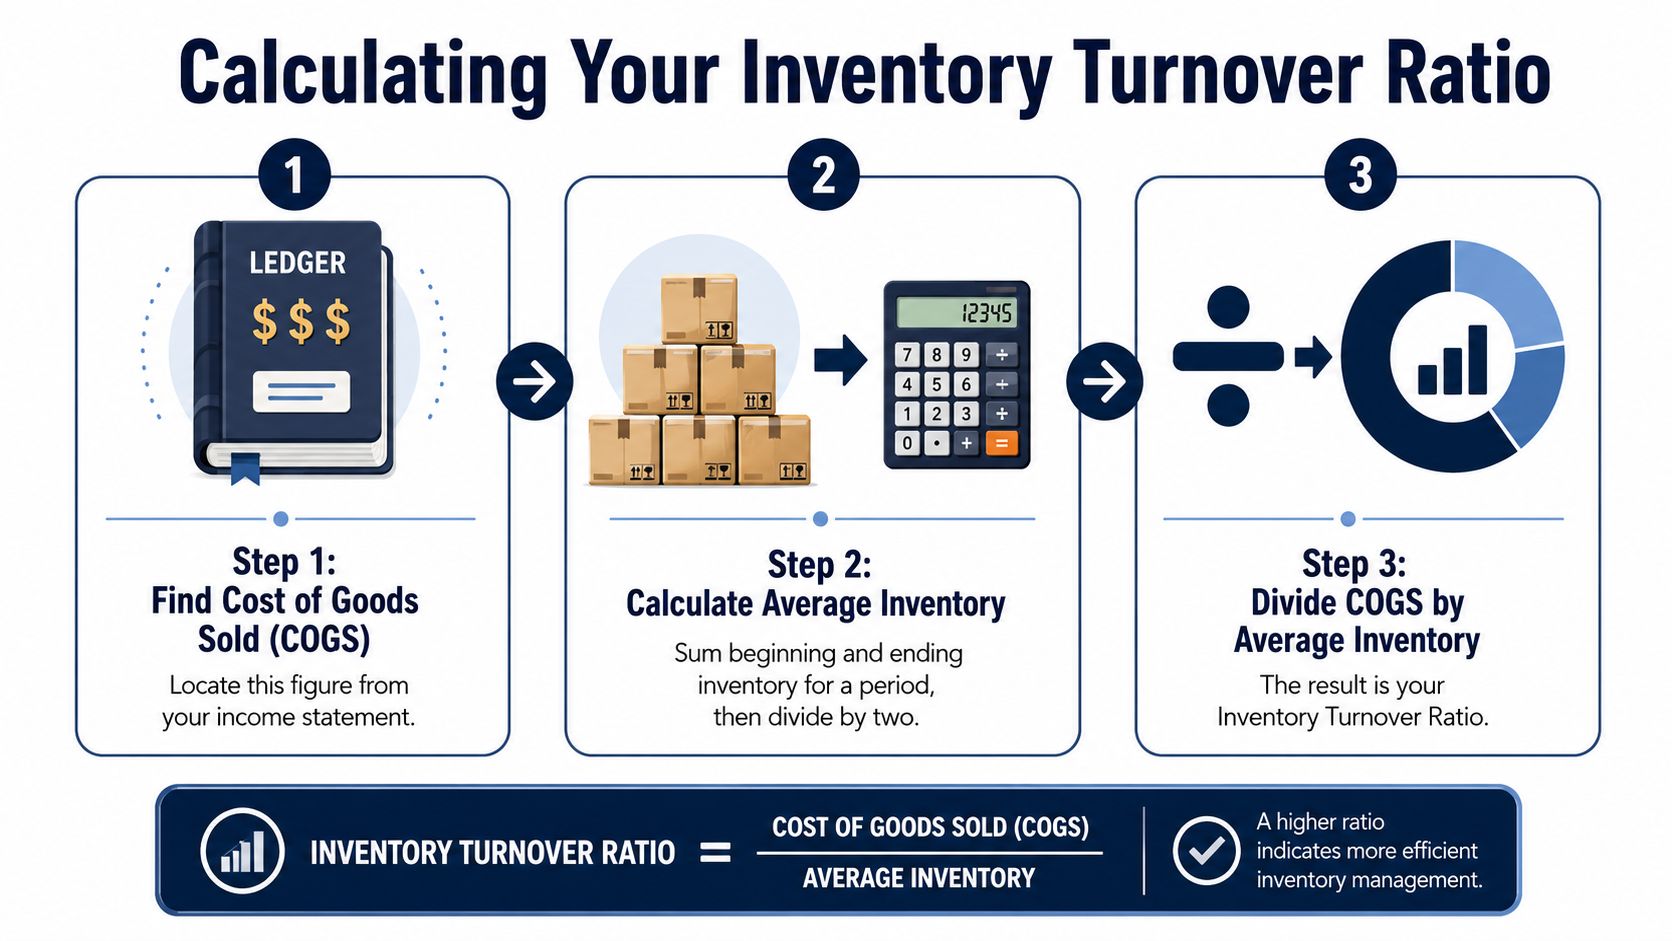
Inventory Turnover Ratio = COGS / Average Inventory
Average inventory is:
(Beginning Inventory + Ending Inventory) / 2
If you want a plain-English refresher before building your spreadsheet, this inventory turnover definition is a solid reference.
The math is simple. The discipline is in pulling numbers from the right places and keeping the time period clean.
COGS should come from your income statement for the exact period you are measuring. In QuickBooks, Xero, NetSuite, or another accounting system, use the booked COGS figure from the P&L.
Do not swap in supplier spend, landed cost estimates, or a rough export from Shopify. Those shortcuts break the metric fast, especially if receipts, returns, and timing differences are hitting your books unevenly.
For ecommerce brands, this matters more than people admit. A low-margin business can look “efficient” on paper if it overstates turns with bad COGS inputs. That usually leads to tighter buys, more stockouts, and worse unit economics. A high-margin brand has more room to carry buffer inventory, but the ratio still needs to be grounded in real accounting data or the benchmark means nothing.
For Average Inventory, take the inventory value at the beginning of the period and the inventory value at the end of the period, add them together, and divide by two.
That gives you a better operating view than using one month-end snapshot, especially if you placed a large PO right before the cutoff date.
A clean workflow looks like this:
After you have the ratio, pair it with inventory days on hand so the team can translate annual turns into a number they can use in weekly inventory meetings.
A quick example makes it concrete. If annual COGS is $1,200,000, beginning inventory is $200,000, and ending inventory is $300,000, average inventory is $250,000. Divide $1,200,000 by $250,000 and your turnover ratio is 4.8.
Later in your review process, it helps to watch someone walk through the math visually:
Clean inputs first. Then use the number to judge whether your turnover fits your margin structure, not someone else's rule of thumb.
A founder looks at a 6x turnover ratio and feels good for five minutes. Then payroll hits, ad costs rise, and cash is still tight. I've seen that happen more than once. The ratio looked healthy. The business wasn't.
That's why the usual advice breaks down here. A blanket target like 5 to 10 turns is too broad to guide buying decisions in ecommerce. A good ratio depends on margin, lead times, stockout cost, and how much cash each inventory cycle puts back into the business.
A decent turnover ratio can still be bad for the company behind it.
Low-margin brands need inventory to move fast because every unit sold carries less room for freight spikes, return costs, discounts, and paid acquisition volatility. High-margin brands have more flexibility. They can afford to hold deeper inventory on proven SKUs if that protects conversion rate, customer experience, and repeat purchase behavior.
A “good” turnover ratio without context is like a “good” TACoS target without knowing your margin. The number alone isn't strategy.
High turnover is not automatically a win. For a low-margin brand, it can still mean the business is starving for cash because each turn does not generate enough gross profit to fund the next purchase order, cover operating expenses, and absorb mistakes. Chasing a generic benchmark can make that problem worse because it creates false confidence.
Extensiv makes this point clearly in its discussion of a good inventory turnover ratio. The useful takeaway is not a universal number. It is that the right target changes with your margin structure. A consumables brand with thin contribution margins often needs much faster turns than the internet's standard advice suggests. A premium brand can perform well with fewer turns if the gross margin is strong and stockouts are expensive.
That matches what operators see in the field. A low-margin seller usually wins by buying tighter, replenishing faster, and refusing to carry passengers. A high-margin seller often wins by protecting in-stock rates on core products, even if that lowers blended turnover.
| Metric | Low-Margin Brand (e.g., Consumables) | High-Margin Brand (e.g., Luxury Goods) |
|---|---|---|
| Primary goal | Maximize gross profit velocity | Protect availability and margin quality |
| Risk of “average” turns | Can look healthy while cash stays tight | Can create unnecessary pressure to understock |
| Better operating posture | Faster replenishment, tighter buys, less dead stock | Deliberate safety stock on core winners |
| Response to slow sellers | Cut quickly | Hold selectively if assortment value matters |
| View of stockouts | Can erase already-thin economics | Can be more damaging than slower turnover |
| What works | Small, frequent orders and ruthless SKU discipline | Depth in high-conviction SKUs and careful assortment planning |
Ask a harder question than “Is my turnover ratio good?”
Ask whether your current inventory level creates enough gross profit, fast enough, to keep the business funded without constant cash stress. Then pressure-test that answer against your lead times and stockout risk.
Use these questions in your next inventory review:
Serious sellers do not manage to a generic turnover benchmark. They manage to cash flow, margin quality, and product availability.
A turnover ratio is a symptom reader. It tells you where to look next.
Fishbowl's discussion of the metric notes that the COGS method gives a more accurate and reliable picture because it reflects the direct cost of producing or purchasing goods. It also points out that a high inventory turnover ratio generally indicates a business is using inventory effectively, managing stock well, and converting goods into sales rapidly, which is a positive sign of business health (Fishbowl Inventory).
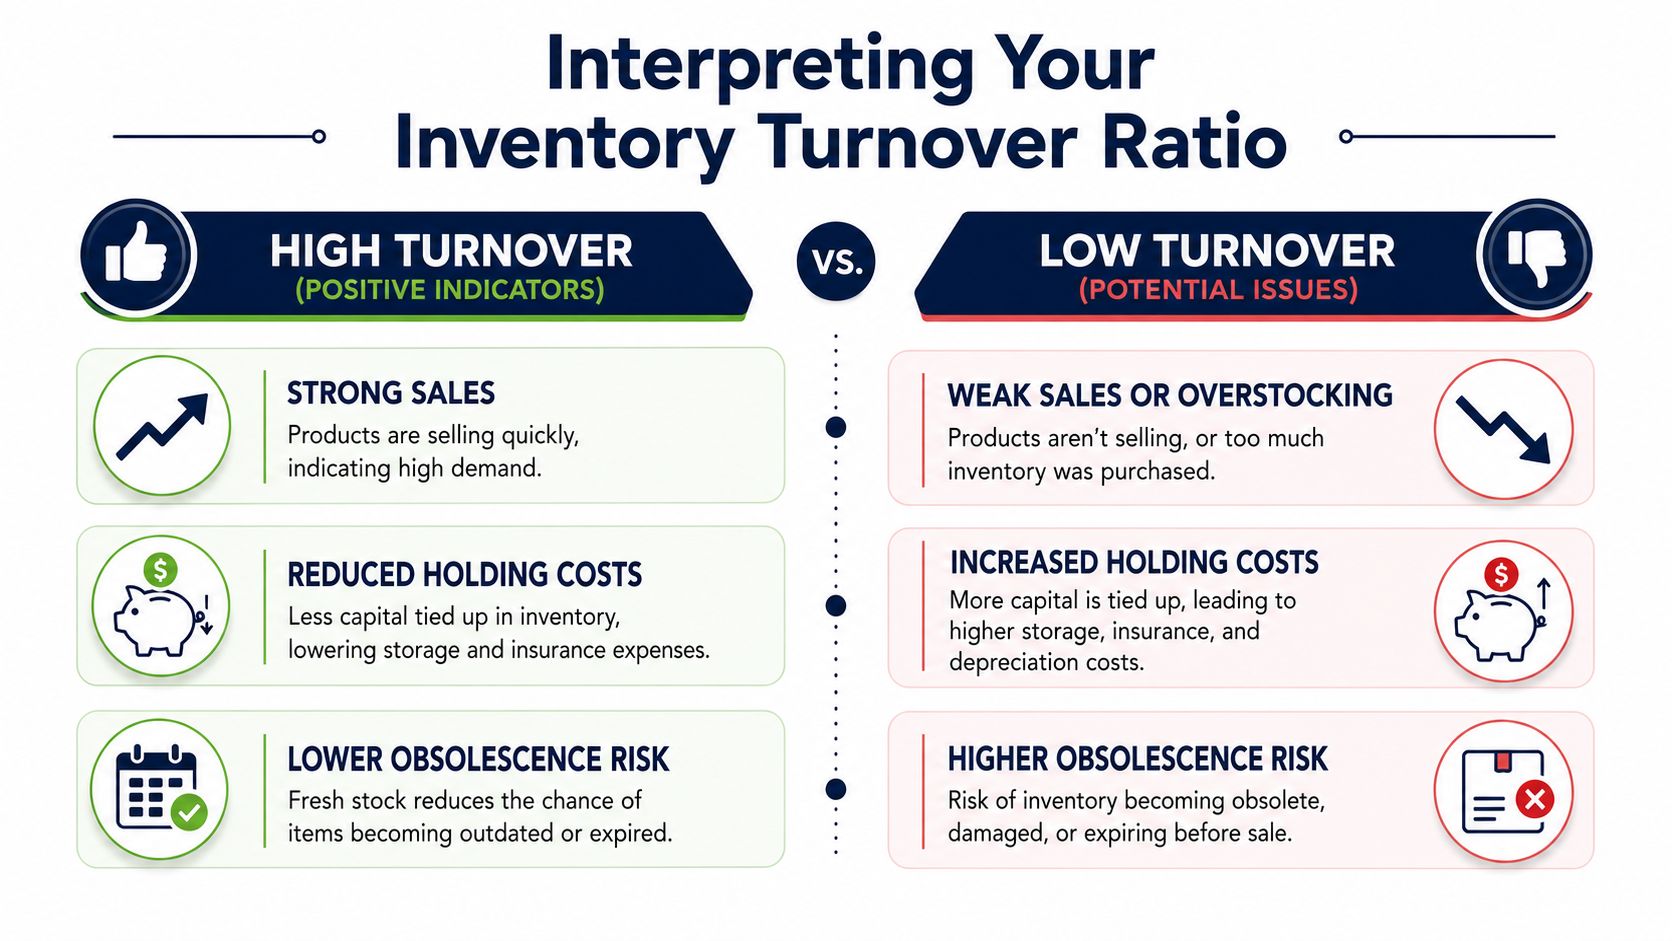
Usually, that means a few things are going right:
But high turnover can also mean you're cutting it too close. On Amazon, that can show up as avoidable stockouts on winning ASINs. On Shopify, it might mean your purchasing team is always reacting instead of planning.
Low turnover usually points to one of three root problems.
First, you bought too much. Second, the product isn't selling the way you expected. Third, your assortment includes too many SKUs that don't deserve shelf space.
Here's what low turnover tends to look like operationally:
Low turnover usually isn't one bad SKU. It's a purchasing habit.
A high number isn't automatically good, and a low one isn't automatically bad. You need to read it against margin, lead time reliability, SKU count, and whether the business model depends on constant availability.
If your top sellers move fast but your tail is dead, the blended ratio can hide the actual story. Diagnose by channel, category, and SKU family, not just at the total-company level.
The fix usually isn't “run a sale.” That's what people do when they waited too long.
The fastest way to improve turnover is often subtraction.
Run a SKU review and separate products into clear buckets. Your A items earn replenishment priority. Your B items need tighter buy logic. Your C and D items should face a hard question: are they strategic, or are they just taking up cash and warehouse space?
A lot of slow turnover starts at the PO level. Founders overbuy to get pricing breaks, hit MOQ thresholds, or soothe anxiety about stockouts. Then they spend the next quarter trying to unwind the decision.
Smarter operators negotiate for flexibility, not just price.
Good forecasting doesn't mean perfect forecasting. It means updating your assumptions before old assumptions become expensive.
For teams that want a practical read on demand forecasting for Shopify merchants, this resource is worth reviewing alongside your own replenishment process. Then pressure-test your forecast against actual sell-through, promo calendars, and channel-specific demand patterns.
Markdowns work, but they can weaken brand equity if you overuse them. Better options often include bundles, multipacks, and offer structures that increase perceived value.
The goal isn't to empty the shelf at any cost. The goal is to free cash without damaging the brand.
A few levers that work better than blanket discounting:
Most brands don't need more spreadsheets. They need a repeatable operating rhythm.
Review core SKUs weekly. Review the full assortment monthly. Tie purchasing decisions to current demand, not old forecasts. If your team needs a stronger process, these inventory optimization techniques are a good place to refine the basics before complexity creeps back in.
Turnover ratio is powerful, but it's incomplete on its own.
A founder who only watches turns can still miss how long inventory sits in practical terms and whether that inventory is generating enough profit. That's why I like pairing turnover with days of inventory outstanding and GMROI.
Days of inventory outstanding translates turnover into time. Instead of saying inventory turns at a certain rate, you say the business is carrying roughly a certain number of days of stock. That makes planning easier for operators, buyers, and finance teams.
GMROI stands for gross margin return on inventory investment. It asks a different question than turnover. Not how fast inventory moves, but how much gross margin that inventory produces relative to what you invested in it.
Use turnover to spot speed. Use days on hand to make the number operational. Use GMROI to keep profitability in the conversation.
That combination catches problems early:
No single metric should run your inventory strategy. Good operators use a dashboard, not a favorite number.
For financial analysis, use the cost-based method. It's the standard approach and gives a cleaner picture of how inventory is being used in the business. In warehouse operations, some teams also track units shipped against average units on hand because it's easier for operators to connect to daily execution. Use cost for finance, and use units as a supplemental operational lens when helpful.
Don't judge a seasonal SKU only on an annual blended ratio. Review it in the context of its actual selling window, reorder timing, and peak demand period. Seasonal inventory can look weak in the off-season and still be healthy if the buy was intentional and the sell-through is on plan.
Most brands should calculate it consistently and review it on a recurring management cadence. Monthly reviews are useful for active purchasing decisions. Quarterly reviews are useful for broader trend analysis. The important part is consistency. If you only look when cash gets tight, you're already late.
No. High turns can reflect strong demand and efficient inventory use, but they can also signal inventory that's too lean. If your best sellers keep going out of stock, the ratio may look great while the business loses revenue and ranking.
You want turnover tied to a broader scorecard that includes margin, contribution, stock coverage, and channel performance. If you're building out that dashboard, this guide on how to master e-commerce KPIs is a useful companion to your inventory reviews.
Serious sellers get better faster when they compare notes with operators dealing with the same inventory, margin, and cash flow decisions at scale. If you want that level of peer group, Million Dollar Sellers is where top ecommerce founders share what's working behind the scenes.
Join the Ecom Entrepreneur Community for Vetted 7-9 Figure Ecommerce Founders
Learn MoreYou may also like:
Learn more about our special events!
Check Events