


Stay Updated with Everything about MDS
Thank you! Your submission has been received!
Oops! Something went wrong while submitting the form.
Chilat Doina
January 30, 2026
When you're staring at a warehouse packed to the gills with products, it can feel a lot like looking at piles of trapped cash. The secret to unlocking that capital lies in mastering a metric called Inventory Days on Hand (DOH). It’s a simple number that tells you exactly how long it takes, on average, to sell through your entire inventory. Getting a handle on how to calculate your inventory days on hand is the very first step toward healthier cash flow and much tighter operational control.
For any ecommerce brand, inventory is a double-edged sword. It's your greatest asset—the very thing you sell to make money—but it's also your biggest liability. Every box on those shelves represents cash that isn't being invested in growth. This is where DOH stops being just another number on a spreadsheet and starts acting as a vital sign for your business's financial health and overall efficiency.
Picture a DTC brand gearing up for the holiday shopping frenzy. If they nail their DOH calculation, they can stock just enough product to meet the surge in demand without getting stuck with a mountain of unsold, out-of-season goods come January. But if they get it wrong? It creates a cascade of problems.
A high DOH isn't just a symptom of slow sales; it's a silent business killer. It means your cash is frozen in products that aren't generating revenue, racking up storage fees, risking obsolescence, and preventing you from investing in faster-moving items.
Think about the ripple effect of holding on to too much stock. A high DOH—meaning it takes a long time to clear out your inventory—chips away at your bottom line in a few key ways:
On the flip side, a DOH that's too low can be just as damaging. Sure, it means you're selling products incredibly fast, but it also puts you at a high risk of stocking out. Running out of a popular item means lost sales and, even worse, frustrated customers who might just head over to a competitor. The real goal isn't to hit the lowest number possible, but to find that sweet spot—the optimal balance for your specific business.
Ultimately, learning how to calculate inventory days on hand is about taking back control. It transforms a reactive, often stressful part of your business into a real strategic advantage. Once you understand how quickly different products, categories, or even sales channels are turning over inventory, you can start making much smarter decisions.
This knowledge gives you the power to:
This guide will walk you through exactly how to calculate this vital metric, what it actually means for your brand, and how to use it to drive smarter purchasing, healthier cash flow, and scalable growth. It’s time to turn that trapped cash back into working capital.
Jumping right into the numbers is the fastest way to get a clear picture of your inventory's health. The most reliable way to figure out your Days on Hand (DOH) is built on a straightforward formula. Don't let the components scare you off; each part is easy to find and plug in.
The classic formula looks like this: (Average Inventory / Cost of Goods Sold) x Number of Days in Period
This equation gives you a precise snapshot of how long your capital is tied up in products before they turn into revenue. To really make it work for you, though, you need to know exactly where each number comes from and what it represents. Let's break down each piece so you can calculate your DOH with total confidence.
First up is Average Inventory. This isn't just what your stock is worth today; it's a balanced figure that smooths out the peaks and valleys over a specific time. Calculating it this way ensures a recent huge shipment or a holiday sales rush doesn't throw your final DOH number out of whack.
Here’s the simple calculation to find it:
Average Inventory = (Beginning Inventory Value + Ending Inventory Value) / 2
Your Beginning Inventory is the total value of your stock at the start of your chosen period (say, January 1st). The Ending Inventory is its value at the period's close (like December 31st). You can pull these numbers straight from your accounting software, inventory management system, or the reporting tools in platforms like Shopify or Amazon Seller Central.
Next, we need your Cost of Goods Sold (COGS). Getting this number right is absolutely crucial for an accurate DOH calculation. COGS should only include the direct costs tied to getting your products ready to sell.
This typically includes:
It’s just as important to know what not to include. Leave out indirect costs like your marketing budget, warehouse rent, or employee salaries. Factoring those in will inflate your COGS and give you a misleading, artificially low DOH.
This whole process is about turning static inventory into fluid capital.
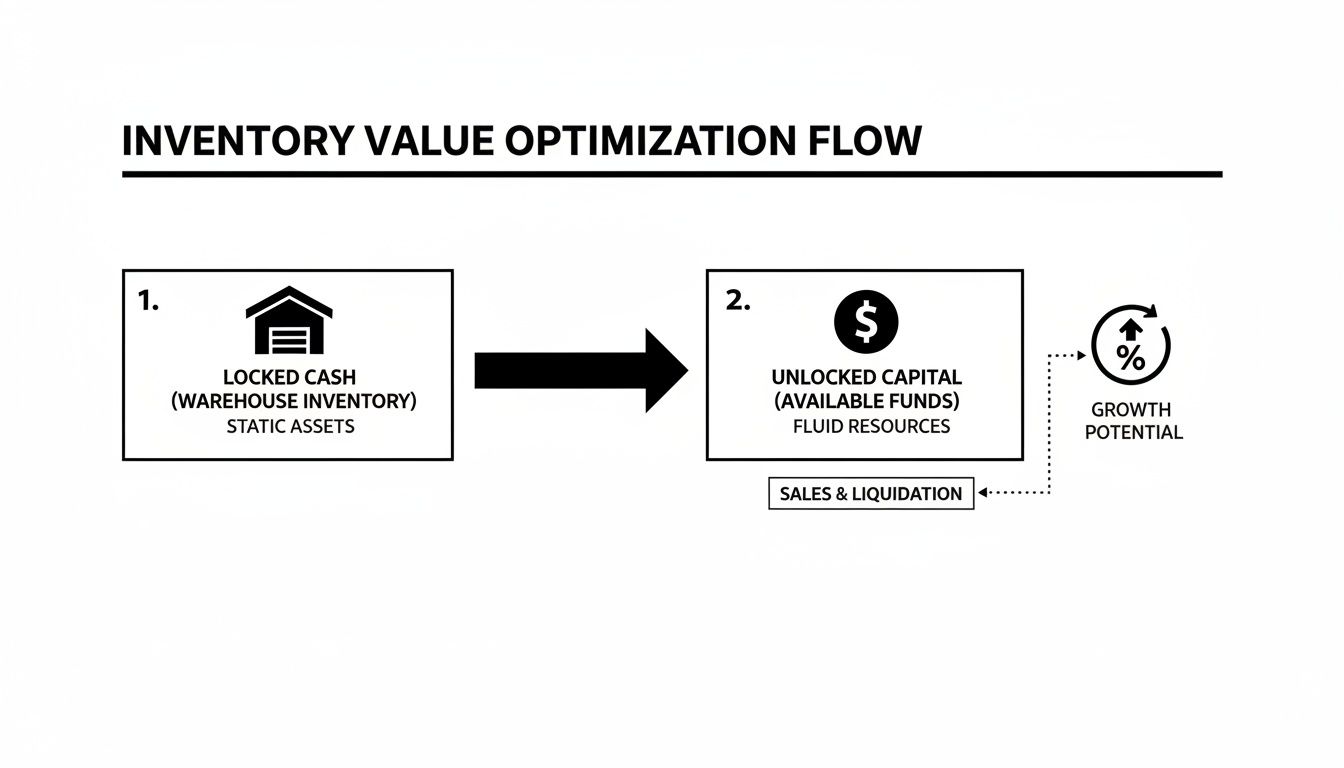
Ultimately, smart inventory management is all about speeding up that conversion so you have more cash on hand to reinvest and grow the business.
Let's walk through this with a real-world scenario. Imagine you run a multichannel brand selling premium coffee accessories and you want to calculate your DOH for the entire last year (365 days).
First, you’ll need to pull a few key numbers from your records.
The table below breaks down the calculation using our coffee brand example, showing you exactly where each number fits.
MetricDescriptionExample ValueBeginning InventoryValue of inventory on January 1st.$90,000Ending InventoryValue of inventory on December 31st.$110,000Annual COGSTotal direct cost of goods sold for the year.$800,000Number of DaysThe time period being measured.365Average Inventory(Beginning + Ending) / 2$100,000Inventory Days (DOH)(Average Inventory / COGS) x Days45.6 Days
As you can see, the final calculation ($100,000 / $800,000) x 365 gives us 45.6 Days.
This means that, on average, this business holds about 45 to 46 days' worth of inventory. This single number is a powerful starting point. Now you can use it to see if you're holding stock for too long, benchmark against competitors, or track your own efficiency improvements over time. For more on how top sellers use this metric, check out this guide on how to manage cash flow effectively.
Key Takeaway: The precision of your DOH calculation depends entirely on the quality of your data. Use clean numbers for your inventory value and a strictly defined COGS to get a result you can truly trust to make important business decisions.
While digging into the average inventory formula gives you a super precise picture of your inventory's health, it’s not the only way to get the job done. If you're a high-volume seller already dialed in on other key metrics, there’s a much faster path to your Days on Hand number.
If you already track your inventory turnover ratio, you can figure out your DOH with a much simpler formula. It’s perfect for quick health checks or weekly performance reviews when you just need an immediate feel for your operational speed.
The formula is beautifully straightforward:
Days on Hand = Number of Days in Period / Inventory Turnover Ratio
This gets you to the exact same place as the other formula, just from a different starting point. It’s perfect for the Amazon FBA seller who knows their inventory turns over 8 times a year. They can get a rapid snapshot of their situation: 365 / 8 = 45.6 days.
So, why have two formulas? Think of it like a toolbox. The average inventory method is your precision screwdriver, perfect for a deep-dive analysis. The inventory turnover method is your trusty wrench—great for quick adjustments and regular maintenance.
This shortcut is especially powerful in a few key situations:
Using your inventory turnover ratio is a solid, equally effective way to calculate Days on Hand. It gives you flexibility depending on which numbers you have right in front of you.
For instance, if an online store knows its inventory turnover ratio is 4.2 times per year, the math is simple: 365 ÷ 4.2 = about 86.9 days. This tells them they sell through their entire inventory roughly every 87 days. The real beauty here is the simplicity if you're already monitoring turnover, a metric most larger e-commerce operations watch like a hawk.
Let's say you're reviewing your Q1 performance (90 days). You know from your analytics that your inventory turnover for the quarter was 2.5.
Just plug it into the formula: 90 days / 2.5 turnover = 36 DOH.
Pro Tip: This calculation really highlights the direct link between how often you turn your stock and how long it sits on your shelves. If you want to lower your DOH, you have to find ways to increase your turnover.
Having this flexibility means you can use the right tool for the right situation. Getting comfortable with both ways of calculating inventory days on hand gives you a much richer understanding of your business's rhythm. You can also learn more about inventory turnover in our dedicated guide to see how these two critical metrics work together to help you make smarter decisions.

Figuring out your Inventory Days on Hand (DOH) is the easy part. The real magic happens when you turn that number into a story about your business—a story that tells you what’s working, what isn’t, and where you need to make some changes, fast.
A classic mistake is getting hung up on finding a universal "good" DOH number. Let me be clear: no such number exists. A healthy DOH is entirely dependent on your industry, your business model, and the lifecycle of your products.
For instance, a fast-fashion brand pushing trendy apparel might aim for a razor-thin DOH of 30-40 days to avoid getting burned by last season’s styles. On the flip side, a DTC furniture company dealing with long manufacturing lead times could be perfectly healthy with a DOH of 120 days or more. It's all relative.
The first step to really understanding your DOH is to give it some context. This means looking at your number from a few different angles to see the full picture.
Start by seeing how you stack up against industry averages. General retail often sees DOH figures somewhere between 70 and 100 days, but this varies wildly. A quick search for benchmarks in your specific niche—like consumer electronics or beauty products—will give you a much more relevant comparison.
But honestly, the most crucial benchmark is always your own historical performance. How does this month's DOH compare to last quarter? Or this time last year? This is where you stop looking at a static number and start analyzing trends.
Your DOH shouldn’t be a one-and-done calculation. Tracking it consistently is how you spot opportunities and risks before they snowball into massive problems. Just plot your DOH on a simple chart month-over-month or quarter-over-quarter and watch the patterns emerge.
What you're really looking for are significant shifts:
The goal isn't just to hammer your DOH down to zero. It's about stabilizing it at the sweet spot for your business. A consistent DOH often points to a healthy, predictable business rhythm.
Beyond DOH, if you want a more complete view of your financial efficiency, you should also look at metrics like the Cash Conversion Cycle. This gives you a broader perspective on how quickly your inventory investment turns back into cash in your bank account.
A single, company-wide DOH is a great starting point, but it can easily hide major problems brewing at the product level. Your overall DOH might look healthy at 60 days, but that average could be masking a disaster.
Think about this scenario:
In this case, your "healthy" average DOH of 60 is dangerously misleading. It fails to flag that you're missing sales on Product A while bleeding money on Product B. This is precisely why the most successful sellers quickly graduate to calculating DOH on a per-SKU or per-category basis.
By interpreting your DOH in the context of your industry, your own history, and your individual products, you transform it from a simple accounting metric into a powerful strategic tool. It tells you where to invest, what to cut, and how to fine-tune your operations for maximum profit.

The most successful ecommerce operators I know don't stop at a single, company-wide Days on Hand (DOH) number. While it's a decent health check, it's far too broad to give you the kind of actionable intel needed to really move the needle on your cash flow. To find where the real money is made—or lost—you have to dig deeper.
This is where a granular DOH analysis becomes your secret weapon. By breaking down your inventory into smaller, more focused segments, you start to see the hidden opportunities and risks that a blended average completely masks. Honestly, this is the level of detail that separates the good operators from the elite sellers.
First things first: you have to stop looking at your inventory as one giant pile of cash. Instead, start calculating DOH on a per-SKU or per-category basis. This simple shift in perspective will instantly shine a spotlight on your product portfolio's rock stars and its dead weight.
You’ll immediately spot your fast-moving heroes—the products with a low DOH that are essentially printing money for you. Even more critically, this process exposes the slow-moving "cash vampires" that are quietly draining your resources. These are the SKUs with a dangerously high DOH, tying up capital that should be funding your winners or new product development.
A healthy overall DOH of 50 days can easily hide a top-selling product line with a DOH of 20 and a failed product with a DOH of 250. Without a granular view, you're flying blind, likely understocked on your bestsellers and overstocked on your losers.
Let’s say you sell kitchen gadgets and your overall DOH is a respectable 65 days. A quick SKU-level analysis could reveal something like this:
This kind of insight is pure gold. It gives you a clear, data-backed roadmap for what to do next. You can confidently invest more in the coffee grinders while building a liquidation plan—like a bundle promotion or a flash sale—to turn those citrus juicers back into cash.
Beyond just what you're selling, you need to analyze where you're selling it. For any multichannel brand, segmenting your DOH by sales channel is non-negotiable. A product's sales velocity can be wildly different from one platform to another.
Your Amazon FBA inventory might be humming along with a super-efficient 30-day DOH, thanks to Prime shipping and high-traffic listings. Meanwhile, the exact same product on your direct-to-consumer Shopify store could be lagging with a 90-day DOH due to lower organic traffic.
Knowing this unlocks incredibly precise, profit-driven decisions:
Calculating inventory days on hand at this granular level is how you shift from simply managing your business to actively steering it. You get to make surgical adjustments to purchasing, marketing, and logistics based on hard data, ensuring every dollar tied up in inventory is working as hard as it possibly can.
Alright, you've calculated your Inventory Days on Hand (DOH). That's the diagnostic. Now it's time for the cure.
Bringing that number down is all about making smarter, faster decisions to turn your products back into cash. This isn't about reckless cost-cutting; it's about building a more agile and responsive operation. The real goal is to unfreeze the capital tied up on your warehouse shelves so you can plow it back into marketing, new product development, or other high-growth areas.
Let's walk through some proven, actionable strategies that top ecommerce operators use to keep their DOH lean and their cash flow healthy.
Guesswork is the absolute enemy of efficient inventory management. If you want to lower your DOH from the very start, you have to move beyond just looking at last year's sales. A more predictive forecasting model is a game-changer because it helps you buy the right amount of stock in the first place, preventing the overbuys that inflate your DOH.
Start by layering a few key data points:
When you combine these insights, you stop being reactive with your purchase orders and start being proactive. That's fundamental to controlling inventory levels before they even hit your warehouse.
A classic mistake is placing a huge reorder based on a single "good month" of sales. Always look at a trailing average of at least three to six months to get a more reliable picture of true demand. This smooths out any unusual spikes or dips.
Your suppliers are your partners in this, not your adversaries. How you manage those relationships directly impacts how much stock you need to keep on hand. Shorter lead times, for example, mean you can hold less safety stock—a direct reduction to your DOH.
It's time to open a conversation with your key suppliers. Ask about:
Remember, these negotiations are a two-way street. Offering your suppliers better payment terms or more predictable ordering schedules can give you the leverage you need to get more favorable terms for your business. To really stay on top of this, many sellers lean on the best inventory management software to automate and track these critical details.
Every single ecommerce business ends up with some slow-moving inventory. It's inevitable. The key is to spot it early and act decisively before its DOH skyrockets and it becomes a major drain on your cash. The goal is liquidation, but you need to do it without trashing your brand's value or cannibalizing sales of your full-price items.
Consider these tactics for turning those "cash vampires" back into cash:
Don't forget that the holding cost of that dead stock is constantly chipping away at your profits. You can learn more about how these hidden expenses add up in our detailed guide on understanding inventory carrying costs. Sometimes, taking a small loss to liquidate an item is far more profitable than letting it sit on the shelf for another six months.
At Million Dollar Sellers, we see top 7-, 8-, and 9-figure founders share these exact strategies in our private community. If you're ready to scale your business with insights from the best in the industry, see if you qualify to join us. Learn more at https://milliondollarsellers.com.
Join the Ecom Entrepreneur Community for Vetted 7-9 Figure Ecommerce Founders
Learn MoreYou may also like:
Learn more about our special events!
Check Events.svg)
.svg)
.svg)

.svg)