Chilat Doina
October 26, 2026
Most advice about why ecommerce businesses fail starts with traffic, conversion rates, or advertising. Those can matter, but they're weak signals on their own. A store can attract orders and report rising revenue while losing money on every sale, waiting too long for payouts, or buying customers who never come back.
The more useful diagnosis starts with cash timing, contribution margin after returns, and payback by customer cohort. Revenue tells you what sold. It doesn't tell you whether the sale paid for its costs, whether the cash is available to fund the next order, or whether the customer is likely to buy again.
Most ecommerce stores fail from running out of cash or margin, not from a shortage of orders. The causes below are different routes to that outcome. Match the symptoms to your own contribution profit, first-order cohorts, inventory, and cash on hand, then investigate the two or three that fit best.
| Cause | How It Shows Up | What Founders Usually Miss |
|---|---|---|
| Product-market fit | First-order cohorts never reorder and sales depend on discounts | Treating category growth as proof of demand |
| Unit economics | Revenue rises while contribution profit stays flat or negative | Judging health by blended ROAS instead of first-order margin |
| Cash flow | Strong sales but no money to reorder best sellers | Ignoring payout delays, reserves, and refund holdbacks |
| Supply chain | Stockouts on winning SKUs and dead stock on slow ones | Relying on one supplier without a safety-stock model |
| Customer acquisition | ROAS holds while payback lengthens each quarter | Averaging lifetime value across all cohorts |
| Operations | Late parcels, rising support tickets, and refund spikes | Treating support volume as a cost instead of a system signal |
| Team | Every decision waits on the founder and payroll outruns revenue | Hiring for the stage they hoped to reach |
| Compliance | Marketplace suspensions, tax notices, and recall requests | Assuming the platform handles tax and product documentation |
A red symptom rarely travels alone. A weak product-market fit can make paid acquisition look worse; a return problem can flatten contribution margin; and a margin problem can become a cash crisis when stock needs reordering. Check the neighbouring causes before choosing a fix.
Use the table to decide where to look, not as a checklist to complete. The sections below show how to test the underlying problem and what to change before you commit more money.
Revenue can hide weak product-market fit when every new sale comes from a discount or a fresh advertising push. Test whether customers want the product enough to return, recommend it, or buy it without a constant incentive.
Start with repeat purchasing. Group customers acquired in each of the last few months by acquisition source, then check which cohorts bought again within the same follow-up window. A cohort that never reorders may still be valuable for a one-time product, but don't treat it as a recurring customer base unless the economics support that assumption.
Next, check discount dependence. Compare the share of orders placed with a discount against conversion when the offer is removed for a short, controlled period. If sales collapse, the offer may be buying demand rather than revealing strong product pull. Don't confuse a promotion that clears old inventory with evidence that your regular price works.
Practical rule: If repeat purchasing weakens across cohorts while discounts carry sales, fix the product, offer, or positioning before you raise ad spend.
Compare your growth with the category's direction, but don't let category growth stand in for customer evidence. During the pandemic, for example, U.S. ecommerce sales rose sharply, but that surge didn't guarantee that an individual store had durable demand. Read customer reviews and support tickets for the problem buyers say the product solves. If their language differs from your ads, the positioning may be wrong before the price is.
For a low-cost way to test interest in an idea before committing to a full build, use a checklist for testing demand before building. It helps you check whether prospective buyers take a meaningful action, rather than relying on positive feedback alone. For a broader framework to validate the product and the audience together, use this product-market fit validation guide.
Before adding budget, make the decision explicit: are repeat orders improving, do buyers understand the product's value, and can it sell without a permanent discount? If not, improve the offer or product first. More traffic into a weak fit usually accelerates cash burn.
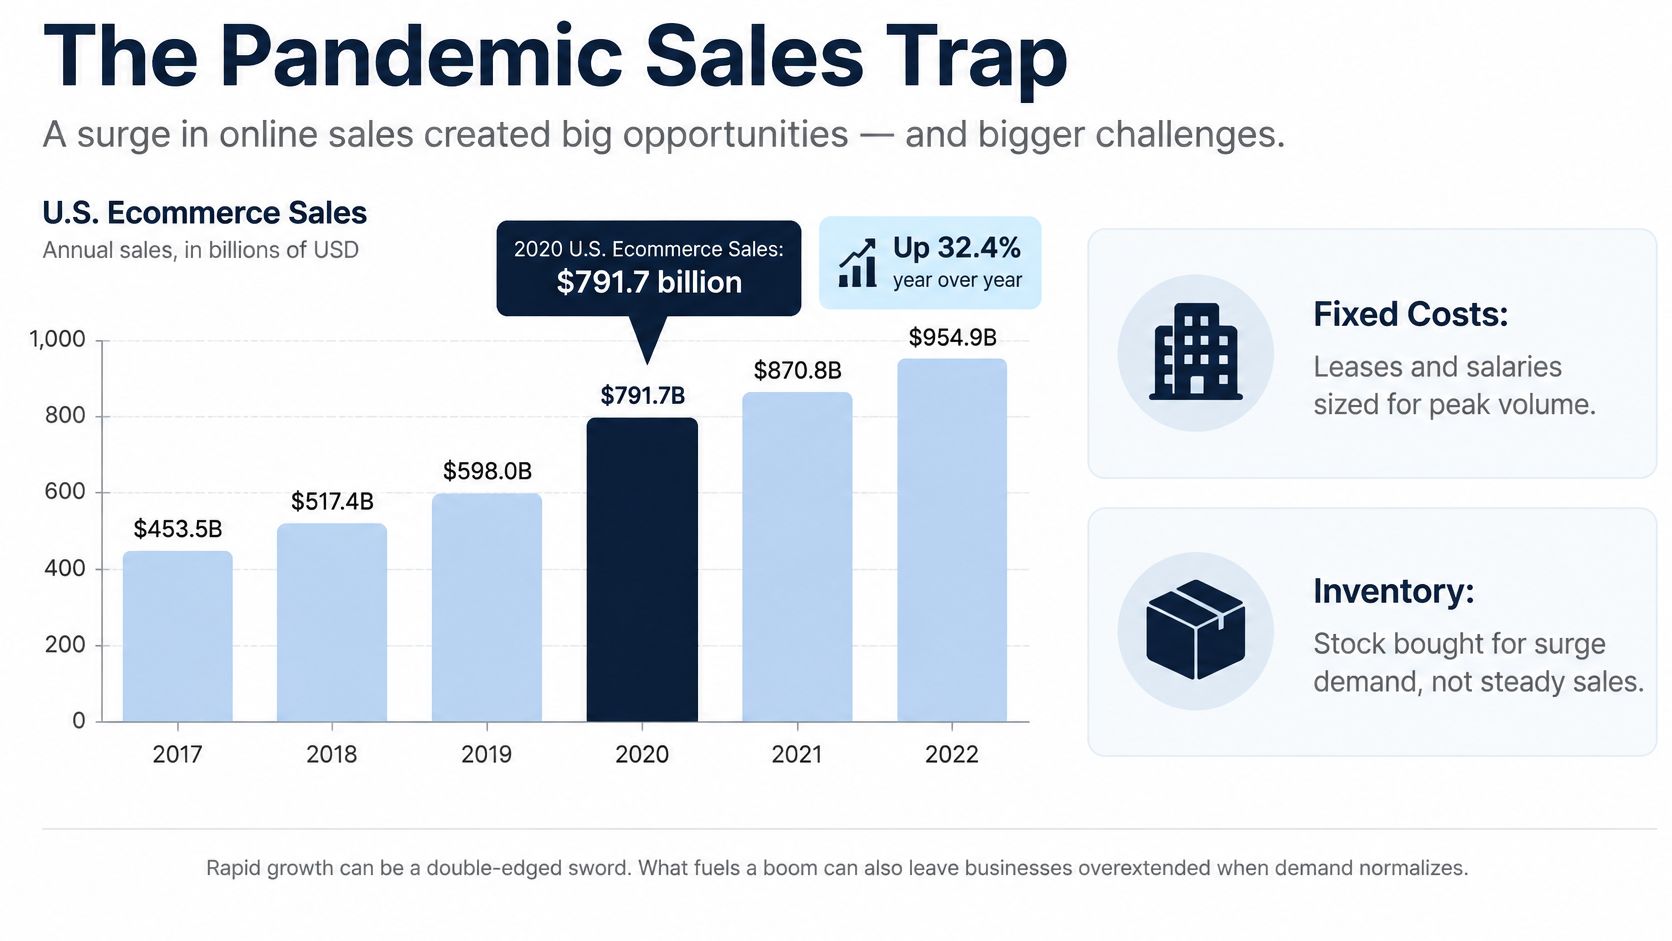
The pandemic sales surge made it easy to mistake exceptional demand for a durable baseline. U.S. ecommerce sales reached $791.7 billion in 2020, up 32.4% from 2019, according to the U.S. Census Bureau's ecommerce report. Many businesses built inventory commitments, fulfillment capacity, staffing, and advertising budgets around growth that wasn't guaranteed to continue.
Revenue is the speedometer; contribution margin is the fuel gauge. A car can move quickly while running out of fuel, and a store can grow sales while each order contributes too little to cover fixed costs. Growth in total dollars doesn't automatically mean the business has better economics.
Consider an illustrative store with $200,000 in monthly sales and a 6% contribution margin. That produces $12,000 to cover $10,000 in fixed costs, leaving $2,000. If sales fall by a quarter to $150,000, contribution falls to $9,000. With fixed costs unchanged, the store loses $1,000 that month, even if its prices and advertising haven't changed.
Three checks help expose this risk:
The Census Bureau's figures also show why total ecommerce growth isn't enough to prove a particular product has durable demand. A growing category can lift a store temporarily while discounting, excess inventory, rising fulfillment costs, or weak repeat purchasing erode its economics.
Answer this before placing the next large purchase order: if orders fell by a quarter next month, which costs would still be locked in?
A sale is not usable cash at checkout. The store may have paid for inventory, freight, storage, and advertising before the order arrived, then wait for a processor or marketplace payout. Revenue can look healthy while cash needed for the next supplier payment remains tied up elsewhere.
| Stage | When Cash Moves | Typical Timing | Failure If Unplanned |
|---|---|---|---|
| Inventory purchase | Before the sale | Often 60–90 days ahead for overseas sourcing | Stockouts or rushed reorders at higher cost |
| Freight and storage | Before the sale | 2–6 weeks before stock is sellable | Storage fees and aged stock |
| Advertising | Day of the click | Immediate | Spend lost on traffic that never converts |
| Marketplace or processor payout | After the sale | Often 7–14 days, longer when reserves apply | Cash gap that blocks the next reorder |
| Refunds and chargebacks | After the sale | Can arrive up to 120 days later | Revenue clawed back after it was spent |
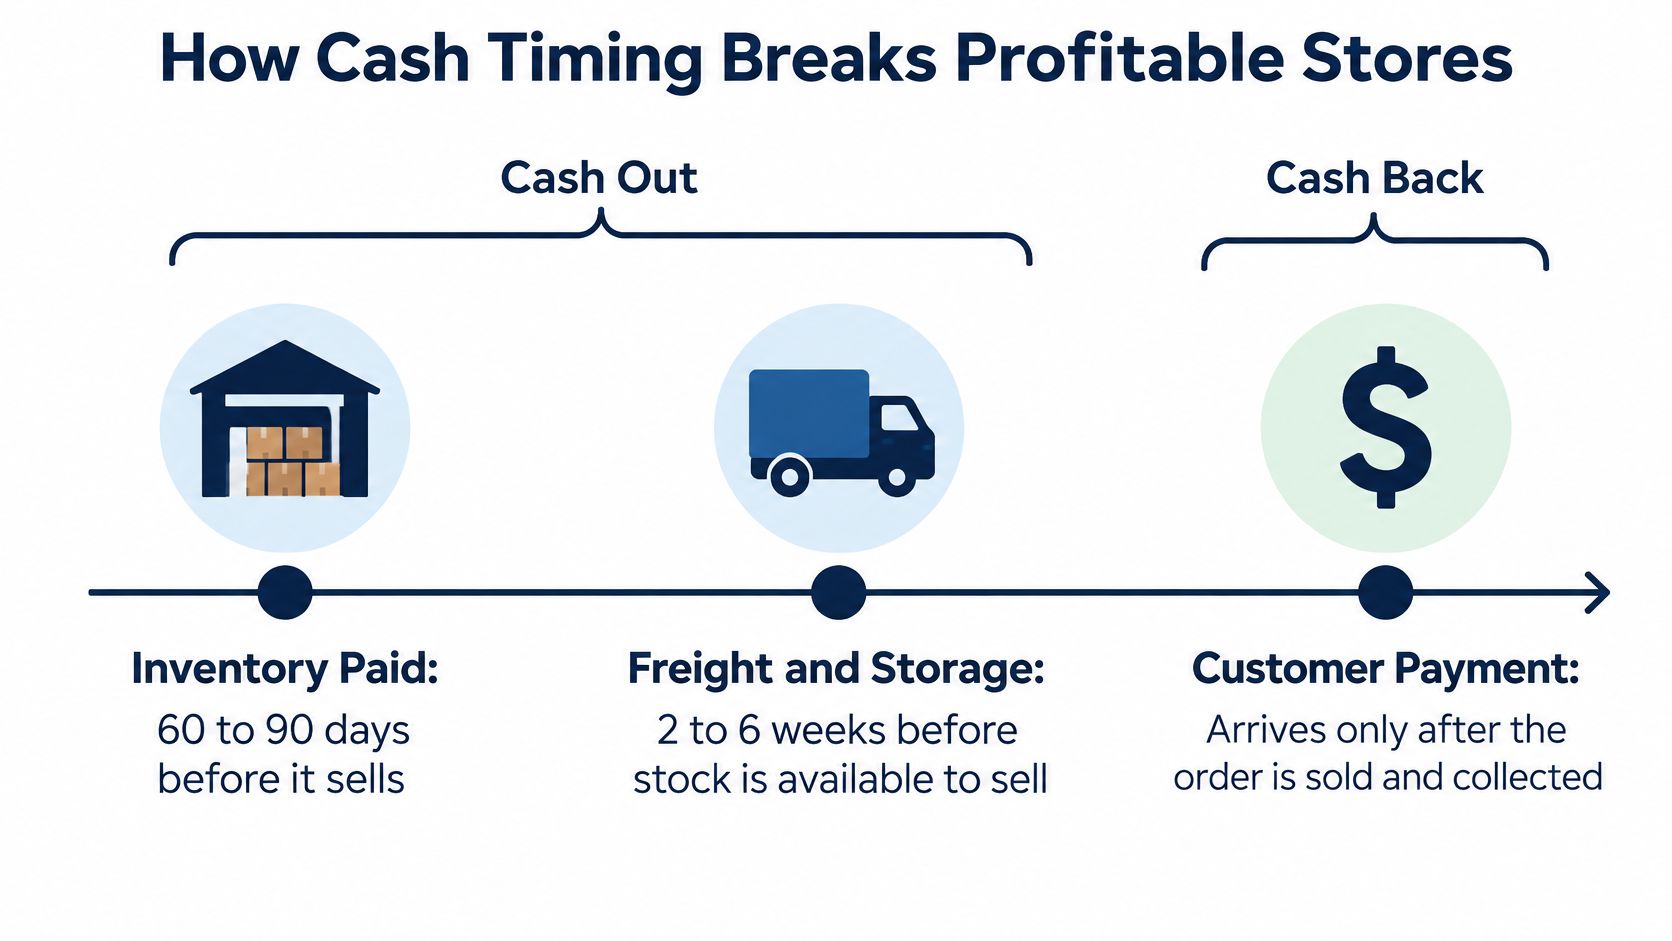
Consider a store that orders stock well ahead of its selling season, pays freight before products are available, and starts buying ads as soon as inventory goes live. Orders arrive, but the payout lands after the next supplier deposit is due. Reorder late, and the best seller may go out of stock. Expedited freight can then erase much of the margin on units that arrive in time.
The cash conversion cycle measures the time between paying suppliers and collecting customer payments. Accounting profit cannot cover a deposit while cash is tied up in stock or held by a payment provider. A store can show a profit on paper and still lack the liquidity to fund its next purchase order.
Track days of cash on hand alongside days of inventory on hand. If stock will take longer to sell than available cash can support, a profitable forecast may still conceal an immediate funding gap. Map expected payouts against supplier due dates, payroll, and planned reorders in a rolling 13-week cash forecast. Check the dates before committing to another order.
Use this guide to manage ecommerce cash flow and map incoming payments against outgoing commitments. The practical goal is to spot the gap before the supplier invoice is due, while there is still time to adjust a reorder rather than pay for an expensive rush response.
An average checkout on major U.S. and European ecommerce sites displays 23.48 form elements by default, while an effective flow can be reduced to roughly 12–14, according to Baymard's checkout usability benchmark. Nearly one in five U.S. shoppers reported abandoning an order because checkout was too long or complicated. Baymard estimates that improving checkout design can produce an average conversion-rate increase of 35%, though any individual store's result will depend on its own traffic and problems.

Remove fields you don't need to ship and service the order. Offer guest checkout, use address autocomplete, and preserve entered information when a validation error occurs. Then measure the funnel from cart to shipping, payment, review, and confirmation, split by device, browser, destination, and payment method. A single blended conversion rate can hide a broken mobile payment step or a regional shipping problem.
Checkout friction is only one leak. Landed cost includes what the customer pays to receive the order, including shipping, taxes, and fees. Among shoppers who abandoned carts for reasons other than browsing, Baymard reported that 40% cited extra costs, 20% cited slow delivery, and 12% couldn't calculate the total order cost upfront (Baymard's cart-abandonment findings).
If an ad campaign looks efficient based on gross conversion, but delivery surcharges appear late, the campaign may be buying abandoned carts rather than profitable orders. The same mismatch can increase support contacts and refunds when delivery promises aren't met.
Make the cost and service promise visible before payment:
Treat checkout as an operating funnel. If completion drops at one stage or on one device, fix that point before increasing acquisition spend.
A return isn't just a refund. It can leave the business paying for outbound shipping, payment processing, return transport, inspection, restocking, customer support, and markdowns. The National Retail Federation's 2025 projection estimates that 19.3% of online sales will be returned, and that 9% of returns are estimated to be fraudulent.
Start with a simple model for every $100 of gross sales. At that projected return rate, refunds account for $19.30 before you've calculated what it costs to receive, inspect, and process the returned goods. Subtract reverse-shipping and inspection costs on returned parcels. Then account for goods that can't be resold at full price, and credit only the recovery value you can reasonably expect from restocking or other channels. Track suspected fraud separately rather than burying it in a blended return cost.
The question isn't whether a return policy increases conversion. It's whether the extra orders remain profitable after expected returns and recovery value. A free-return offer may help close some purchases, but it can weaken the business if the added orders have thin margins or high abuse. Tightening the policy has its own cost: 71% of consumers say a poor return experience makes them less likely to shop again, according to the same NRF release.
A return policy is a margin decision and a retention decision. Measure both before changing it.
Run the calculation by SKU, channel, and customer cohort. A blended return rate can hide a profitable product with a costly sizing issue, or a strong acquisition source whose buyers return more often than other customers. Improve product descriptions, sizing guidance, packaging, and return routing where those changes reduce avoidable costs without making the buying experience needlessly difficult.
Acquisition needs the same cohort-level discipline. A 2025 estimate places global ecommerce customer acquisition cost at $47, up 12% from $42 in 2024, with substantial variation by channel and category (Blippr's ecommerce statistics). The useful question isn't whether CAC is high in isolation. It's whether the customers acquired can repay that cost and help finance inventory before cash runs short.
Separate blended ROAS from first-order contribution margin, payback period, and repeat purchasing by source. An average lifetime-value-to-CAC ratio can make weak cohorts disappear inside stronger ones. For a practical view of how repeat behaviour affects longer-term value, see these retention insights from Class A Media. Use a clear rule: scale a channel only when first-order margin plus reliable repeat purchasing can cover acquisition cost within the cash runway. For the underlying margin framework, use this guide to ecommerce unit economics.
A store can have a sound product and still lose money because the operating system can't deliver it reliably. The following composite scenarios are common failure patterns, not accounts of named businesses.
A brand relies on one overseas supplier and holds no planned safety stock. A delay leaves its top SKU unavailable while ads continue sending shoppers to an out-of-stock page. The early warning is concentrated sourcing paired with sales forecasts that assume every delivery arrives on time. Qualify a backup supplier where possible, and set safety stock in days of cover based on lead time and demand variability.
A store opens a second warehouse before order volume justifies the added complexity. Cost per parcel rises, delivery promises slip, and customers contact support for updates or refunds. Rising tickets are a system signal, not merely a staffing problem. Track late deliveries and refund reasons by warehouse and carrier, then fix the operating cause before expanding the network.

The founder approves every price, supplier, and advertising change. Decisions stall whenever they're unavailable, while new hires add payroll before the business can reliably carry it. Define decision rights: specify who can change prices, approve spend, and contact suppliers, with escalation rules for decisions that exceed an agreed limit. Hire for the work the business needs now, not the team chart it hopes to support later.
A marketplace suspends a listing while the business searches for missing product documents. A new region brings tax obligations the team hasn't tracked, or a retailer asks for safety documentation that isn't ready. Assign one person to maintain a compliance calendar, monitor registration thresholds in the regions where you sell, and keep product documents current. Don't assume the sales platform takes responsibility for your tax position or product records.
These failures share a practical lesson: assign an owner before a problem becomes urgent. Supplier backups, delivery monitoring, written decision rights, and a compliance calendar are operating controls, not paperwork for later.
Use this as a weekly survival dashboard, not a list of targets to chase in isolation. Thresholds are starting points, so adjust them for your category, price point, return behaviour, and supplier lead times.
| KPI | Healthy Signal | Warning Threshold |
|---|---|---|
| Contribution margin after ads and fulfillment | Positive on first-order and blended basis | Negative on first-order basis for two consecutive months |
| First-order payback period | Inside 60 days | Beyond 120 days or lengthening each quarter |
| 90-day repeat rate by acquisition source | Stable or rising across cohorts | Falling across two consecutive cohorts |
| Inventory days of cover by SKU | Matched to reorder lead time plus safety stock | Below lead time, or above 120 days on slow SKUs |
| Return rate by SKU | At or below category average | Above the 19.3% NRF 2025 average |
| Checkout completion by device | Mobile within 10% of desktop | Gap widening week over week |
| Cash runway | Above 13 weeks of fixed costs plus next reorder | Under 6 weeks |
| Blended CAC trend | Rising slower than average order value | Rising faster than average order value for a full quarter |
One red reading may be noise. Two red readings in consecutive weeks, or a decline across several acquisition cohorts, deserves investigation. Don't use the table to excuse a bad result because another metric looks healthy; check whether the same customers, orders, and inventory are represented in both measurements.
For example, contribution margin can fall while blended ROAS stays steady. If cash runway is shrinking at the same time, the combination says more than any metric alone: advertising may still produce attributed revenue, but that revenue isn't providing enough cash to support operations. Stop scaling spend while you identify whether the cause is returns, discounting, fulfillment cost, or lower-quality cohorts.
The CAC comparison in the table is a directional prompt, not a universal ceiling. The global estimate from Blippr's ecommerce statistics includes different categories and acquisition channels, so compare your store with its own trend and payback economics. For marketplace operators, a focused Amazon KPI guide from Headline Marketing Agency can help structure channel-level monitoring.
Keep revenue, sessions, and keyword rankings on a second screen. They help confirm demand and visibility, but they don't prove that orders are profitable or that cash will be available for the next purchase order.
When cash is tight, don't start by adding products, channels, or another agency. First work out which commitments have to be funded, which orders contribute after returns, and which spending can stop without harming the store's core.
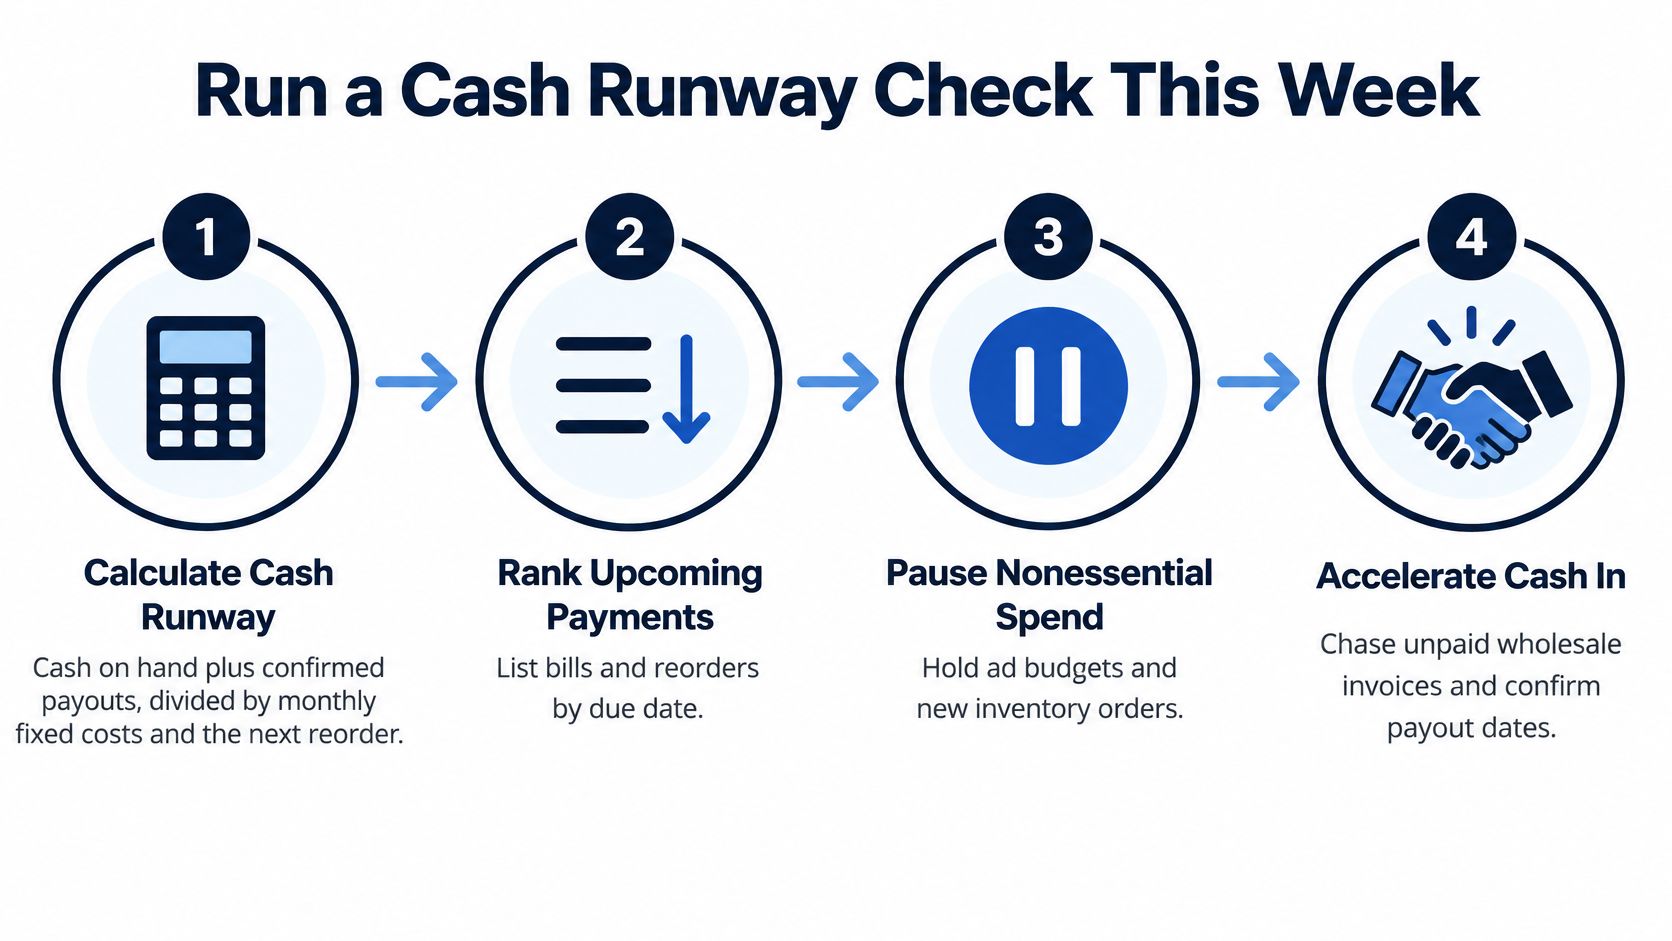
Calculate cash runway. Add cash on hand to confirmed payouts, then compare the total with monthly fixed costs and the next required reorder. Use actual payout dates, not expected sales, to estimate what you can fund.
Rank SKUs by contribution. Calculate first-order contribution after expected returns, then stop sending ad spend to products at the bottom of the ranking. This protects cash from products that look popular but don't pay their way.
Pause campaigns with poor payback. Hold channels whose first-order payback exceeds your warning threshold or keeps lengthening. Don't preserve a campaign simply because its blended ROAS looks acceptable if the acquired cohort doesn't repay within the cash runway.
Freeze excess purchase orders. Stop new orders beyond near-term demand and reprice slow inventory where the discount can release more cash than holding it. Protect proven sellers, but don't keep buying into a forecast the cash position can't support.
Renegotiate supplier terms. Ask suppliers whether deposits, balances, or reorder dates can align more closely with payout timing. A revised payment schedule can reduce the funding gap without forcing a rushed shipment.
Fix preventable checkout loss. Remove unnecessary fields and show landed cost and delivery dates before payment. The aim is to complete more profitable orders, not to increase checkout volume while hiding costs that later trigger abandonment or refunds.
Set decision rights and review the dashboard. Name who can approve pricing changes, supplier commitments, and advertising spend. Review the same survival KPIs every week so the team acts on deteriorating margin or runway before it becomes an emergency.
Get an experienced outside view. Ask operators who've handled a similar cash squeeze to pressure-test the assumptions behind your reorder, channel, and inventory decisions. Invite-only peer groups such as Million Dollar Sellers offer forums and calls where ecommerce operators can compare operating problems and practical responses.
Use the sequence to decide whether there's a recoverable business underneath the cash pressure. If runway remains under six weeks after the first five steps and no SKU is contribution-positive, stop treating the problem as a temporary marketing dip. Decide whether to restructure the range around viable products or wind the business down before new obligations deepen the loss.
Million Dollar Sellers gives ecommerce founders an invite-only peer network, private forums, and mastermind calls to discuss operating challenges with experienced sellers. If you're weighing a cash recovery plan, a product-range reset, or a decision to stop, bring your numbers and compare options with operators through Million Dollar Sellers.
Join the Ecom Entrepreneur Community for Vetted 7-9 Figure Ecommerce Founders
Learn MoreYou may also like:
Learn more about our special events!
Check Events


