


Stay Updated with Everything about MDS
Thank you! Your submission has been received!
Oops! Something went wrong while submitting the form.

Chilat Doina
June 30, 2026
Your dashboard says the brand is growing. Shopify looks healthy. Amazon sessions are up. Revenue keeps moving.
Then you open the bank account and the result feels wrong.
That gap usually comes from one mistake. Founders track sales, gross margin, and blended ROAS, but they don't run a disciplined contribution margin calculation at the product and customer level. In e-commerce, that's where the truth sits. It tells you what each sale leaves behind after the costs that move with that sale are paid.
A lot of brands don't have a revenue problem. They have a variable cost visibility problem.
A seven-figure store can still be operating with weak economics. That happens when top-line growth hides the costs attached to every order. Amazon fees, fulfillment, shipping, payment processing, returns, commissions, and direct acquisition spend all eat into the sale long before fixed overhead enters the picture.
This is why a P&L often feels too slow for day-to-day decision-making. It's useful for reporting. It's not enough for deciding whether to push a SKU, raise a price, keep running paid traffic, or launch a bundle next month.
I've seen founders celebrate a strong sales week while losing control of per-order profitability. The pattern is common. A product has decent gross profit, but once you layer in fulfillment friction and customer acquisition, the sale stops doing much useful work.
That's why contribution margin matters more than vanity growth metrics. It answers a sharper question: after the variable costs of making and delivering the sale, what is left to cover overhead and create profit?
A busy store isn't always a healthy store. A profitable store knows exactly what each order contributes.
Paid traffic is usually where this gets exposed first. Brands push harder on Meta or Amazon Ads, revenue rises, and the team assumes momentum means efficiency. In reality, more ad spend can amplify weak unit economics if your pricing floor and allowable acquisition cost aren't anchored in real numbers. If you need a clearer lens on channel economics, these effective digital advertising insights are useful for thinking through where paid spend helps and where it masks margin leakage.
Contribution margin isn't an accounting exercise. It's an operating metric.
Use it to answer questions like these:
Founders who know these numbers make cleaner decisions. Founders who don't usually rely on intuition, dashboard snapshots, and delayed reporting. That works for a while. Then cash gets tight.
The textbook formula is simple. Contribution Margin = Total Revenue – Total Variable Costs. The problem isn't the formula. The problem is that most sellers leave out variable costs that matter in Amazon and DTC.
The method that works is operational, not theoretical. According to Macabacus on contribution margin analysis, the process requires six stages: determine net sales, identify all variable costs, subtract costs from sales, calculate per-unit margin, compute the break-even point, and use the contribution margin ratio to assess profitability.
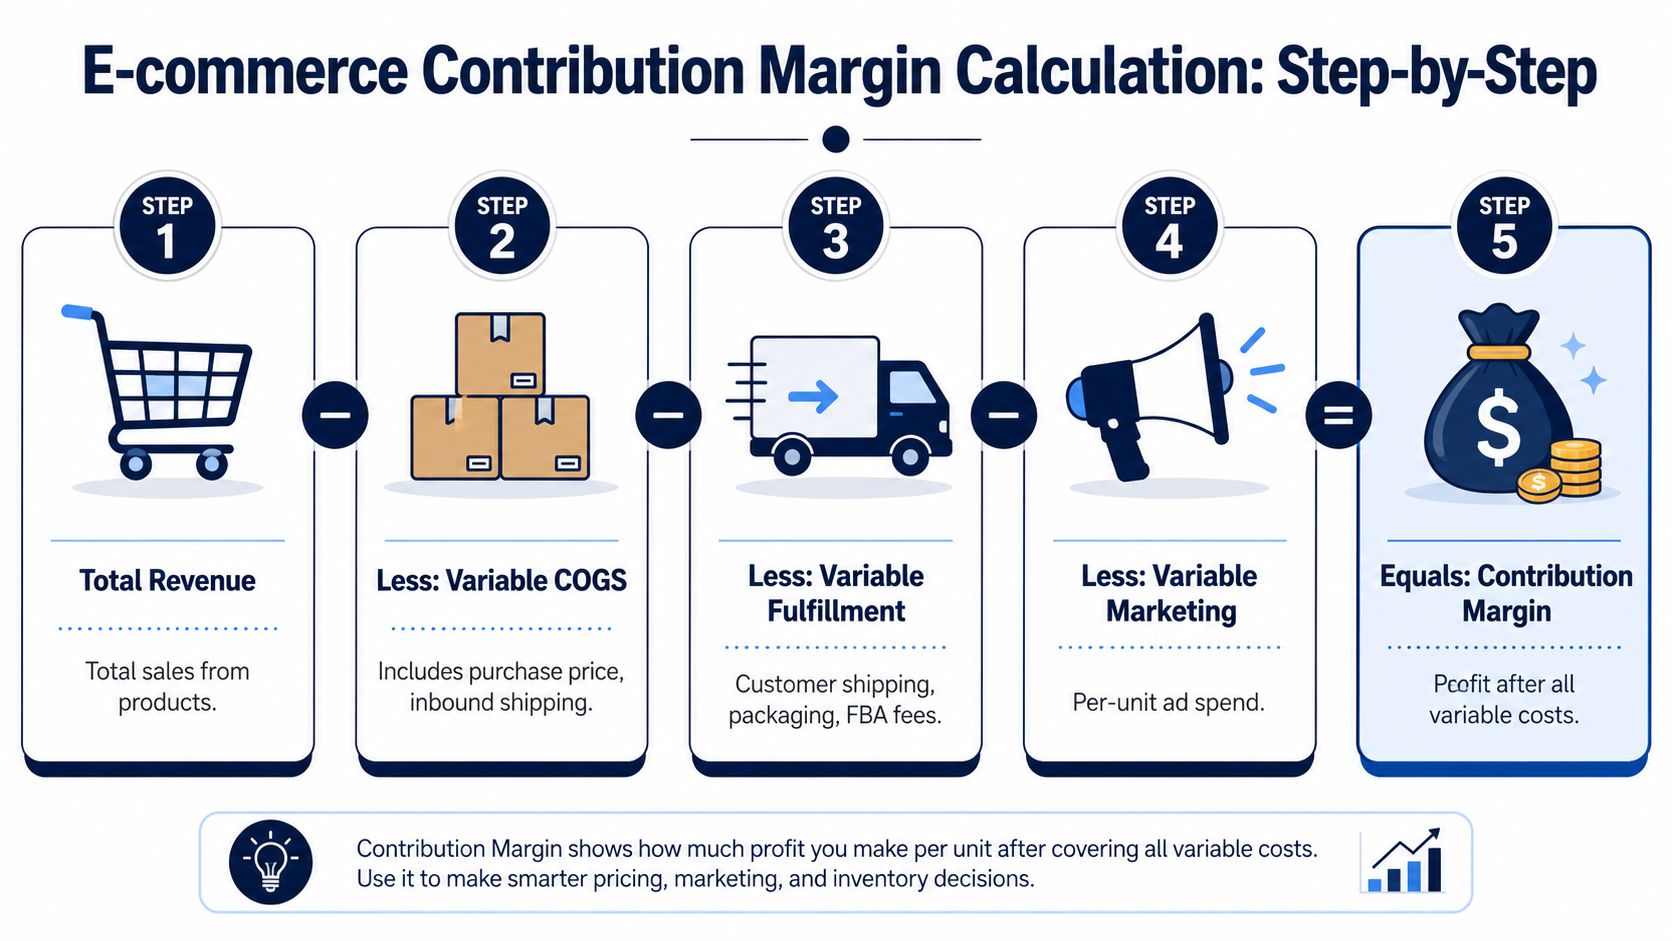
If you start from gross sales, your math is already off. For a clean contribution margin calculation, strip out taxes, returns, and customer-paid shipping from total revenue before doing anything else.
That matters because founders often model from the most visible number in Shopify or Seller Central. That number is useful for tracking demand, but it's not the right starting point for profitability.
For Amazon and DTC brands, variable costs usually include more than product cost. You need the landed and delivered cost of the order.
Use a cost stack like this:
A lot of brands also underestimate packaging because they treat it like a branding line item instead of a unit economics line item. If you're shipping specialty products or giftable items, structural packaging can materially change contribution. For founders reviewing packaging trade-offs, Packaging Panda bulk hat boxes are a useful example of how packaging choices can influence both presentation and per-unit cost.
Practical rule: If the cost rises when you sell one more unit, treat it as variable until proven otherwise.
Once net sales and variable costs are clean, subtract total variable costs from net sales to get total contribution margin. Then calculate contribution margin per unit by subtracting variable cost per unit from selling price per unit.
That second number matters more in day-to-day decisions. It helps you judge discounting, traffic acquisition, bundles, and new offers without waiting for a monthly close. If your team is still cleaning up SKU cost visibility, this guide on how to calculate product costs is worth using alongside your margin model.
A lot of founders stop at margin dollars. That's not enough. Once you know contribution margin per unit, you can calculate break-even by dividing total fixed costs by contribution margin per unit.
That gives you the sales volume required to cover overhead. It turns margin from an abstract KPI into a planning tool you can use for launches, pricing changes, and spend decisions.
A lot of brands look healthy in the top line and still feel cash pressure every month. The ratio usually explains why.
Contribution margin ratio shows how much revenue you keep after the variable cost stack is paid. For Amazon and DTC operators, that matters more than the raw dollar figure because revenue alone hides too much. A SKU can produce solid contribution dollars in aggregate and still be a weak use of ad spend, warehouse space, and working capital if too much of each sales dollar gets consumed by fees, fulfillment, discounts, and channel-specific costs.
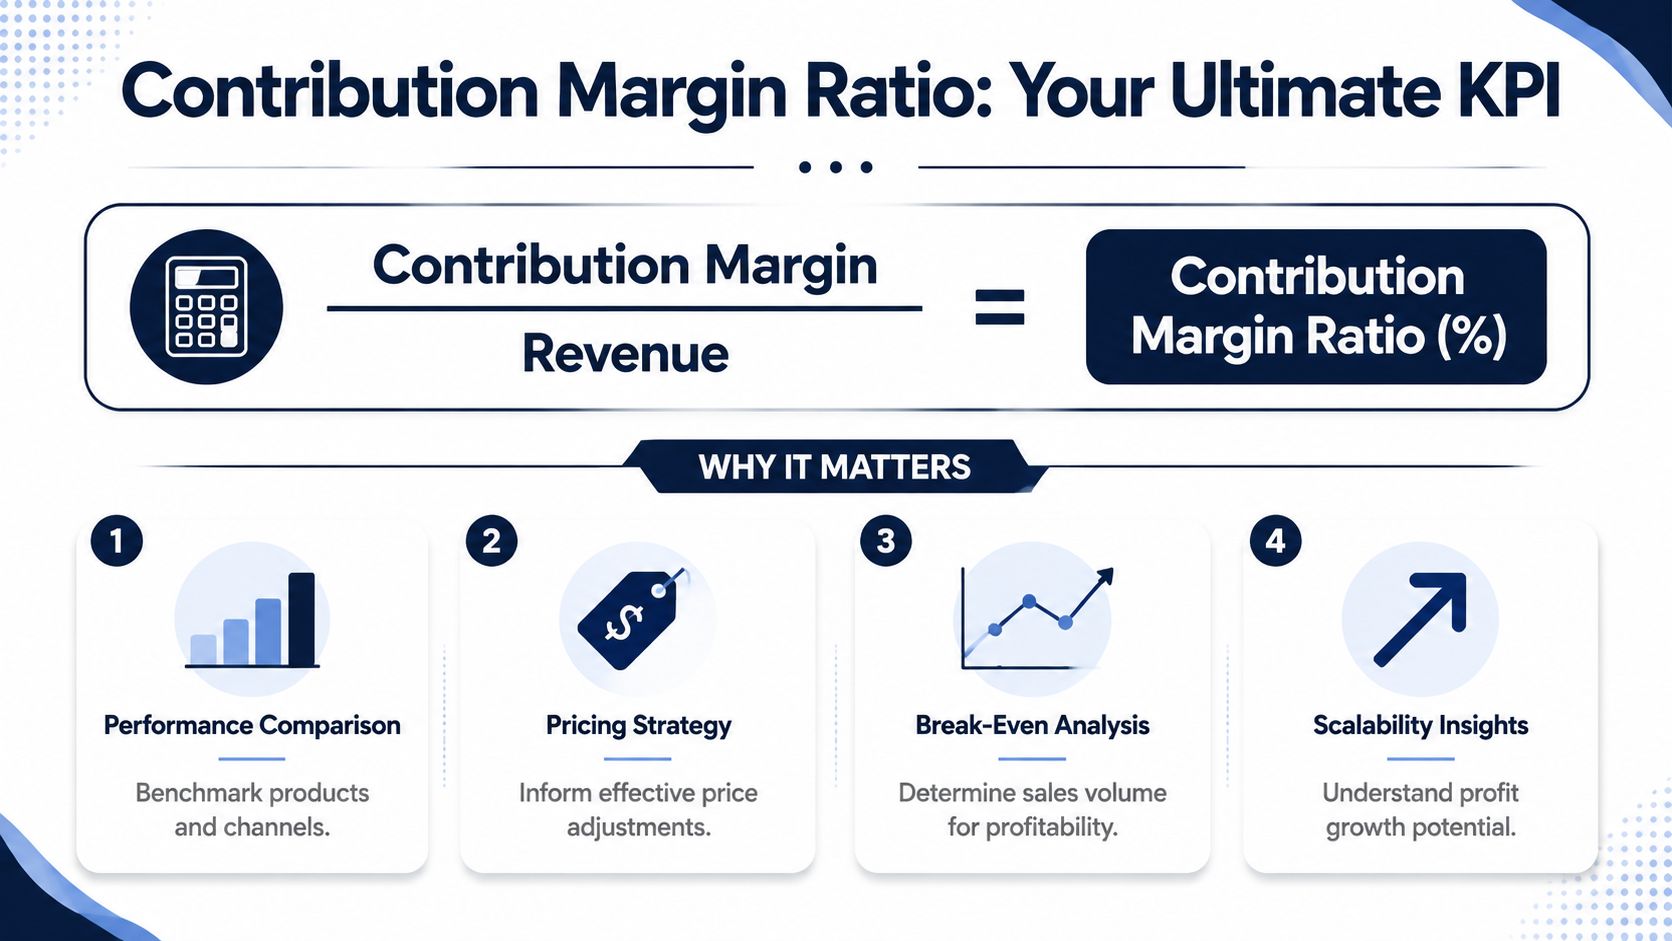
The ratio is what lets you compare unlike products on equal terms.
Here is the mistake I see often. A founder sees the bigger SKU throwing off more absolute dollars per order and assumes that product deserves more inventory and more paid traffic. But if the ratio is weaker, that product gives the business less room to absorb CAC swings, returns, fee increases, or a promo push. The lower-ratio SKU can grow revenue while making the company less flexible.
That trade-off shows up constantly in e-commerce. A premium bundle may generate more dollars per order, while a simpler replenishment SKU keeps a larger share of each sales dollar. On paper, the first product looks like the winner. In practice, the second one may be the better scaling asset.
There is no universal target because channel mix changes the math. Amazon brands carry a different variable-cost structure than DTC brands. FBA fees, referral fees, and return behavior can compress ratio fast. DTC brands may avoid marketplace fees but give that room back through paid social CAC, shipping subsidies, and higher return handling.
So the right question is not, “Is this ratio good in general?” The right question is, “Is this ratio strong enough for this channel, this acquisition model, and this stage of the business?”
A strong ratio buys options. It gives you room to test acquisition, absorb operational mistakes, and invest in growth without every decision turning into a cash-flow problem.
| View | What it tells you |
|---|---|
| Raw contribution margin | How many dollars a product leaves behind |
| Contribution margin ratio | How much of each revenue dollar remains available for overhead, CAC, and profit |
The metric offers operational utility. Rank SKUs, bundles, and channels by contribution margin ratio, then compare that ranking against revenue.
The gaps are usually more informative than the averages.
For operators who want a more detailed breakdown of the percentage itself, this guide on what contribution margin ratio means in practice is a useful companion.
The advanced move is to stop at neither product-level dollars nor product-level ratio. Top operators carry the same logic down to the customer level. They ask which first order, channel, or cohort leaves enough contribution to justify the next dollar of acquisition and support long-term LTV. That is where contribution margin stops being an accounting metric and starts acting like a growth filter.
A SKU can sell out, rank well on Amazon, and still make the business weaker. I have seen brands celebrate top-line growth while every extra order adds fulfillment strain, higher return exposure, and more ad spend than the product can support.
That is why contribution margin has to drive operating decisions, not sit in a finance tab no one uses.

Competitor pricing is useful context. It should not decide your floor.
The floor starts with your actual variable cost stack by channel. On Amazon, that usually means product cost, inbound freight, FBA fees, referral fees, storage exposure, returns, and PPC. On DTC, it usually means product cost, pick and pack, shipping, payment fees, returns, and the discount required to convert. If the post-discount contribution is too thin, the sale may create revenue while hurting the business.
Promotions expose weak math fast. A 20% discount can be manageable on one SKU and destructive on another because the fee structure and return behavior are different. Teams that know their floor can approve promos quickly, reject bad offers early, and stop debating based on instinct.
The right discount leaves enough contribution after fulfillment, fees, and acquisition to justify the order.
Revenue does not fund growth. Contribution does.
Paid media should be capped by what the order can carry after channel-specific variable costs. That is the practical link between contribution margin and unit economics for e-commerce brands. If a product throws off strong contribution per order, the brand has room to test creative, increase bids, and absorb normal volatility. If contribution is thin, scaling spend usually hides the problem for a few weeks and then shows up in cash flow.
This trade-off is sharper on Amazon because ad spend can rise faster than operators expect once competition increases on a keyword cluster. On DTC, the issue is often blended CAC masking weak first-order contribution. In both cases, product-level contribution is the filter. It tells you which SKUs deserve traffic and which ones need a pricing, sourcing, or offer change before more spend goes out the door.
Every catalog ends up in three groups.
This matters more than many founders admit. A low-margin SKU does not just underperform on paper. It takes up replenishment cash, customer service time, merchandising space, and ad budget that could have gone to products with better economics. On Amazon, catalog sprawl can also weaken inventory planning and PPC efficiency. On DTC, weak SKUs often survive because they convert well during promos even though they do little for profit.
Once the model is clean, the path to improvement is usually straightforward. Raise realized price. Lower landed cost. Reduce variable handling and fulfillment friction. Cut avoidable discounting. Rebuild bundles so the order mixes stronger and weaker items more intelligently.
The right lever depends on the constraint.
If conversion is strong but contribution is weak, pricing or discount depth is often the first issue. If sales are healthy but margin collapses on Amazon, fees, PPC intensity, or returns may be the problem. If DTC repeat rate is solid but first orders are barely breaking even, the answer may be a better entry bundle or a tighter shipping threshold rather than more acquisition spend.
Strong operators treat contribution margin as a decision system, not a report. They use it to decide what to promote, what to pause, what to reorder, and where a price increase will hold.
Before adding a new SKU, pressure-test the economics under normal conditions and under stress.
Ask four questions:
A product with healthy demand but narrow contribution is fragile. One fee increase, one bad return cycle, or one promotion that runs too deep can turn a promising launch into a cash drain.
The advanced move is to make these decisions at more than the SKU level. The best brands track contribution by product, channel, first order, and eventually customer cohort. That is where contribution margin starts shaping LTV, not just reporting past performance.
A bad contribution margin calculation is worse than none at all because it creates false confidence. The model looks precise. The decisions built on it aren't.
The biggest issue is usually cost classification. Teams mix fixed and variable costs, use gross sales instead of net sales, or leave out direct ad spend and fees that clearly belong in the variable stack.
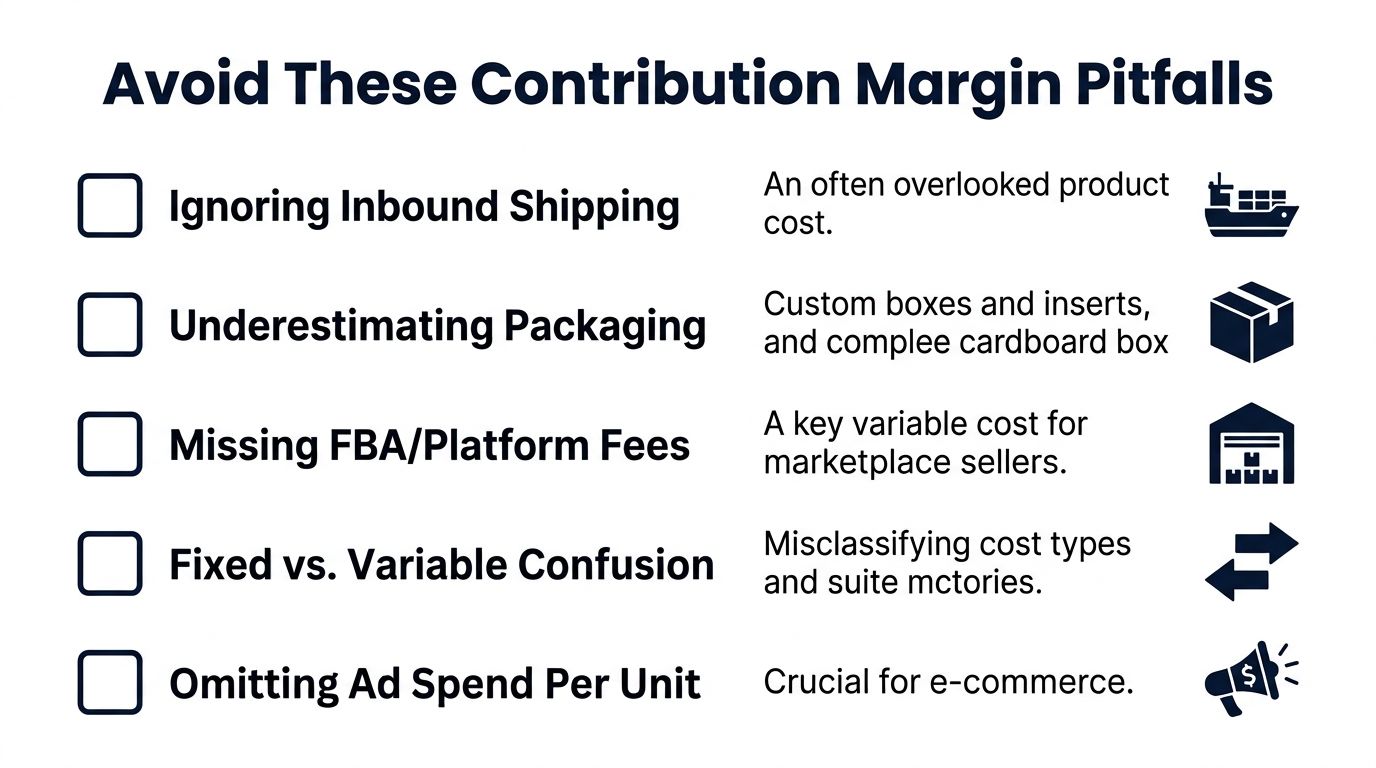
Here's where the math usually breaks:
Most of these errors make products look better than they are. That's the dangerous direction.
If the model overstates contribution, founders approve discounts that should have been rejected, keep ad campaigns running too long, and reorder inventory for products that aren't pulling their weight. None of those decisions fail immediately. They fail later, when the cash conversion cycle gets tight and the P&L finally catches up.
If a SKU only works when you ignore key variable costs, the SKU doesn't work.
If you want to pressure-test your numbers, ask these questions:
If the answer to any of those is no, clean up the model before using it to make growth decisions.
A customer places a strong first order on Amazon or your DTC site. The SKU-level margin looks healthy. Sixty days later, the economics tell a different story. They used a welcome discount, opened three support tickets, returned one item, and only came back after a paid retargeting touch. The product did its job. The customer did not produce the margin you thought you bought.
That is why serious operators move past order economics and measure contribution margin per customer.
Two customers can buy the same hero SKU and create very different cash outcomes. One pays full price, keeps the product, and reorders through email or Subscribe and Save. Another buys on promotion, creates more service cost, and needs paid media to generate the second purchase. If you stop at product margin, both customers can look identical when they are not.
Customer-level contribution margin changes how you evaluate growth. It shows which cohorts deserve more retention spend and which ones drain cash after the first conversion.
This matters more for Amazon and DTC brands because so many variable costs sit below the first order. Returns, replacement shipments, support load, loyalty offers, post-purchase discounting, and paid reactivation all change the economics of a customer over time. A clean first-order CAC number can hide a weak customer file.
Customer-level contribution margin gets more useful when you assign costs like these:
The practical use is simple. Stop asking only who buys again. Ask which customers still leave enough contribution after every variable cost tied to serving and retaining them.
That is where LTV gets sharper. A customer with lower top-line revenue can be worth more than a high-spend customer who returns heavily and consumes discount budget.
The brands that do this well stop overspending on low-quality cohorts. They spend harder on the segments that keep their contribution after the first sale.
If you're already operating at scale, these are the kinds of conversations worth having with founders who've solved the same problems in the wild. Million Dollar Sellers is an invite-only community for serious e-commerce operators building across Amazon, DTC, and omnichannel. It's where experienced founders compare real numbers, pressure-test decisions, and share the behind-the-scenes frameworks that lead to improved profitability.
Join the Ecom Entrepreneur Community for Vetted 7-9 Figure Ecommerce Founders
Learn MoreYou may also like:
Learn more about our special events!
Check Events.svg)
.svg)
.svg)

.svg)