What Is Contribution Margin Ratio and How It Drives Profit
Chilat Doina
February 7, 2026
For any e-commerce founder juggling a dozen things at once, the contribution margin ratio (CMR) is arguably the most important number you can track. It cuts through the noise and tells you exactly what percentage of every dollar you make is actually available to cover your fixed costs—like rent and salaries—and, eventually, turn into profit.
In short, it’s the cleanest possible look at how profitable a product is on a per-sale basis.
Your True North for E-commerce Profitability
Think of your revenue as water pouring into a bucket. Every sale adds more water, which is great. But that bucket has holes in it. These holes are your variable costs: the cost of the product itself, shipping fees, packaging, transaction fees, and sales commissions that you pay out on every single order.
The contribution margin ratio tells you precisely how much water is left in the bucket after accounting for all those leaks.
This percentage gives you a much sharper insight than just looking at total revenue or even gross margin. Why? Because it isolates the profitability of each individual sale, stripping away the fixed overhead that stays the same whether you sell one unit or ten thousand. A high CMR means your products are efficient money-makers, leaving a healthy chunk of change from each transaction to fuel the business.
Why This Ratio Is Your Most Important Compass
For anyone running an online store, this isn't just some accounting term. It’s a strategic compass that should guide your decisions every single day.
When you know your CMR, you can:
Set Smarter Prices: You’ll understand exactly how much wiggle room you have on pricing without killing your profitability.
Optimize Your Ad Spend: It helps you figure out the absolute maximum you can afford to spend to acquire a customer (your CPA) and still make money on the sale.
Make Better Inventory Choices: You can confidently decide which products to push hard, which ones need a price adjustment, and which ones are just dead weight and should be discontinued.
The contribution margin ratio isn't about how much money you make. It’s about how much money you keep from each sale to actually build your business. It turns guesswork into a data-driven strategy.
This metric is the foundation for scaling an online brand with confidence. To really get a handle on it, you might find more helpful examples in this guide to understanding contribution margin. It’s the number that allows you to invest in marketing, expand your product line, and build a resilient business. Without it, you're flying blind, unable to tell the difference between sales that fuel your growth and sales that are quietly draining your bank account.
Calculating Your Contribution Margin Ratio Step by Step
Knowing the theory is one thing, but the real magic happens when you apply this to your own products. Let's walk through how to actually calculate this for a modern e-commerce brand, moving from concept to concrete numbers.
Before you even touch a calculator, your books need to be clean. Seriously, accuracy is everything here. A solid double-entry bookkeeping system is the foundation for trustworthy sales and cost data. Garbage in, garbage out—so let’s make sure we’re starting with good numbers.
Gathering Your Key Data Points
The math itself is pretty simple. The hard part is correctly identifying all your variable costs. Let's build out a real-world scenario for a direct-to-consumer (DTC) product.
Imagine you're selling a premium, custom-branded water bottle. To get started, we just need two things:
Selling Price: What your customer actually pays for one bottle.
Variable Costs: Every single cost you eat only when you sell one unit.
For our example, let's say the water bottle sells for $50.00. Now for the tricky part—let's pin down every variable cost tied to a single sale.
Identifying Every Variable Cost
This is exactly where most founders trip up. It’s so easy to underestimate the true cost of getting a product into a customer's hands. It's way more than just the cost of the item itself.
For our $50.00 water bottle, here’s what a realistic cost breakdown looks like:
Cost of Goods Sold (COGS): What you paid your supplier for the bottle. Let's call it $12.00.
Packaging: The branded box, any protective filler, and the thank-you card you slip inside. Let's say that's $1.50.
Shipping & Fulfillment: The all-in cost to pick, pack, and ship the order. We'll peg this at $7.00.
Payment Processing Fees: Your payment gateway (like Stripe or Shopify Payments) takes a slice. A common rate of 2.9% + $0.30 on a $50.00 sale comes out to $1.75.
Product-Specific Ad Spend: If you’re running a specific Google Shopping campaign for this bottle, you need to include the average cost per sale. Let's budget $5.00 for this.
Time to add it all up to get our total variable cost per unit.
Total Variable Cost Per Unit = $12.00 (COGS) + $1.50 (Packaging) + $7.00 (Shipping) + $1.75 (Processing) + $5.00 (Ads) = $27.25
That's the number we need. If you're struggling to nail down these expenses, our guide on how to calculate product costs is a great place to dig deeper.
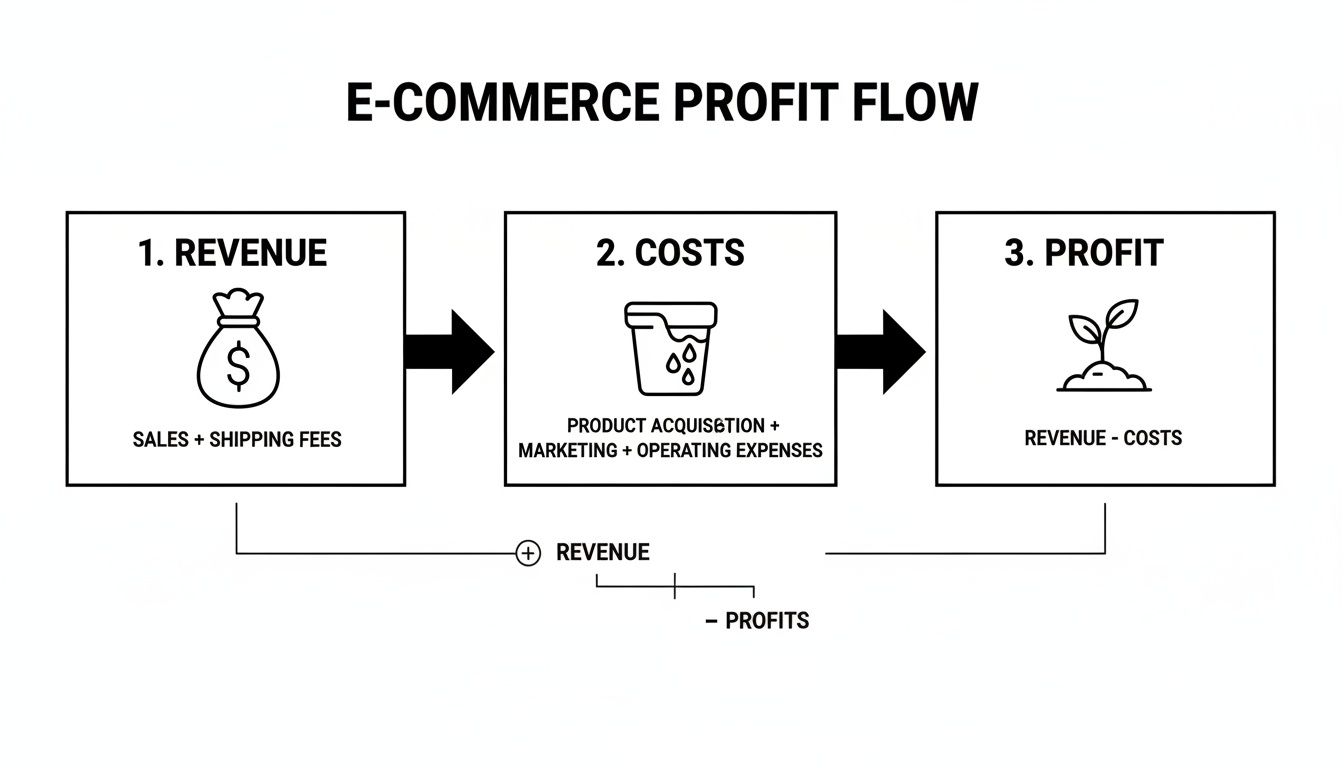
This simple infographic shows how revenue flows through your business, gets reduced by various costs, and finally (hopefully) leaves you with a profit.
It’s a great visual reminder that you only start making actual profit after all your costs—both variable and fixed—are covered.
Putting It All Together
Okay, we’ve done the legwork. Now for the easy part. It’s just a two-step process from here.
Calculate the Contribution Margin (in dollars):
Formula:Selling Price - Total Variable Costs
Calculation:$50.00 - $27.25 = $22.75
This $22.75 is what’s left over from each sale to help pay for all your fixed business expenses (think rent, software, salaries).
Calculate the Contribution Margin Ratio (as a percentage):
Cost of Goods Sold (COGS): What they pay the manufacturer is $7.00.
Inbound Shipping: The cost to get inventory to Amazon's warehouses, averaged out per unit, is $0.75.
Amazon Referral Fee: Amazon’s standard 15% cut of the sale price, which works out to $5.25.
FBA Fulfillment Fee: This covers picking, packing, and shipping to the customer, coming in at $4.50.
Amazon Advertising (ACOS): Their average ad spend to generate one sale for this product is $3.50.
Find the Break-Even Point: First, they need to know the exact revenue target that gets them out of the red. The formula is simply Fixed Costs / Contribution Margin Ratio.
Calculation:$150,000 / 0.60 = $250,000
Set a Sales Goal: They need to generate $50,000 more in sales to hit their break-even point. Anything beyond that is pure profit.
Build an Action Plan: With a 60% CMR, every new dollar in revenue contributes 60 cents toward that goal. This gives them a powerful metric to guide their marketing spend. They can now confidently invest in channels like Facebook Ads or influencer marketing, knowing precisely how much profit each new sale drives.
Fulfillment Fees: Like Amazon FBA fees, which can take a massive bite out of your revenue.
Payment Processing Fees: That 2.9% + $0.30 from Stripe or Shopify Payments adds up fast.
Shipping Costs: The actual price of the label and the box to get the product to your customer.
Sales Commissions: Any affiliate payouts or platform transaction fees.
Selling Price: $80.00
Cost of Goods Sold (COGS): $30.00
Gross Profit: $50.00
Gross Margin: ($50 / $80) = 62.5%
Selling Price: $80.00
COGS: $30.00
Shipping & Packaging: $8.50
Payment Processing (2.9% + $0.30): $2.62
Customer Acquisition Cost (Ad Spend): $15.00
Total Variable Costs:$56.12
Product Price: $100
Total Variable Costs: $60
Contribution Margin: $40
Contribution Margin Ratio (CMR): 40%
High-CMR Products (>45%): These are your winners. Pour your marketing budget here, make sure they're always in stock, and think about creating new variations.
Medium-CMR Products (30-45%): These are solid, reliable performers. Look for ways to boost their margin, maybe by negotiating better terms with suppliers or finding cheaper packaging.
Low-CMR Products (<30%): These are your problem children. They either need a price increase, a serious cost-cutting effort, or it might just be time to say goodbye.
Direct-to-Consumer (DTC) Brands: A solid DTC brand often shoots for a CMR in the 40-45% range. Selling directly from their own website gives them more pricing power, which helps margins. The trade-off? They foot the entire bill for marketing and fulfillment.
Amazon FBA Sellers: If you’re selling on Amazon, a CMR of 30-35% is generally considered strong. You get access to Amazon's massive audience, but the referral fees and FBA costs chip away at the margin on every single sale.
Dropshipping Models: This model’s CMR can be all over the place, but a healthy range is typically 20-30%. You have no inventory costs, which is great, but your cost of goods is usually higher, putting a squeeze on potential profit.
Product Category: Selling high-end luxury goods or custom-made items? You can probably command higher prices and support a higher CMR. On the other hand, if you're in a competitive space selling commoditized products, you'll be operating on much thinner margins.
Supply Chain Complexity: Brands with intricate manufacturing processes or those sourcing unique materials will naturally have higher variable costs. This, in turn, lowers their potential CMR. A simpler supply chain usually leads to a healthier ratio.
Market Competition: In a dog-eat-dog market, you might have to compete on price, which is a direct hit to your margin. Brands with a powerful unique selling proposition (USP) can often charge a premium and protect their CMR.
Contribution Margin is a straight-up dollar amount (Sales - Variable Costs). Think of it as the raw cash a sale generates to help you pay your fixed costs like rent and software. It’s the fuel for your business.
Contribution Margin Ratio is a percentage (Contribution Margin / Sales). This number measures efficiency—it shows you what percentage of every single dollar in sales actually turns into that fuel. It's the only way to truly compare the profitability of different products on an apples-to-apples basis.
Payment processing fees from services like Stripe or Shopify Payments.
Sales channel commissions or those marketplace referral fees from Amazon.
Pick-and-pack fulfillment labor, especially if you use a 3PL.
Product-specific ad costs (you need to average these out per sale).
In both the Amazon and DTC examples, the contribution margin ratio acts as a critical diagnostic tool. It pulls founders out of the world of "gut feelings" about profitability and gives them a hard number to build a strategy around. It’s more than just a metric; it's a roadmap for sustainable growth.
Why CMR Is a Sharper Metric Than Gross Margin
A lot of e-commerce founders live and die by their gross margin. It’s a classic, top-level metric that seems to tell you how profitable your products are. But here’s the problem—it only tells part of the story, and relying on it alone can lead to some dangerously misleading conclusions about your business’s health.
Gross margin is calculated by taking your revenue and subtracting only the Cost of Goods Sold (COGS). That's it. It completely ignores a huge list of other costs that directly fluctuate with every single sale you make. These are the modern costs of doing business online.
Think about it. What’s missing from the standard gross margin calculation?
This is where the contribution margin ratio (CMR) really proves its worth. It includes all of these variable costs, giving you a much sharper, more realistic view of how much cash each sale actually adds to your bottom line. Gross margin might tell you if your product is profitable on paper, but CMR tells you if it's profitable in the real world. For a deeper dive into the classic metric, you can learn more about what gross margin is and how it's calculated.
To really drive this home, let's put these two metrics head-to-head.
Contribution Margin Ratio vs. Gross Margin
.tbl-scroll{contain:inline-size;overflow-x:auto;-webkit-overflow-scrolling:touch}.tbl-scroll table{min-width:600px;width:100%;border-collapse:collapse;margin-bottom:20px}.tbl-scroll th{border:1px solid #ddd;padding:8px;text-align:left;background-color:#f2f2f2;white-space:nowrap}.tbl-scroll td{border:1px solid #ddd;padding:8px;text-align:left}MetricContribution Margin RatioGross MarginCosts IncludedIncludes all direct, per-sale variable costs (COGS, fulfillment, shipping, payment fees, commissions, ad spend).Only includes the Cost of Goods Sold (COGS).Profitability ViewShows the true cash contribution of each sale after all variable costs are paid.Provides a high-level, often inflated view of product profitability.Best Use CaseMaking decisions on pricing, ad spend, and SKU-level viability. It's an operational powerhouse.Useful for understanding production efficiency and basic product markup.The Bottom LineAnswers: "How much money does this specific sale add to my bank to cover fixed costs and generate profit?"Answers: "How much am I making on this product before accounting for the costs of selling it?"
As you can see, CMR gives you the granular, real-world data you need to make smart operational decisions. Gross margin is a good starting point, but it's not the full story.
Seeing the Difference Side-by-Side
The best way to feel the gap between these two metrics is to look at the same product through both lenses. Let’s analyze a hypothetical product—a high-end, custom-printed hoodie sold on a DTC website for $80.
First, let's look at it from a simple gross margin perspective.
A 62.5% gross margin looks fantastic. Based on this number alone, you’d probably want to pour marketing dollars into this hoodie and stock up on inventory. It seems like a clear winner.
Now, let's run the same sale through the more rigorous contribution margin ratio formula, adding in the other variable costs that gross margin skips.
With all the real-world costs included, the picture changes dramatically.
Suddenly, our "wildly profitable" hoodie has a CMR of just under 30%. It’s still profitable, but the financial reality is less than half of what the gross margin suggested. This is the kind of clarity that prevents founders from scaling a product that is only marginally profitable, saving them from potentially catastrophic cash flow problems down the line. Elite operators don't just look at gross margin; they rely on the contribution margin ratio to make the tough, correct calls on pricing, ad spend, and overall product viability.
Using CMR to Make Smarter E-commerce Decisions
Knowing your contribution margin ratio is the first step. Actually using it to drive your strategy is where you start to win. This isn't just some number you glance at in a financial report—it's a hands-on tool that separates the thriving e-commerce brands from the ones that stall out. It turns complex business problems into simple math.
Let's move past the theory and dig into the three most important ways you can use CMR to build a more profitable, resilient online business.
Set Profitable Pricing Structures
Pricing your products can feel like a shot in the dark, right? You're constantly trying to balance what the market will pay against your own costs. The contribution margin ratio cuts through that guesswork by giving you a clear floor for profitability. It shows you exactly how much wiggle room you have.
For example, if one of your products has a 45% CMR, you know that every dollar it earns brings in 45 cents to cover your fixed costs and build profit. Now, let's say you want to run a 10% off sale. You can instantly see how that hits your margin. You’ll know precisely how many more units you have to sell at the lower price just to make the same amount of money you were before.
That kind of clarity is a game-changer. You can model the financial impact of promotions, price hikes, or product bundles before you launch them, making sure every decision actually helps your bottom line.
Optimize Ad Spend and Maximize ROI
One of the biggest questions for any e-commerce brand is, "How much can I actually afford to spend to get a new customer?" Your contribution margin gives you the answer. The dollar value of your contribution margin is your maximum allowable cost per acquisition (CPA) if you want to break even on that first sale.
Let's break it down with a real-world example:
In this scenario, you can spend up to $40 on ads to acquire a single customer without losing money on that transaction. Any CPA below $40, and that sale is instantly profitable. Knowing this number lets you set aggressive—but smart—budgets for your campaigns on platforms like Meta and Google, confident that your ad dollars are fueling real growth. Our complete guide on understanding unit economics goes even deeper into this crucial relationship.
Perform Smart SKU Rationalization
Not all of your products are pulling their weight. Some items in your catalog are your star players, driving a huge chunk of your profit, while others might quietly be costing you money. SKU rationalization is just a fancy term for analyzing your product lineup to decide which ones to promote, which to improve, and which to cut loose. Your CMR is the perfect tool for the job.
By calculating the CMR for every single product, you can rank your entire catalog from most to least profitable.
This isn't just theory. A 2022 case study of a company called Beta Company showed this in action. Their business-wide CMR was a decent 34%, but when they dug into individual products, they found a single SKU with a pathetic 25% CMR. By cutting that one product, they freed up 15% more cash to invest in high-margin launches and ended up boosting their overall profitability by a staggering 22%. It shows how CMR gives you the data needed to make tough but necessary calls.
By focusing your resources on high-CMR products, you ensure that your marketing budget, inventory investment, and operational efforts are all directed toward the items that have the biggest positive impact on your company's financial health.
Benchmarking a Good Contribution Margin Ratio
So, you’ve calculated your contribution margin ratio. The next question that immediately pops into your head is probably, "Is this number any good?"
There's no single magic number here. The answer depends heavily on your industry, your business model, and how crowded your market is. For a metric like this, context is everything.
A software company with almost no variable costs might hit a CMR of 80% or higher. But for those of us selling physical products, the reality is a much lower figure. For e-commerce founders, a "good" ratio is a moving target that shifts based on your sales channels and how complicated your operations are.
Typical E-commerce CMR Benchmarks
Knowing where you stand against the rest of the market is crucial. While every business is unique, there are some generally accepted ranges you can use as a starting point for your own analysis.
Here’s a quick look at how different e-commerce models usually stack up:
A "good" CMR is one that not only covers all your fixed operating costs but also leaves enough profit to reinvest in growth. If your CMR is 35% but your fixed costs eat up 40% of your revenue, you have a problem no matter what the benchmark says.
Factors That Influence Your Target CMR
Your ideal contribution margin ratio isn't set in stone. Several key factors can nudge your target number up or down, and you need to understand them to evaluate your performance properly.
Think about how these elements play out in your business:
For top-tier e-commerce entrepreneurs, like the ones in the Million Dollar Sellers community, benchmarking this metric is a core discipline. For instance, a fashion brand selling on both Shopify and Amazon might achieve a blended 42% CMR. That number becomes a north star for all their financial planning. You can get more details on how leading brands use this metric to stay profitable in this breakdown of the contribution margin formula.
Armed with this knowledge, you can do more than just measure your performance. You can truly understand its strength relative to your specific market, turning your CMR from a simple number into a strategic guide for every major financial decision you make.
Common Questions About Contribution Margin Ratio
Even after you get the hang of the basics, a few practical questions always seem to pop up once you start plugging the contribution margin ratio into your own business. Let's tackle the most common ones we hear from e-commerce founders.
Contribution Margin vs. Contribution Margin Ratio
It’s incredibly easy to mix these two up, but they tell you very different stories about your business.
Sure, a high dollar contribution margin is nice. But a high ratio? That's the sign of a healthy, scalable product that can really grow.
How Often Should I Calculate It?
For a business that moves as fast as e-commerce, checking your contribution margin ratio needs to be a regular habit.
A monthly calculation is the bare minimum. But the top operators? They're often tracking this weekly, especially during crazy periods like Q4 or when a big promotion is running. This lets them spot margin erosion almost instantly and tweak their pricing or ad spend before a small problem becomes a huge one.
Keeping a close eye on it prevents you from waking up one day and realizing you’ve had a profitability leak for months.
Can a Negative Contribution Margin Ever Be a Good Idea?
Almost never. A negative contribution margin means you are actively losing money on every single unit you move—and that's before you even factor in fixed costs. Each sale just digs a deeper hole.
The only time this isn't a terrible idea is in a very specific "loss leader" strategy. This is where you intentionally lose money on one popular item to lure in customers who will (hopefully) buy other, high-margin products. It’s a risky game that requires meticulous tracking and isn't something we'd recommend unless you have a crystal-clear, data-backed plan to come out on top.
What Are the Common Mistakes When Calculating Variable Costs?
The single biggest mistake we see is undercounting variable costs. So many founders remember the cost of goods sold (COGS) but completely forget about all the other little "leaks in the bucket."
Here are the costs that get missed most often:
Forgetting even one of these can paint a dangerously rosy picture of your profitability. Be a hawk about it.
At Million Dollar Sellers, the world's top e-commerce founders share the exact playbooks they use to track and master critical metrics like the contribution margin ratio. If you're a serious seller looking to scale your brand faster and more profitably, see if our exclusive community is right for you. Learn more about joining Million Dollar Sellers.
And there it is. Our contribution margin ratio is 45.5%.
This isn't just a random percentage. It’s a powerful metric that tells you for every single dollar in sales this water bottle brings in, 45.5 cents are available to cover your fixed costs and then become pure profit. This is the true measure of your product's financial horsepower.
CMR in Action With Real-World E-commerce Scenarios
Theory is one thing, but seeing the contribution margin ratio in action is where you really start to appreciate its power. Abstract formulas come alive when you plug in real numbers and use them to make strategic decisions. So, let's step away from the calculator for a minute and walk through two scenarios that show exactly how savvy e-commerce operators use this metric to steer their business.
First, we'll look at an Amazon FBA business navigating its complex fee structure. Then, we’ll see how a direct-to-consumer (DTC) brand uses its CMR to justify an aggressive ad spend.
Scenario 1: The Amazon FBA Seller
Picture an Amazon brand that sells high-quality kitchen gadgets. One of their top sellers is a premium garlic press that goes for $35. Amazon is a fantastic sales channel, but it’s notorious for its long list of variable costs that take a bite out of every single sale.
Here’s a pretty standard cost breakdown for one unit sold via FBA:
Add it all up, and the total variable cost per unit is $21.00. That leaves a contribution margin of $14.00 per sale ($35.00 - $21.00).
A 40% CMR tells the owner that for every $35 garlic press they sell, they get $14 in cash to put toward fixed costs like software, storage fees, and salaries. For an FBA business, where fees can bleed you dry, that's a solid number. Armed with this knowledge, the owner can set ad budgets with confidence, knowing they can spend up to $14 to get a customer and still break even on that specific sale.
Scenario 2: The DTC Brand Scaling With Ads
Now, let's switch gears to a fictional DTC brand, 'Dobson Books Company,' to see how this metric plays out in a different business model. They sell curated book sets directly from their own website, which gives them way more control over both the customer experience and their margins.
Many seven-figure Amazon sellers in communities like Million Dollar Sellers live and breathe by their CMR because it's the key to scaling without going broke. Let's say Dobson Books Company did $200,000 in revenue last year. Their variable costs—things like packaging, shipping, and fulfillment labor—added up to $80,000. This left them with a contribution margin of $120,000, giving them a healthy 60% CMR ($120,000 / $200,000).
That means for every dollar in sales, 60 cents went directly toward covering their fixed costs. But here’s the twist: their fixed costs (warehouse lease, software subscriptions, marketing team salaries) were a hefty $150,000. The result? A $30,000 operating loss for the year. By using their CMR, they can see a clear path to profitability. For a deeper dive into financial ratios like this, Intuit offers some great resources on how experts calculate contribution margin.
From Diagnosis to Data-Driven Plan
Dobson's 60% CMR is a massive asset. It immediately tells them that their products are fundamentally profitable—the issue isn't their margins, it's a lack of sales volume to cover their overhead.
Suddenly, their game plan becomes crystal clear:
Join the Ecom Entrepreneur Community for Vetted 7-9 Figure Ecommerce Founders


.svg)
.svg)
.svg)

.svg)