
Chilat Doina
August 27, 2026
You've got a product that appears to have demand, an ad account full of activity, and a dashboard that says people are clicking. Yet the next inventory order feels like a bet. You're not sure whether customers want the new flavor, whether the bundle is priced correctly, or whether the audience in your campaign is made up of likely buyers or merely curious browsers.
That uncertainty is where DTC market research earns its place. It isn't a polished survey delivered once before launch. It's the operating system that helps a founder decide what to build, whom to target, how to position it, where to sell it, and whether growth is producing durable profit. The global direct-to-consumer market was valued at USD 684.4 billion in 2025 and is projected to reach USD 2.8395 trillion by 2034, according to IMARC Group's direct-to-consumer market analysis. That scale makes guesswork more expensive, not less.
A founder I've worked with once spent weeks debating two product variants. The team liked one, the agency preferred the other, and the early ads generated enough clicks to support either story. They were close to placing a large inventory order when five customer conversations exposed the issue: shoppers didn't understand the difference between the variants and wanted a simpler choice.
That's the practical value of research. It can kill an expensive assumption before the assumption becomes packaging, inventory, creative, and customer support work. A survey might eventually have confirmed the preference, but a few well-selected conversations revealed the language and confusion that a rating scale would have missed.
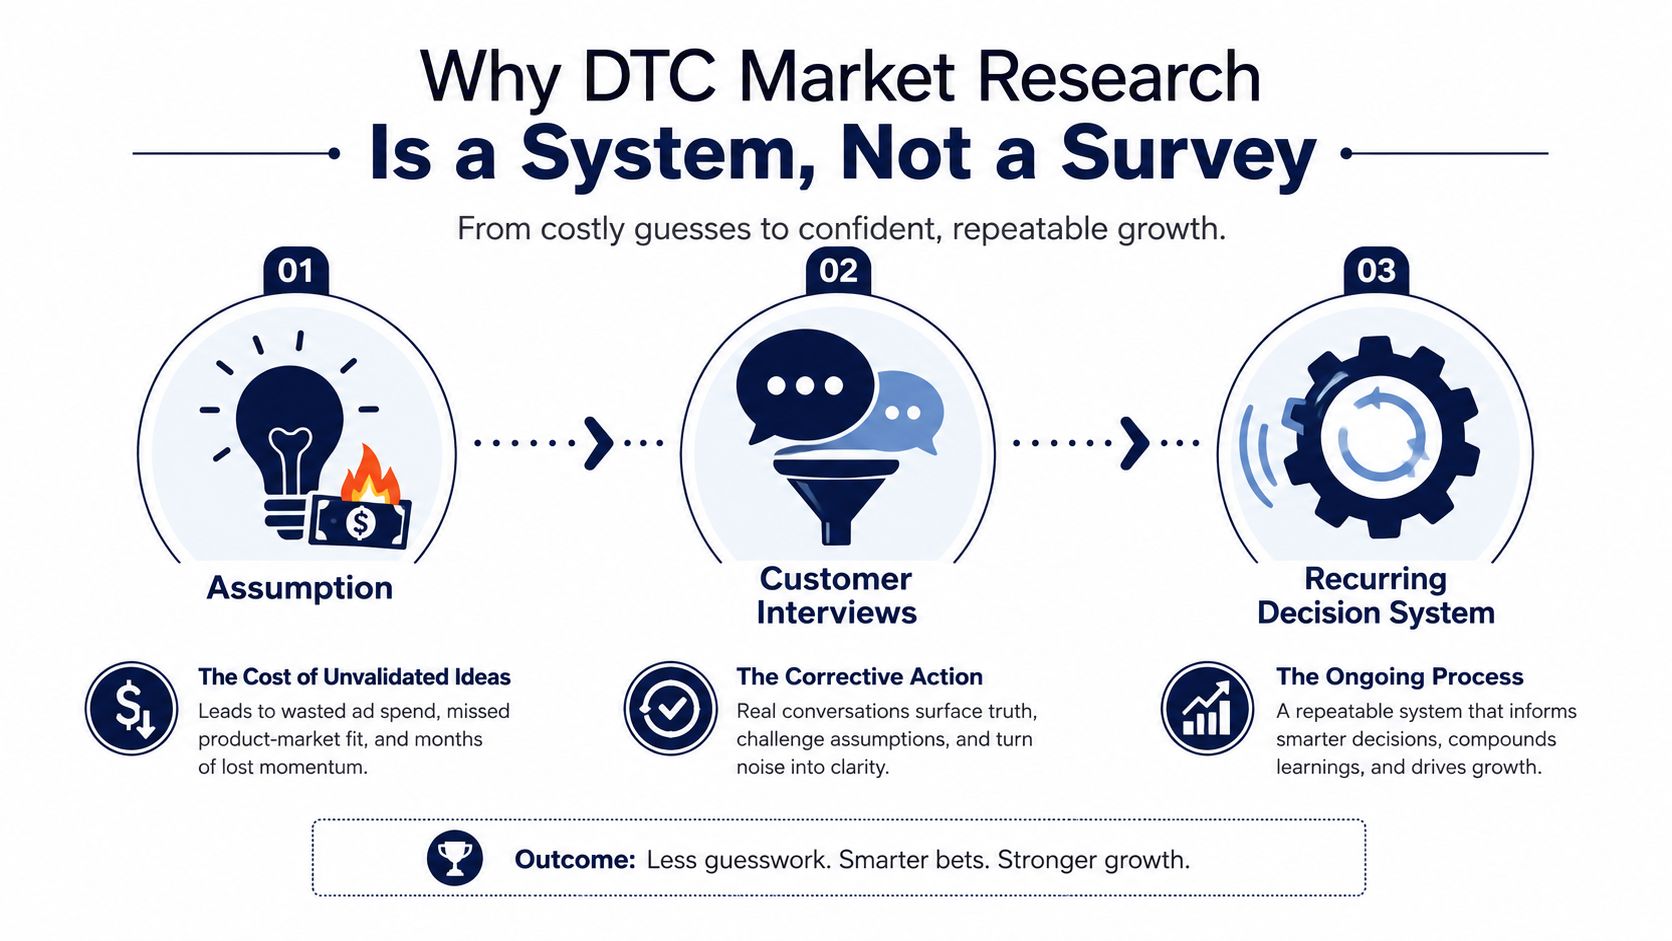
Treat every research project as a loop:
Suppose you're choosing between a single hero product and a bundle before committing to production. Interviews can uncover the buying occasion, a concept test can compare the promise, and a live offer test can show whether shoppers behave differently when money is involved. Research earns its budget when it changes that decision, not when it produces a slide deck.
A one-off survey creates stale personas, generic copy, and channel decisions based on the loudest internal opinion. A recurring system keeps four pillars active: segmentation, competitive signals, hypothesis testing, and outcome measurement. The next sections turn those pillars into operating practices, starting with the customer groups most likely to create repeatable revenue.
“Women aged 25 to 40 who like wellness” is an audience description, not an ICP. It gives an ad platform a starting point, but it doesn't tell a product team what problem to solve or a copywriter what moment should appear in the headline.
A usable ICP adds behavior and context. For example, consider a 33-year-old urban professional who starts looking for adaptogens after a stress-related doctor's visit, discovers products through Instagram Reels, compares ingredient transparency, and will pay $48 for a 30-day supply. That archetype changes the research questions. You'd ask what prompted the search, what alternatives were considered, which claims feel credible, and what would make the product worth renewing.
A practical customer profile should include:
For a deeper framework, this guide to defining customer profiles offers useful prompts for turning broad demographic descriptions into actionable profiles. Your segmentation work should also distinguish buyers from lookers, rather than treating every site visitor as equally valuable. Recency, purchase frequency, product category, refund history, and willingness to pay are more useful cuts than a single age bracket.
Use market segmentation principles to decide which groups deserve different treatment. A recent buyer might need onboarding research. A lapsed customer needs churn questions. A high-frequency purchaser can explain retention mechanics. A non-buyer who reached checkout can reveal friction without pretending to represent the whole market.
| Dimension | Vague Audience | Research-Grade ICP |
|---|---|---|
| Demographics | Women interested in wellness | Urban professionals with a defined life stage and purchasing context |
| Trigger | Wants to feel better | A recent stress-related concern prompts active category research |
| Discovery | Uses social media | Finds products through Instagram Reels and then compares proof |
| Evaluation | Likes natural products | Checks ingredients, credibility, reviews, and recurring value |
| Price | Premium-minded | Accepts a specific price when the benefit feels credible |
| Research use | Broad awareness questions | Questions tied to trigger, language, objections, and renewal |
Don't spread equal attention across five imagined personas. Returning customers, lapsed buyers, and qualified prospects usually tell you more about economics than casual visitors. Interview the groups that can explain a decision, survey the groups you need to size, and use panel data only when you need perspectives your owned audience can't provide.
Qualitative and quantitative research answer different questions. Interviews explain why a customer acted. Surveys show how common a reported attitude or behavior may be within a defined sample. Neither method rescues a weak research question.
Start with interviews when the problem is poorly understood. Five conversations can expose the phrases customers use, the alternatives they considered, and the moment that made them care. Once those patterns are visible, a survey can test whether they appear beyond the interview group. Diary studies, customer-service transcripts, reviews, and social listening add unprompted language that respondents may never recall in a formal questionnaire. A practical primer on qualitative data methods by SigOS is useful when your team needs a disciplined way to code those conversations instead of collecting anecdotes.
| Method | Best For | Sample Size | Decision It Informs |
|---|---|---|---|
| Customer interviews | Jobs to be done, objections, language | Small, purposeful group | What problem and message deserve testing |
| Diary study | Usage moments and recurring friction | Small, recruited participants | What happens between purchase and repurchase |
| Post-purchase survey | Satisfaction, motivation, reported outcomes | 200+ can be practical for directional work | Which themes are common enough to prioritize |
| Concept test | Product or positioning comparison | Defined target sample | Which idea merits a live-market test |
| Pricing questions | Perceived value and price boundaries | Quantitative sample | Whether to explore tiers, bundles, or a single offer |
| Live split test | Behavior under real conditions | Depends on traffic and detectable effect | Which version earns a shipping or scaling decision |
The common failure is running a large survey before speaking with a single buyer. You get clean-looking charts built from poorly worded questions. A better default sequence is five interviews, followed by a 200-respondent survey for directional sizing, followed by a live split test on the strongest concept.
Typeform works well for short owned-audience surveys. Dovetail is useful for organizing interview notes and coding themes. Pollfish can help recruit respondents beyond your customer list, but panel quality and screening deserve scrutiny. Skip heavyweight research suites until your decisions justify them. A simple survey, a structured interview guide, and a real-market test will usually beat a complicated platform used without a clear hypothesis.
Most founders choose competitors by category. That's too narrow. The brand with the largest revenue may be a useful reference for distribution and merchandising, but it may be a terrible model for your positioning. You need to know which competitor teaches you about scale, which one exposes a winnable wedge, and which one attracts customers you could convert if the value equation changed.
Use three archetypes:
Price architecture means more than recording the headline SKU. Map the entry product, bundle logic, replenishment offer, shipping threshold, and subscription incentive. A competitor may appear expensive until its bundle reduces the effective price, or appear affordable until repeat orders carry a different cost.
Positioning requires reading what a brand excludes. Who is the product clearly for, and who would feel out of place buying it? Compare headlines, product pages, packaging, reviews, and creator language. Look for claims every competitor repeats, then identify the customer concern nobody addresses directly.
Retention signals include subscription framing, reorder reminders, product education, review velocity, and the way the brand handles cancellations. Don't assume a visible subscription program proves strong retention. Treat it as a signal to investigate, not a result to copy.
Discovery extends beyond Meta ads. Check creator content, marketplaces, social commerce, search results, affiliate pages, email capture, and community conversations. The brand customers encounter first may not be the brand with the strongest website.
Practical rule: Copy the customer problem your competitor has clarified, not the surface assets it has already distributed.
Your audit can include the site, public ad libraries, email flows, review themes, marketplace listings, and the DTC tools stack. The output shouldn't be a scrapbook of screenshots. It should identify table stakes, overplayed messages, operational weaknesses, and a profitable wedge you can defend.
| Lens | Volume Leader | Niche Peer | Aspirational Brand |
|---|---|---|---|
| Price | Broad ladder and aggressive bundles | Focused offer with a clear use case | Premium anchor and polished presentation |
| Positioning | Category ownership | Specific customer problem | Emotional identity and status |
| Retention | Automated replenishment | Community or education loop | Experience, loyalty, and brand affinity |
| Discovery | Broad paid and marketplace reach | Specialist creators and communities | Organic attention and cultural relevance |
A survey can be statistically tidy and strategically wrong if the respondents don't resemble buyers. Founders often recruit whoever is easiest to reach, then interpret the result as market truth. The first safeguard is targeting. Survey recent buyers, lapsed customers, qualified prospects, or a carefully screened panel according to the decision you're making.
For brand awareness or tracking work, 400 to 600 respondents is a practical baseline and typically supports a margin of error of roughly ±4% to ±5%, according to Vase.ai's survey sample size guide. Smaller exploratory samples of 100 to 200 respondents can support directional validation, with an approximate ±7% to ±10% margin of error, but they're weak foundations for important subgroup decisions. A global randomized sample of 1,500 people can provide an approximate ±3% margin of error at 95% confidence, which is a useful benchmark when comparing markets.
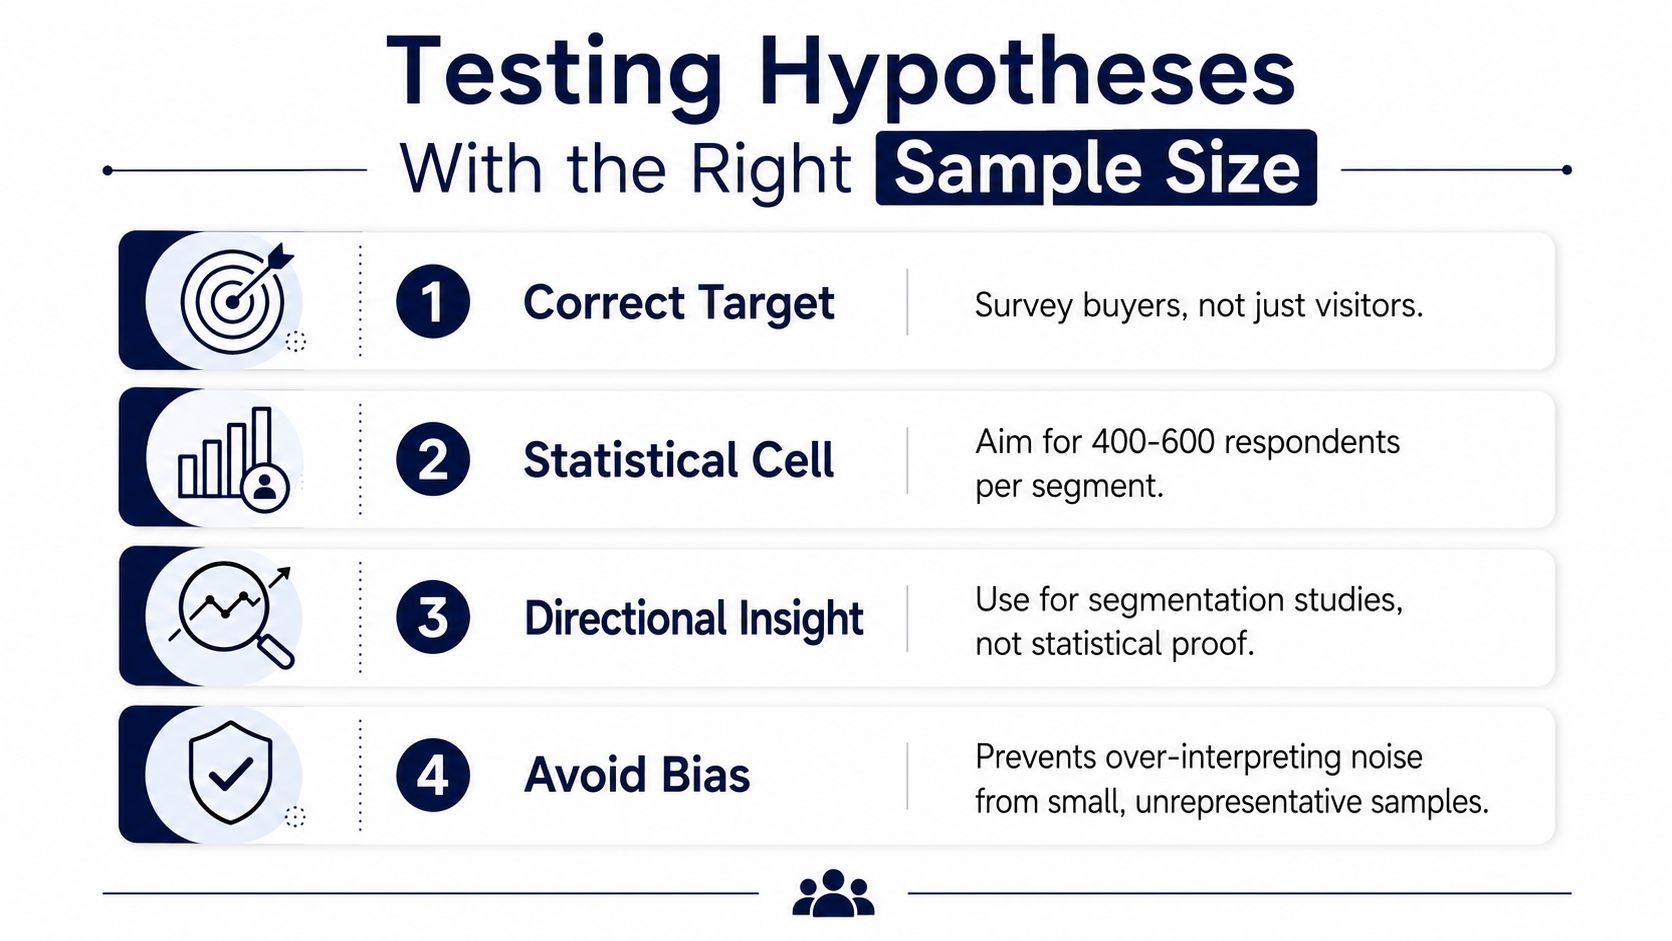
Sample size isn't one universal total. Calculate it for the subgroup or geography you need to analyze. Over-recruit by 10% to 15% to absorb screen-outs and incomplete responses, as the cited research guide recommends. The exact buffer depends on your screening design, but skipping it guarantees that the final usable sample will be smaller than planned.
Write a short pre-registration note:
For landing pages and pricing, don't call a small directional test a definitive winner. Define the minimum difference that would matter financially, then make sure the test can detect it. The guide to statistical significance can help your team avoid treating random movement as a decision.
Cheap panels are tempting, but bias usually costs more than noise. If respondents rush, fail screening, or don't resemble your buyer, more responses won't repair the design.
A paid ad can produce a click, an order, and a flattering dashboard while adding little profitable demand. The buyer may have returned anyway, the order may lose margin after fulfillment and support, and weak repeat behavior can prevent that acquisition from paying back.
That distinction matters because more than 80% of DTC marketers still use click-based data as a primary metric, while 69% are concerned about its accuracy, according to the State of DTC Marketing Measurement survey summary. The same source reports that only 4.7% use incrementality experiments and 2.5% use multi-touch attribution as primary methods. Clicks remain useful for diagnosing creative and traffic problems. They are a poor substitute for evidence that marketing created profitable demand.
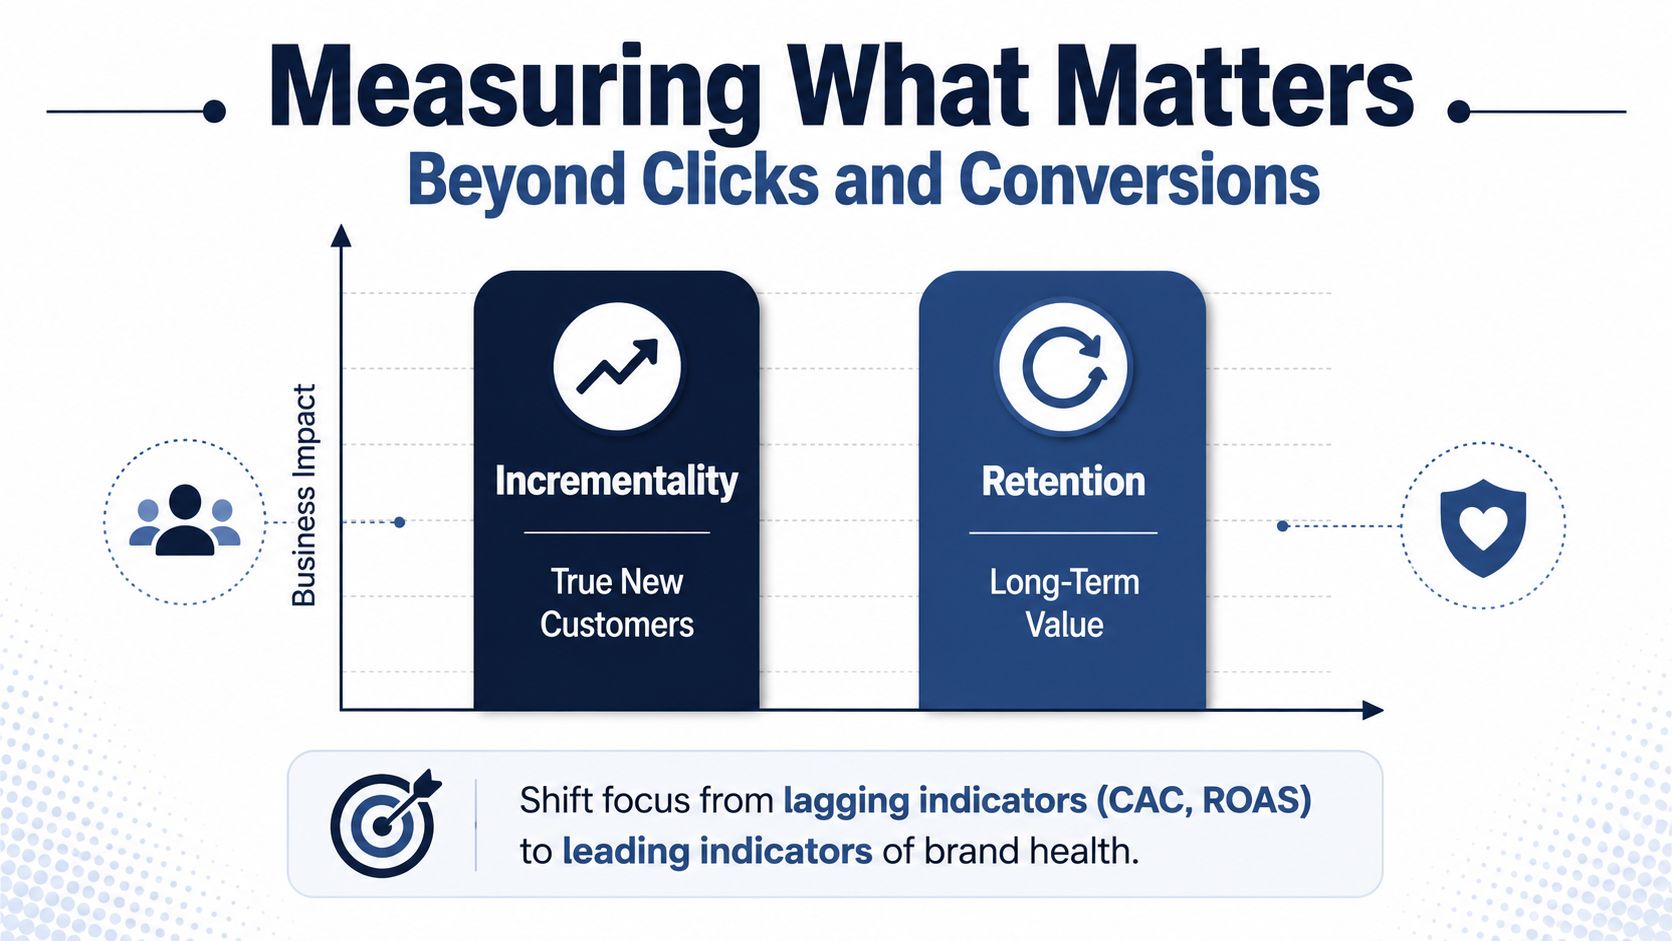
Paid efficiency belongs in the operating view. Track blended CAC, MER, new versus returning customer mix, and contribution after variable costs. These measures show spending efficiency, but they do not prove that a channel caused the purchase.
Retention depth reveals whether acquisition creates a durable customer relationship. Monitor repeat purchase behavior, subscription churn, cohort LTV at defined windows, refund patterns, and time between orders. Rising acquisition efficiency paired with weak second orders can mean the brand is buying revenue that will not compound.
Discovery breadth records how customers find you before the last click. Review branded search movement, direct traffic, organic sales, creator-driven revenue, marketplace discovery, and community mentions. Post-search discovery now matters alongside the brand website. Industry coverage also points to structured product data becoming more important as AI assistants, zero-click shopping, and marketplace-led discovery reshape the journey, according to Accio's DTC market coverage.
The research question that matters most is not “Which ad got credit?” It's “Which customer and channel create profitable repeat behavior?”
Use click data for diagnostics. Use holdouts, lift tests, cohort analysis, customer interviews, voice-of-customer research, and retention research to decide what deserves investment. A dashboard cannot settle causality by itself. The cited survey summary says respondents spent about a quarter of their time on reporting, and some spent more than 25 hours per week wrangling data. Reduce the dashboard to measures tied to a decision, then review whether those measures change product, channel, or retention priorities.
Research becomes valuable when someone converts it into a shipped change. Without an owner, the insight becomes a note in Notion, a discussion in Slack, or a reference in the next planning deck. The operating rhythm should force a decision before the finding loses relevance.
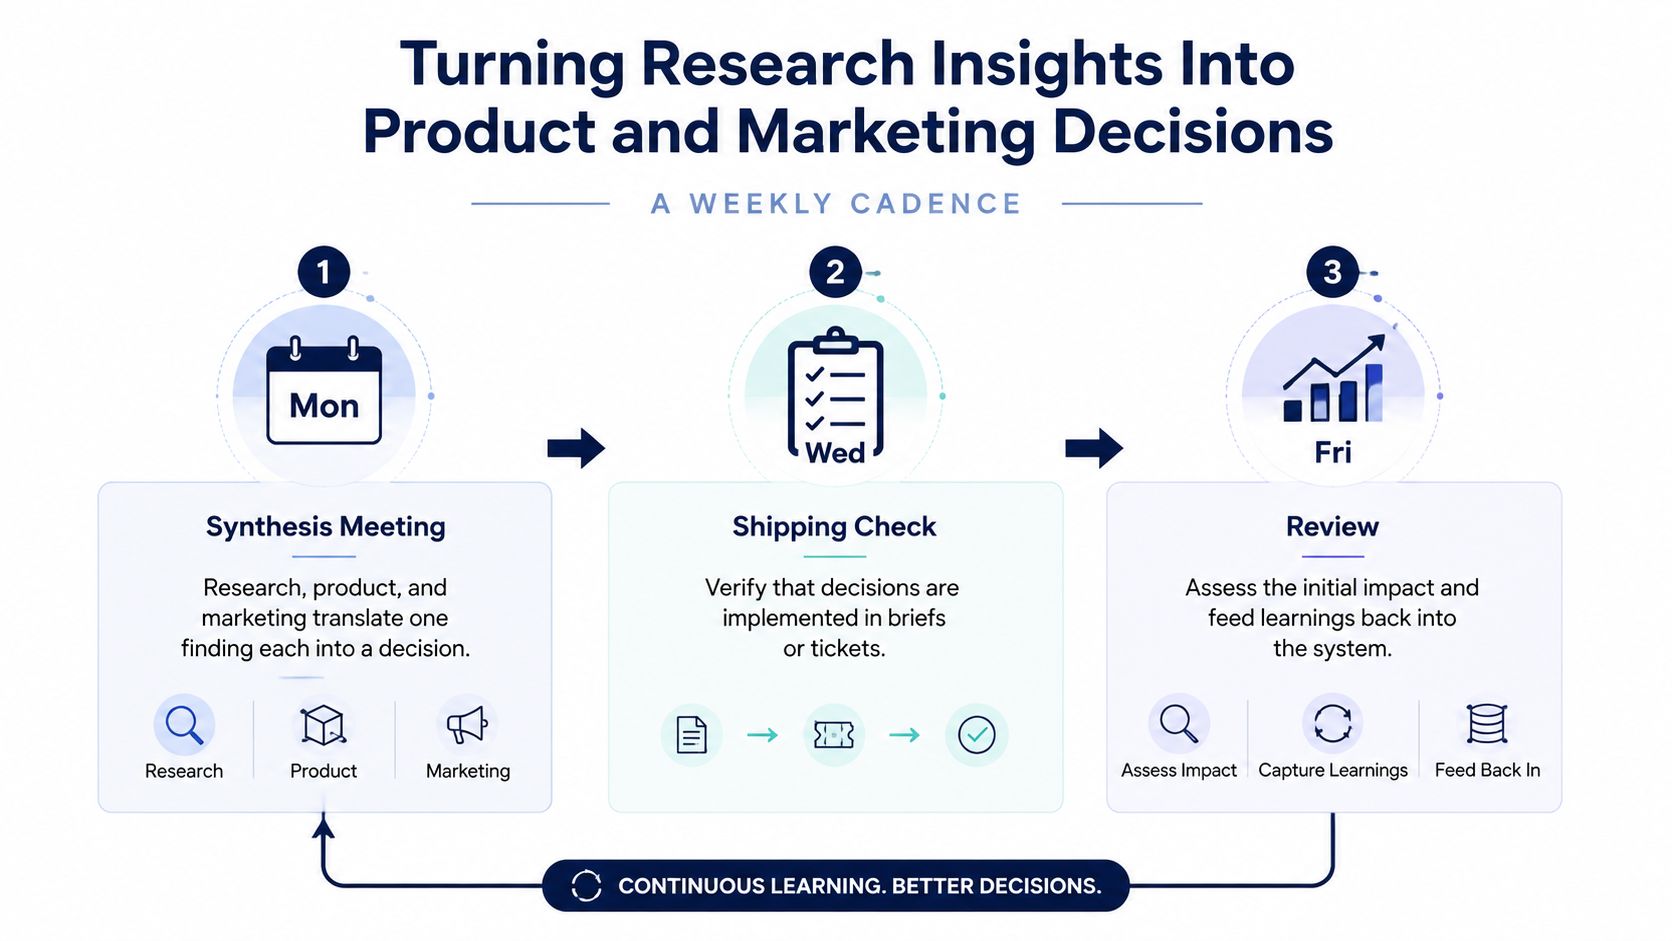
On Monday, research, product, and marketing review the strongest new finding. Each function translates one finding into one proposed action. If a customer says the product feels complicated, marketing may simplify the claim, product may revise the onboarding instructions, and customer experience may change the first follow-up message.
On Wednesday, the team checks whether the decision has shipped. The output should be a live brief, ticket, product requirement, creative task, or offer change. If nothing has moved, the issue isn't insight quality. It's ownership or prioritization.
On Friday, review the initial signal against a holdout, comparison cohort, or pre-agreed baseline. Don't ask whether the team likes the result. Ask whether the evidence supports scaling, iteration, or cancellation.
A useful insight brief contains:
Imagine a churn survey reveals that a meaningful share of lapsed customers prefers bundle pricing. Don't immediately rebuild the entire catalog. Create a bundle test, define the target segment, set a retention or reorder outcome, and decide what result would justify expanding the offer. The evidence may support a new SKU, a pricing tier, a positioning change, or no change at all.
Use the same discipline across decisions. A product finding might justify a new SKU only when the need is distinct, while a minor preference may belong in a variant. A pricing signal may support tiers when customers value different levels of access, but a single offer may be clearer when choice creates friction. A channel insight should earn more budget only when it produces qualified customers and repeat behavior, not merely cheap attention.
Million Dollar Sellers gives ecommerce founders a private setting to compare product research, competitor analysis, sourcing, listing optimization, and keyword research with peers operating across DTC, Amazon, and omnichannel brands. If your research needs to become sharper operating decisions, visit Million Dollar Sellers to learn how the community works.
Join the Ecom Entrepreneur Community for Vetted 7-9 Figure Ecommerce Founders
Learn MoreYou may also like:
Learn more about our special events!
Check Events