
Chilat Doina
October 22, 2026
Strong revenue growth is popular advice, but it can make a weak ecommerce business fail faster. Sales don't tell you whether orders leave cash behind, whether returns erase the margin, or whether you'll have money to pay for the next inventory purchase.
The number to manage is contribution profit per order after variable costs, returns, and customer acquisition. Revenue and gross margin still matter, but neither tells you whether growth is funding the business or draining it.
Two stores can report the same sales and produce completely different outcomes. One might sell high-margin products through a channel it controls, with predictable fulfillment and repeat customers. The other might rely on paid traffic, absorb high marketplace fees, and see a large share of its orders returned. Their revenue looks similar. Their cash economics don't.
Ecommerce is a significant but diverse opportunity. UNCTAD estimated that businesses across 43 economies generated almost $25 trillion in ecommerce sales in 2021, then nearly $27 trillion in 2022. Yet ecommerce's share of business turnover ranged from below 1% to approximately 30% across the economies studied. Scale alone doesn't explain profit; the business model and cost structure matter. UNCTAD's ecommerce sales research
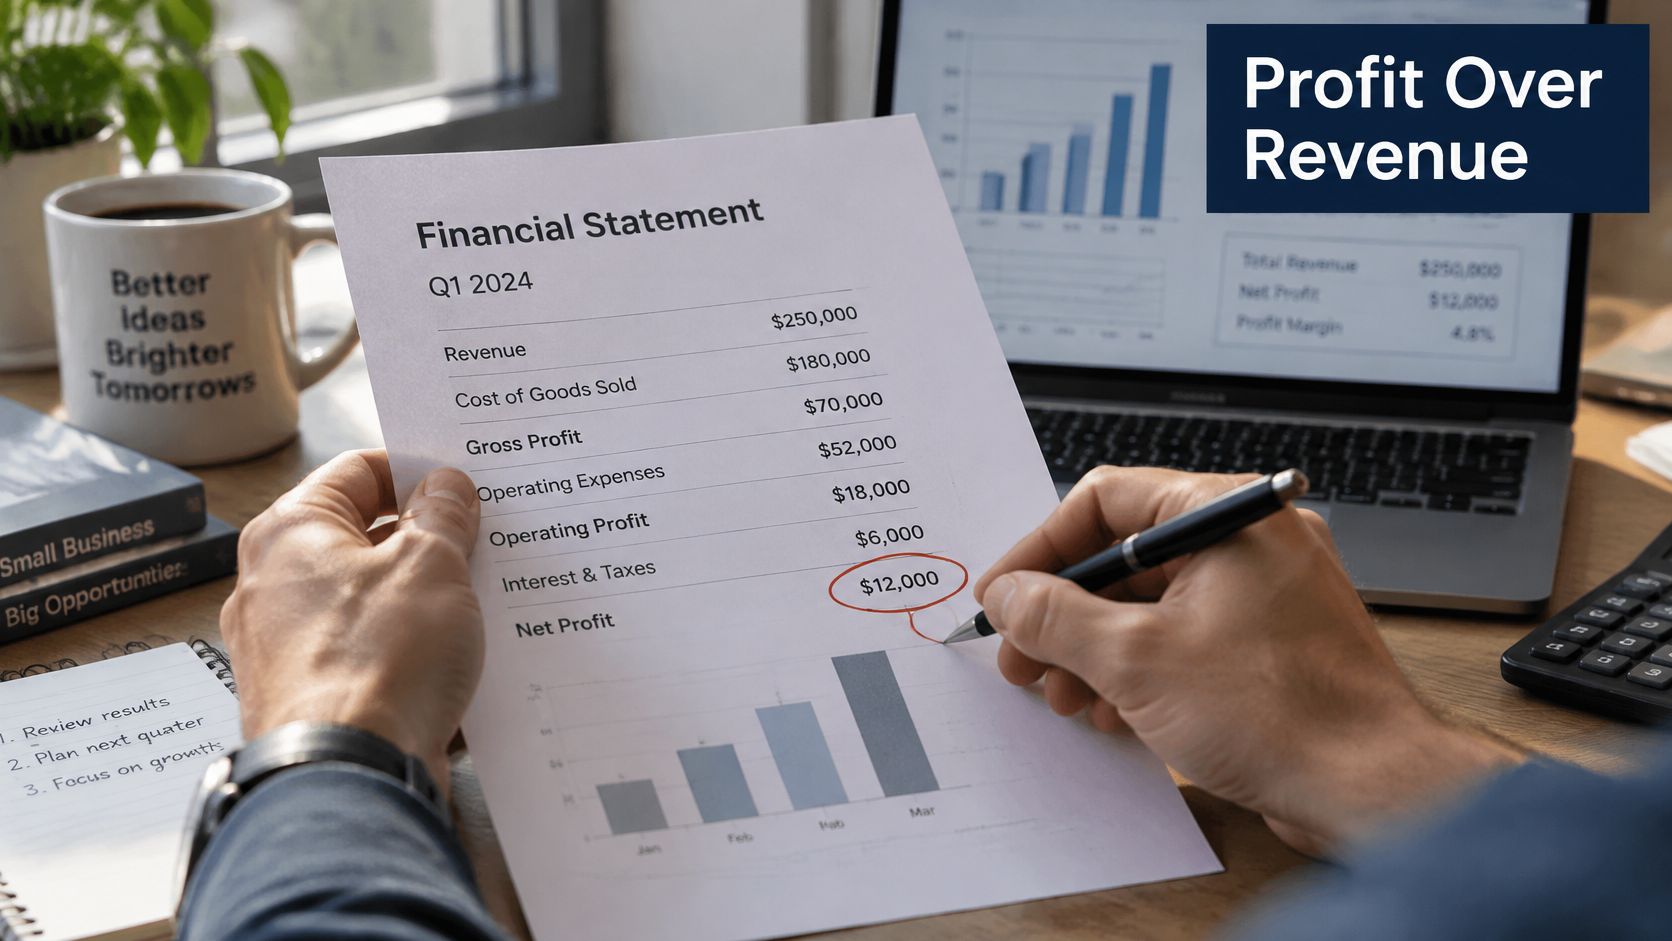
ROAS can make an ad campaign look healthy while hiding the cost of the product, shipping, marketplace fees, and returns. Gross margin can look strong before those expenses enter the calculation. Neither number answers the question a founder needs answered: After this customer's purchase and return behavior, how much does the order contribute to the business?
Build that view at the order level. Start with the money collected, subtract product cost and every variable expense tied to making, shipping, selling, and supporting the order. Account for refunds and expected return costs, then subtract acquisition cost. What remains contributes to fixed expenses and, eventually, profit.
Founder's rule: If you can't tell whether an order makes or loses money after acquisition and returns, you don't yet know whether you have a growth engine.
Fast growth can make the cash problem worse. Inventory often has to be paid for before the customer pays you, while advertising, fulfillment, and refunds keep drawing on available cash. A store can record sales and still struggle to fund its next purchase order.
Growth advice can still help, but only when it's connected to unit economics. For practical ideas on expanding marketplace sales, use this Amazon revenue growth playbook. Apply the same discipline to every channel: more sales are useful only when the added orders contribute enough to cover their costs.
Profit isn't one number. It's a stack of calculations, and each layer answers a different question. Founders get into trouble when they stop at the first layer and treat it as the final result.
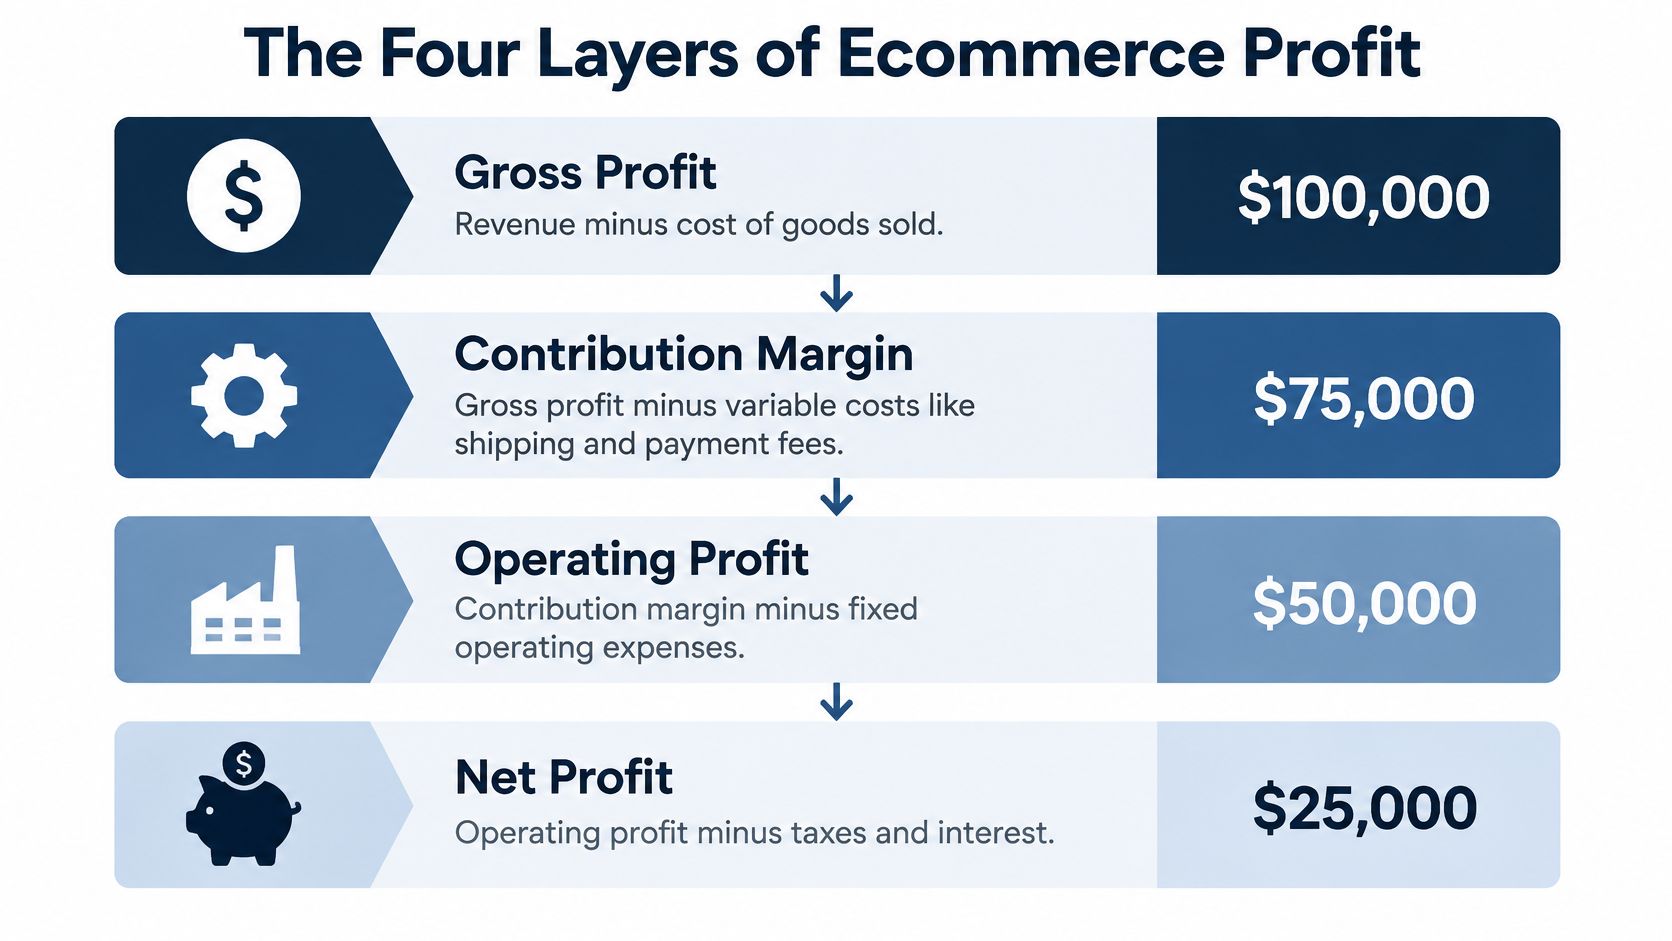
Gross profit is revenue minus the cost of goods sold. Gross margin expresses that amount relative to revenue. This shows whether the product's selling price can cover the product itself, but it doesn't show what remains after the order reaches the customer.
Contribution margin subtracts variable costs from gross profit. Depending on your business, those costs can include fulfillment, shipping, payment processing, marketplace commissions, advertising, and returns. Calculate it at the order or SKU level when you can. Blended averages can hide unprofitable products behind stronger sellers.
A useful working formula is:
Contribution per order = net revenue − product cost − fulfillment and shipping − channel and payment fees − return costs − customer acquisition cost
For more detail on setting up the calculation, follow this guide to contribution margin calculation.
Operating profit is what remains after contribution covers fixed operating expenses such as salaries, rent, and software. It helps you assess whether the business's core operations can support their overhead.
Net profit includes what remains after expenses such as interest and taxes. It's an accounting result, not a promise that the same amount is sitting in the bank. A profitable business can still face a cash squeeze if it has tied too much money up in inventory or is waiting to collect from sales channels.
That's why EBITDA isn't a substitute for cash planning. It can help compare operating performance, but it doesn't tell you when supplier bills, payroll, refunds, and inventory deposits come due. Keep the layers distinct. Use contribution margin to make order and channel decisions, operating profit to test overhead, net profit to assess the period, and cash forecasts to decide what the business can safely fund.
There isn't one contribution-margin benchmark that makes sense for every seller. Amazon, owned-site DTC, wholesale, and omnichannel businesses have different fee structures, fulfillment responsibilities, and customer relationships. Use a model-specific cost map, not somebody else's headline margin.
The table below is a comparison framework, not a set of invented benchmarks. Fill in each cost from your own settlement reports, invoices, advertising accounts, and returns data.
| Model | COGS % | Fulfillment % | Fees % | Contribution % |
|---|---|---|---|---|
| Amazon FBA | Calculate by SKU | Include Amazon fulfillment and related logistics | Include marketplace and payment charges | Net revenue less all listed costs and other variable costs |
| Shopify DTC | Calculate by SKU | Include pick, pack, and shipping | Include payment and platform charges | Net revenue less all listed costs and other variable costs |
| Wholesale | Calculate by SKU | Include freight and any buyer-specific delivery costs | Include sales commissions and payment costs | Net revenue less all listed costs and other variable costs |
| Omnichannel | Separate by channel | Allocate fulfillment by channel | Allocate fees by channel | Calculate contribution separately, then combine |
Amazon's reported results show that business mix can shift consolidated profitability. Its North America operating income rose from $14.877 billion in 2023 to $24.967 billion in 2024, while consolidated operating margin increased from 6.4% to roughly 9.5%. But consolidated results include AWS and other operations, so that margin isn't a pure measure of online retail profitability. Amazon's 2024 annual report
The lesson isn't that every seller should copy a giant company's structure. It's that channel and business mix affect profit, and you should understand what each channel contributes after its specific costs. Amazon may trade some per-order margin for marketplace reach and fulfillment infrastructure. DTC gives a brand more direct control over the customer relationship, but the brand still has to acquire and serve that customer. Wholesale has its own delivery and selling economics.
To get your bookkeeping and reporting into a more useful shape, use this guide to calculate profit and loss step by step. Then compare channels on contribution dollars, not on sales volume alone.
A positive gross margin doesn't protect a business from expensive returns, logistics, advertising, or overhead. These costs often appear in separate systems, which makes them easy to underestimate until cash is tight.
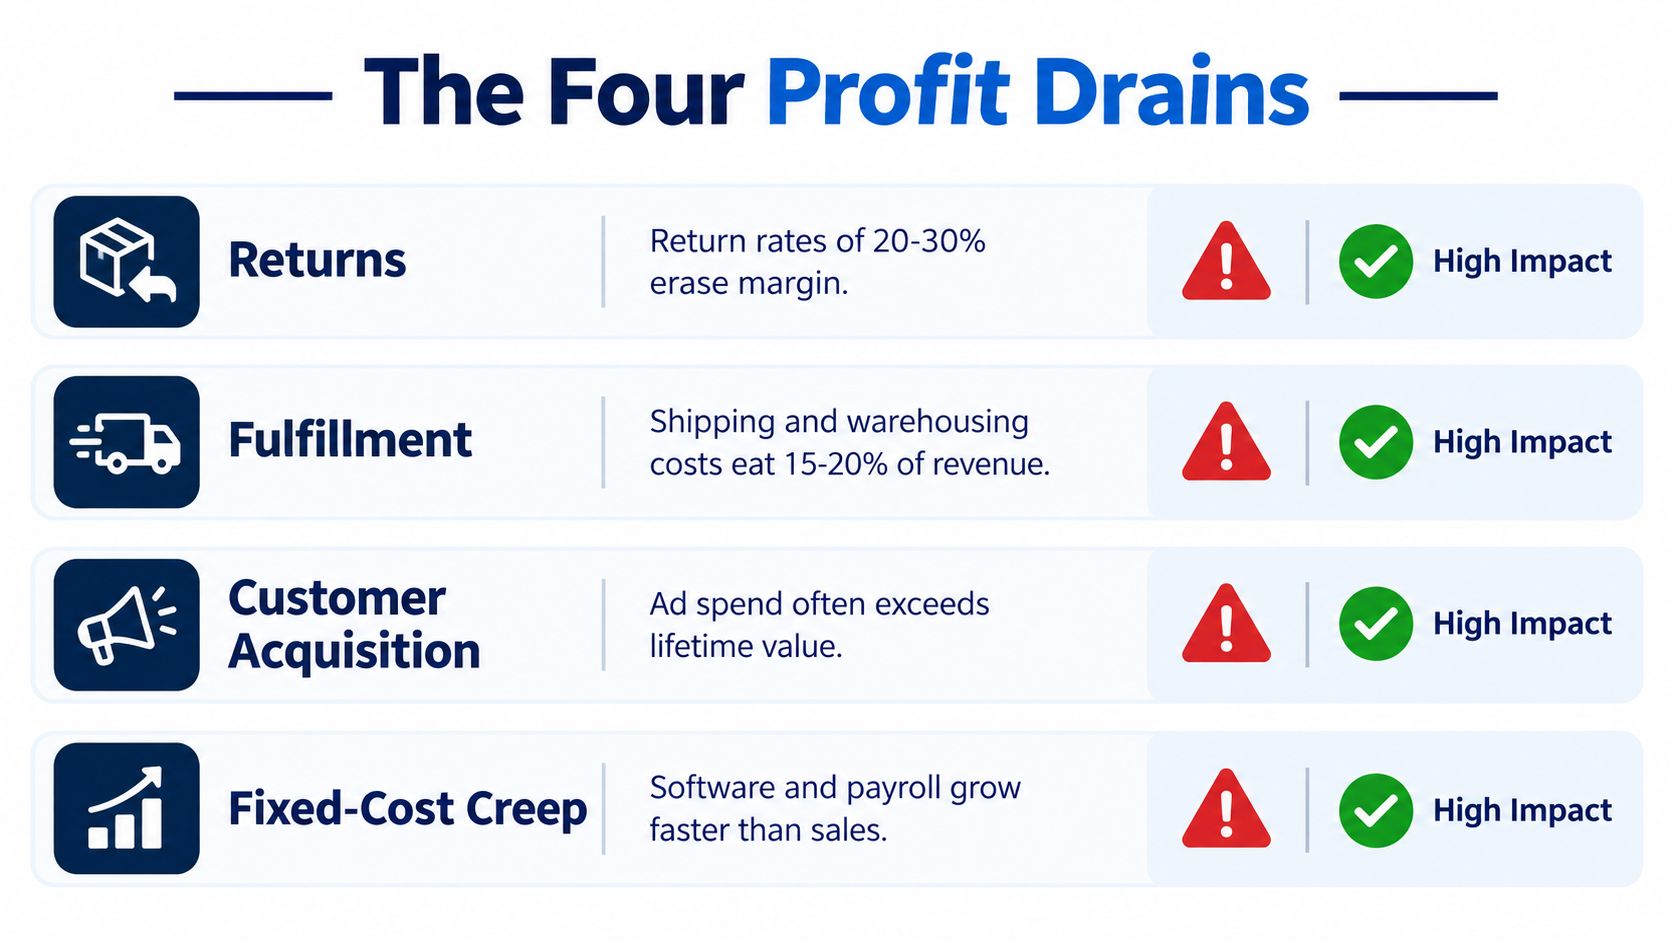
A return can undo a sale while leaving the business with outbound delivery costs, reverse shipping, inspection work, and a product that may no longer sell at full price. One benchmark reports 16.5% ecommerce return rates versus 9.7% for physical stores, and estimates that only about 48% of returned merchandise is resold at full price. Ryder's ecommerce returns benchmark
The benchmark's example shows why a seemingly profitable order can flip: a product that sells for $100, with $45 landed cost, $12 outbound fulfillment, and $8 in payment or marketplace fees, starts with $35 contribution. A return that adds $10 in reverse logistics and cuts resale value by 20% can take the order to approximately negative $42 before customer-acquisition cost.
Don't treat return rate as the whole story. Track the cost and resale outcome by product, variant, channel, and customer group. Better product information and clearer fit guidance can prevent avoidable returns. A restrictive policy isn't automatically more profitable if it also harms conversion or repeat business.
Fulfillment and shipping for physical goods commonly account for roughly 15%–25% of net sales, according to a financial-management review. A $100 order with $45 in COGS, $18 in fulfillment and shipping, $3 in payment fees, and $15 in marketplace commission contributes $19 before advertising. With a $25 acquisition cost, it loses $6. The review of ecommerce fulfillment economics
That's why dimensional weight, packaging, shipping zones, and carrier terms deserve regular attention. For inventory that sits too long, calculate the cost of carrying it rather than treating unsold stock as harmless; this inventory carrying cost guide can help structure the review.
Finally, audit acquisition and fixed costs together. Blended CAC can hide a paid channel that loses money, while extra software, agencies, and headcount can steadily raise the overhead the business must support. Watch for orders that grow while contribution shrinks, returns that cluster around specific products, and recurring expenses nobody can tie to a decision or result. If disputes are a meaningful cost for your store, review practical steps for chargeback prevention for merchants.
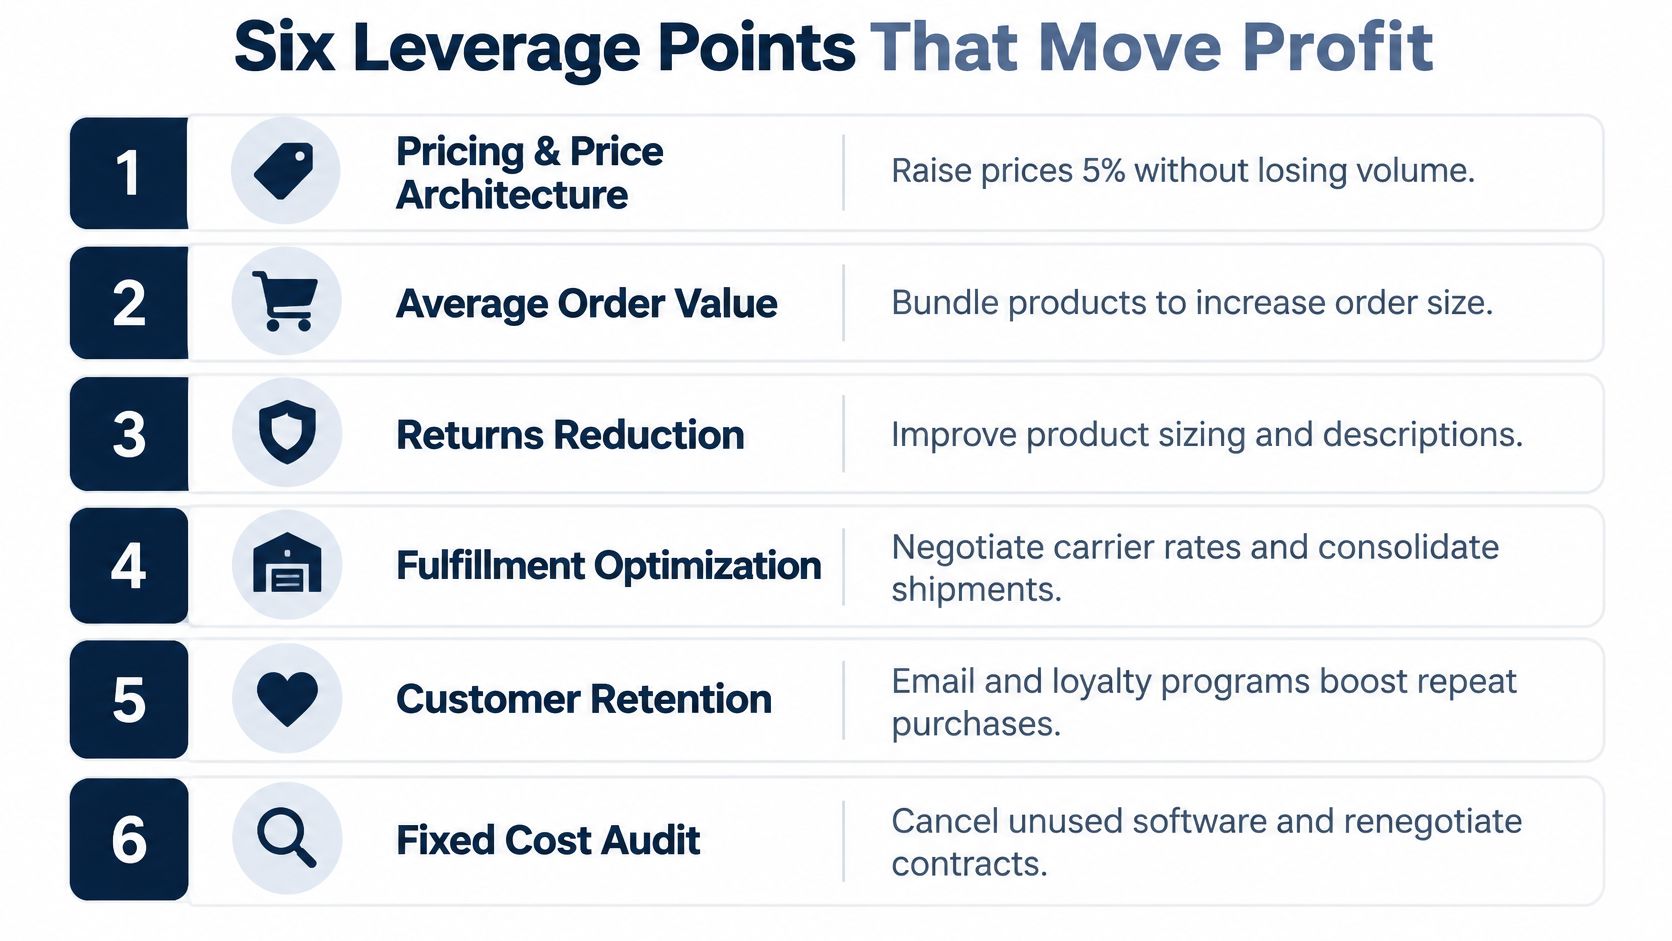
Profit improvement usually comes from fixing a few expensive decisions rather than launching a long list of disconnected tests. Choose each move based on what is cutting contribution in your own order data.
A useful test for any proposed change: Will it improve contribution per order, cash collected, or both? If you cannot explain the mechanism, activity is not a profit plan.
Work on two or three changes at a time. If returns dominate, improve product information and quality before raising ad spend. If fulfillment consumes the order, fix packaging and shipping economics before adding destinations. If paid acquisition is the problem, repair the offer and customer relationship before buying more traffic. Scaling a broken order just turns a small leak into a cash problem with better revenue charts.
For a visual overview of these decisions, watch the explainer below.
A crowded dashboard doesn't make you more informed. It often gives you more ways to avoid the uncomfortable question: which products, channels, and customer groups generate profit?
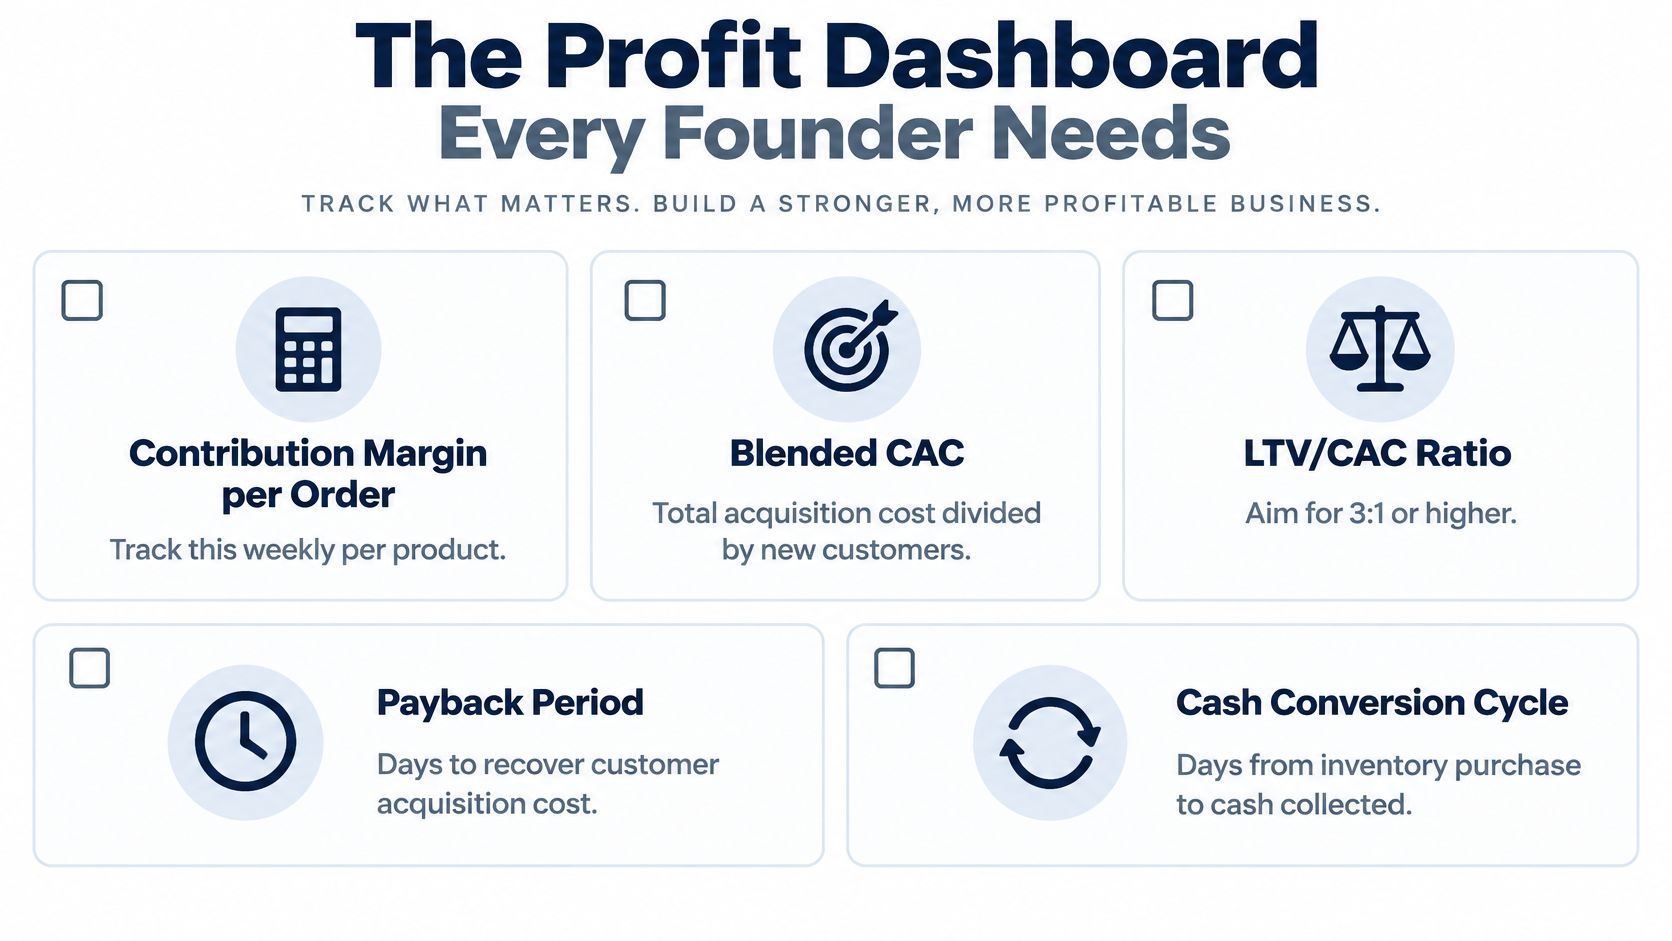
Review contribution per order by product and channel, blended CAC for new customers, and return cost by cohort. Add customer payback and cash tied up between buying inventory and collecting sales proceeds. These measures connect acquisition, fulfillment, product economics, and cash instead of isolating one attractive-looking result.
Set a review cadence that fits your business. Look at order-level changes often enough to spot a problem, then review broader patterns on a schedule that gives refunds, channel settlements, and repeat buying time to appear. Assign an owner to each metric. If nobody owns the response, the metric is decoration.
The danger of stopping at gross margin is visible in an ecommerce benchmark that reports 49.5% gross margin alongside 10.6% net margin, a gap of nearly 39 percentage points. The same benchmark reports that stores earning 20% or more net margins spent 38% less on COGS and 30% less on fixed costs than stores below 5% net margin. Treat those figures as a reason to inspect your own cost structure, not as a target that every business can copy. EcommerceFuel's ecommerce trends benchmark
For reporting that brings sales and financial performance into a clearer view, Million Dollar Sellers offers Profits and Sales Analytics dashboards for tracking profitability, fees, and related metrics. An ecommerce business intelligence guide can also help you think through how to turn sales and cost data into decisions.
Start with the costs most likely to be draining cash, not the projects that are easiest to announce. The sequence below is a working plan; adjust it to the bottleneck your order data reveals.
Rebuild contribution per order by product and channel using actual fees, fulfillment, acquisition, and return costs. Audit the products and campaigns that look strong in the sales dashboard but weak after those expenses. Review pricing, refunds, recurring software, and promotions, then pause spending that has no credible path to contribution.
Work on the structural costs you've identified. Revisit bundles and shipping thresholds, address preventable returns, and ask carriers or fulfillment providers to review the parts of the cost structure that affect your specific orders. Decide which channels deserve more attention based on what they contribute, not the sales volume they report.
Review repeat purchasing and cash tied up in inventory. Remove or rework SKUs that consistently fail to cover their variable costs, and right-size fixed expenses against the business you are running. Keep the changes that improve contribution and cash; stop the ones that only make revenue charts look better.
Growth creates profit when added orders cover their variable costs, help pay fixed expenses, and leave enough cash to operate. If growth relies on orders that lose money or inventory you can't afford to replenish, pause the push and fix the economics first.
Million Dollar Sellers is an invite-only community where ecommerce founders share operating insights through peer discussions, events, and mastermind calls. If you're ready to compare your profit decisions with experienced Amazon, DTC, and omnichannel operators, visit Million Dollar Sellers.
Join the Ecom Entrepreneur Community for Vetted 7-9 Figure Ecommerce Founders
Learn MoreYou may also like:
Learn more about our special events!
Check Events