


Stay Updated with Everything about MDS
Thank you! Your submission has been received!
Oops! Something went wrong while submitting the form.
Chilat Doina
September 18, 2025
Analyzing sales data isn't just about crunching numbers. It’s about taking a jumble of raw data, cleaning it up, and using the right tools—whether that's a trusty Excel spreadsheet or a powerful Tableau dashboard—to uncover the story hidden inside.
This whole process transforms what looks like a confusing mess of figures into a clear roadmap for smarter business decisions and sustainable growth.
Before you even think about opening a pivot table or building a dashboard, it’s worth taking a step back to understand why this is so critical. Analyzing your sales data isn’t some boring reporting task you have to check off a list. For any e-commerce business, big or small, it's the engine that powers real, strategic growth.
This is the point where you stop relying on gut feelings and start making informed, data-driven decisions that actually get results. It's about finding the narrative behind your numbers—the one that explains customer behavior, product performance, and market shifts.
Good analysis turns that raw data into powerful business intelligence. Instead of just seeing what you sold, you finally learn why you sold it. That deeper level of understanding is what helps you answer the questions that directly impact your bottom line.
The goal is to move beyond simple reporting. True analysis uncovers the 'why' behind the 'what,' equipping you with the insights needed to replicate successes and correct failures. This proactive approach is a cornerstone of effective data-driven decision making.
Of course, understanding your own data is only half the battle. To really drive growth, you need to see how you stack up against the outside world.
By exploring various strategies to analyze market trends, you can put your own sales performance into context. This helps you spot shifts in demand early and adjust your strategy before your competitors even know what’s happening.
The e-commerce world is growing at a wild pace, which makes data analysis more important than ever. Global e-commerce sales are expected to hit $7.5 trillion in 2025—that’s a huge jump from $5.7 trillion in 2023. With roughly 85% of consumers worldwide now shopping online, the sheer volume of data is staggering. For those who know how to read it, the opportunity is massive.
The insights you pull from your sales data are only as reliable as the data itself. Before you can even think about spotting trends or making big strategic moves, you have to get your hands dirty and make sure that data is accurate, consistent, and complete.
Think of it like building a house. If the foundation is cracked and uneven, everything you build on top of it will be unstable. The same goes for your data.
For any modern e-commerce brand, this process kicks off by pulling information from all your different sales channels. And let's be honest, that usually means wrangling data from a bunch of disconnected sources.
Your first job is to get everything in one place. You need to create a single source of truth, a central hub for all your analysis.
This chart breaks down the basic flow from just grabbing raw numbers to having a validated dataset you can actually trust.
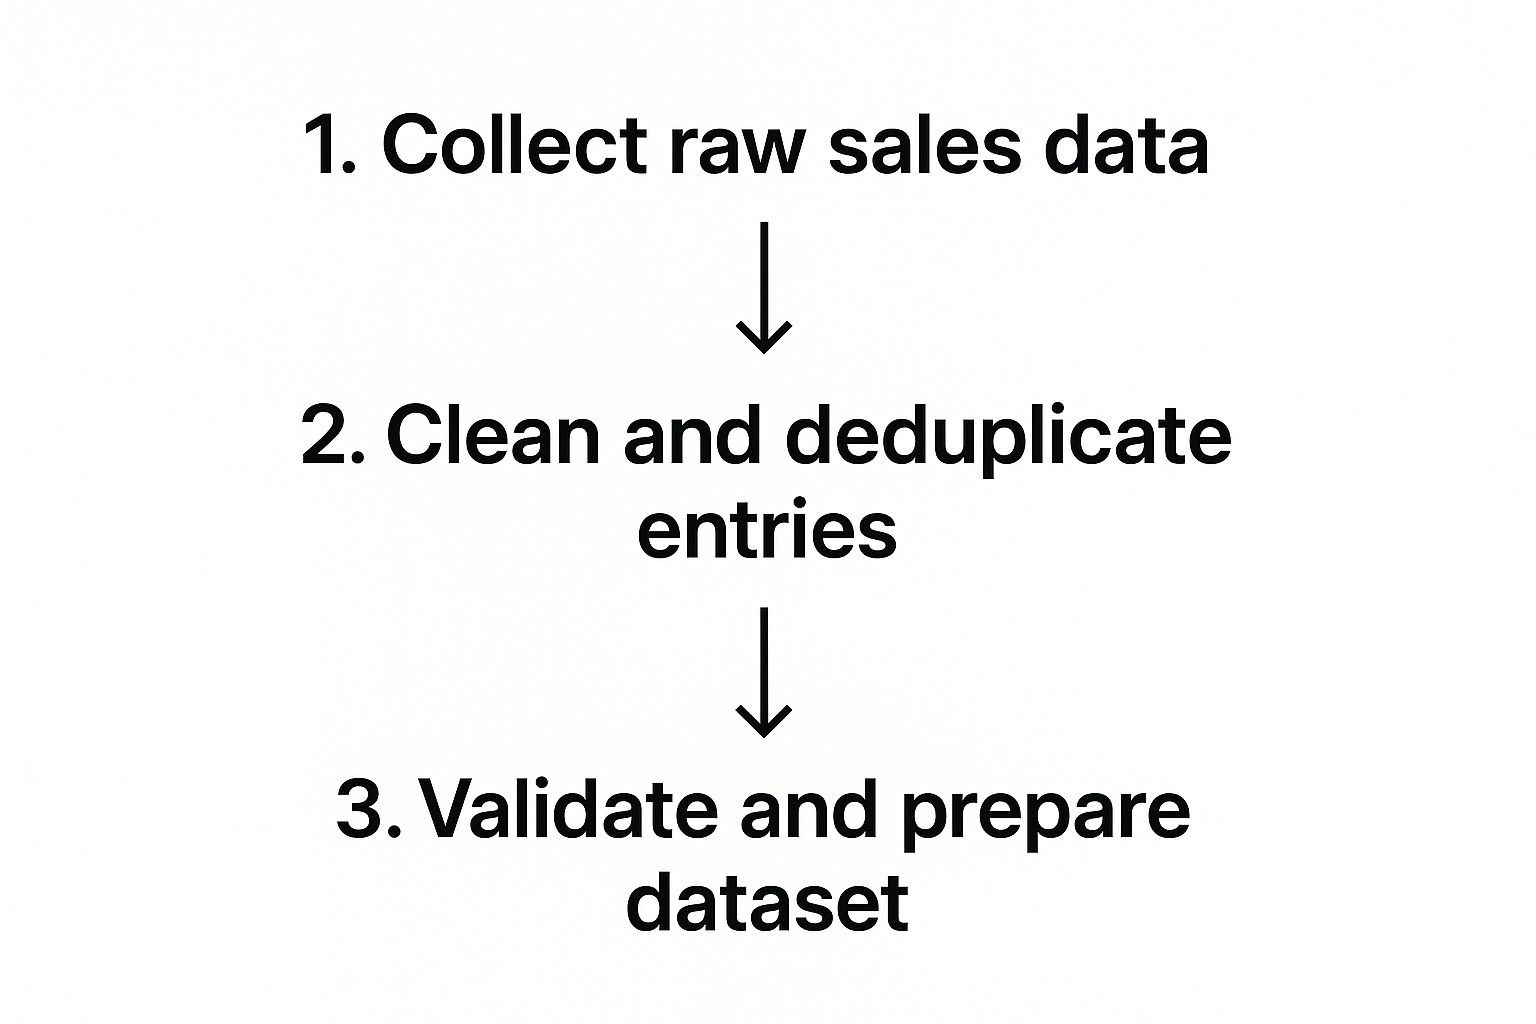
As you can see, the cleaning and deduplication steps are what turn that messy, raw data into a reliable asset you can build on.
Once you've corralled all your data into one place, the real work begins. Data cleaning—or "data scrubbing"—is all about fixing or flat-out removing incorrect, corrupted, or duplicate data. It’s a step people often want to skip, but doing so almost always leads to flawed conclusions.
Here’s a real-world example: say you're merging sales data from your online store and a recent pop-up shop. You might find a customer named "Jon Smith" in your online records and "Jonathan Smith" from the pop-up. Without cleaning, your analysis would treat them as two different people, completely throwing off crucial metrics like customer lifetime value.
A clean dataset is the bedrock of trustworthy sales analysis. Taking the time to standardize formats, correct inaccuracies, and remove duplicates prevents you from making critical business decisions based on faulty information.
To build that trustworthy dataset, you'll want to focus on a few key actions. These tasks tackle the most common problems you’ll find in raw sales info.
By working through these issues methodically, you create a pristine dataset. This foundational work ensures that when you start analyzing your sales data, the story it tells you is both clear and, most importantly, true.

With your data cleaned up and ready to go, the next big decision is what tools you'll use to actually make sense of it all. You want something that fits your skill level and what you're trying to achieve—no need to get bogged down by overly complex software or, worse, held back by something too basic.
Don't worry, you don't need a supercomputer to get started. For many e-commerce sellers, the journey begins with something they already have.
You'd be surprised how much you can get done with good old Microsoft Excel or Google Sheets. These aren't just for lists and basic math; their real power for sales analysis comes from features like pivot tables.
A pivot table can take a massive, intimidating list of thousands of sales transactions and summarize it in seconds. With just a few clicks, you can instantly see total revenue by product, break down sales by region, or even see how a specific marketing campaign performed. It’s a game-changer for answering critical questions without needing to write a single line of code.
Once your sales data starts to grow, or you find yourself wanting more dynamic and visual ways to explore it, Business Intelligence (BI) tools are the logical next step. Platforms like Tableau, Power BI, and Looker are built for this exact purpose.
These tools hook directly into your data sources, letting you create interactive dashboards. Imagine a live chart that tracks your daily sales against your monthly goal, where you can filter everything by customer type or traffic source with a click. This visual-first approach makes it so much easier to spot trends, weird outliers, and hidden opportunities.
The right tool transforms raw data into a story. While spreadsheets are great for initial summaries, BI platforms excel at creating interactive narratives that allow for deeper, more intuitive exploration of your sales performance.
The market for these tools is exploding as more businesses realize they need to be data-driven. The global data analysis tools market was valued at USD 48.56 billion in 2023 and is projected to skyrocket to USD 140.47 billion by 2032. This incredible growth just shows how essential these platforms have become for wrangling huge amounts of sales data from all over the place. You can read more about the data analysis tools market on dataintelo.com.
Before diving in, it's worth comparing some of the top options to see what fits your specific needs.
This table breaks down some of the most popular sales analysis tools. Think about what you need to accomplish and your current skill level to find the best match.
Ultimately, there's no single "best" tool—only the best tool for you and your business right now.
For businesses sitting on mountains of data or those asking highly specific analytical questions, sometimes you need to bring in the heavy hitters.
Many e-commerce brands are also weaving specialized AI solutions into their workflow to automate parts of their analysis. If you're curious, you can explore some of these in our guide to AI tools for ecommerce.
Choosing your toolkit is all about balancing power with practicality. Start simple with what you know, and scale up as your confidence—and your data—grows.
Alright, you've got a clean dataset and the right tools fired up. Now comes the fun part: figuring out which numbers actually tell you something useful. It's easy to get lost in a sea of metrics, but trust me, most of them are just noise.
The secret is to focus on the handful of metrics that tie directly to your profitability, operational efficiency, and overall growth. This is where we stop just counting revenue and start asking the right questions about the health of your business. We're digging deeper to understand not just what you sold, but how you sold it and what each customer is really worth.
First up, the big one: Sales Growth. This is your 30,000-foot view, telling you how fast your revenue is climbing (or falling) over a set period. It's the ultimate gut check on your business's momentum.
The calculation is pretty straightforward:
(Current Period Sales - Previous Period Sales) / Previous Period Sales * 100
So, if you pulled in $80,000 last quarter and hit $100,000 this quarter, your sales growth is a solid 25%. This number is your North Star for setting realistic goals and knowing if your strategies are actually moving the needle.
Growth is great, but profitable growth is what keeps the lights on. That means you need to know exactly how much it costs to land a customer and how much they're worth to you over time. This is where Customer Acquisition Cost (CAC) and Customer Lifetime Value (CLV) become your best friends.
The real magic happens when you look at these two together. For a healthy, sustainable business, your CLV needs to be way higher than your CAC. I always tell people to aim for a CLV:CAC ratio of at least 3:1.
Think about it: if you spend $50 to acquire a customer who only ever makes a single $60 purchase, you're technically "growing," but you're not building a business that will last. Nailing this ratio is everything.
Beyond the customer, you have to look inward at how smoothly your own sales engine is running. Two metrics I always keep an eye on are Average Deal Size and Sales Cycle Length.
Your Average Deal Size is as simple as it sounds: Total Revenue / Number of Deals Closed. Watching this tells you if your upselling efforts are working or if your average transaction value is starting to slip. If this number is climbing, you're doing something right.
The Sales Cycle Length is the average time it takes to turn a prospect into a paying customer. A shorter cycle means your operation is lean and efficient, which frees up your team to chase down new leads. If this number starts creeping up, it’s a sign that there's a bottleneck somewhere in your funnel that needs fixing.
Ultimately, all of these numbers roll up into your bottom line. To get the full picture of your profitability, you have to get a handle on your margins. A great next step is to dive into our guide on the profit margin calculation formula to really connect the dots.
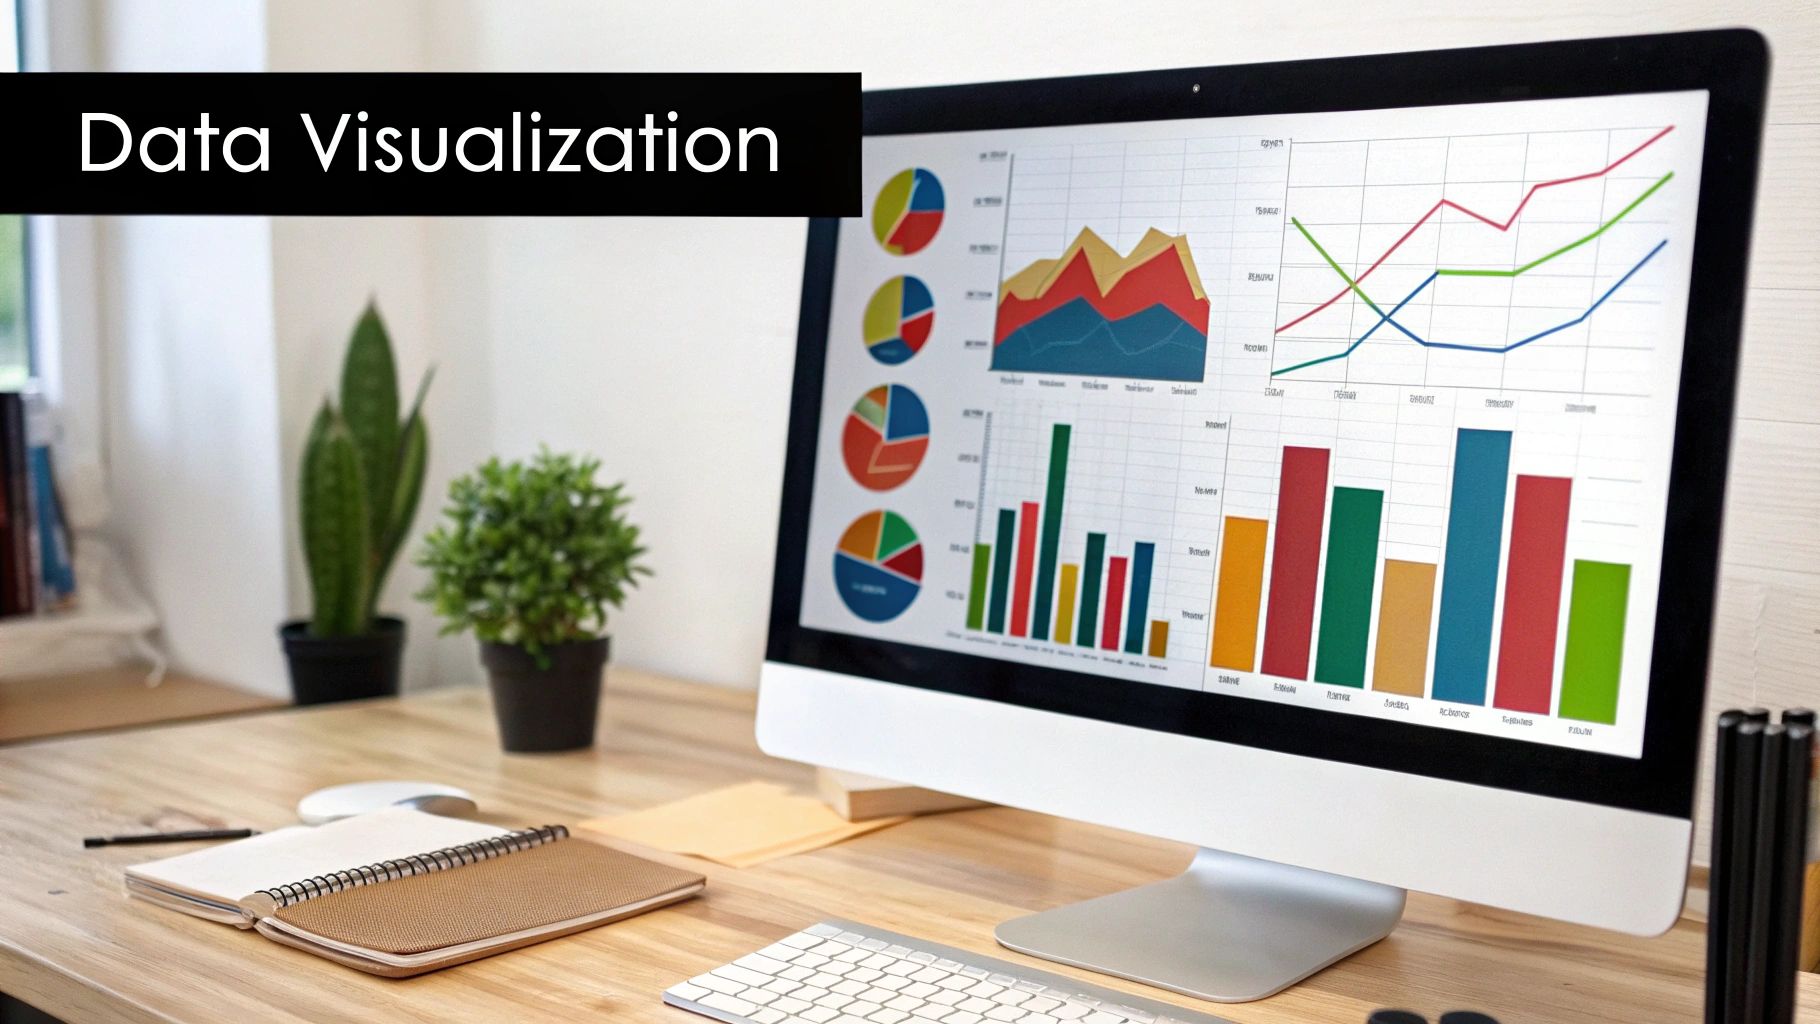
Let's be honest, a spreadsheet with thousands of rows of sales data is more likely to give you a headache than a brilliant insight. Raw numbers just don't tell a story on their own.
This is where data visualization comes in. It’s the art of turning all those clean, organized numbers into compelling visual stories that anyone—even stakeholders with zero technical background—can actually understand. This isn't just about making pretty charts for a report. It's about uncovering the hidden patterns, trends, and outliers that are nearly impossible to spot in a simple table of figures. A good visual immediately tells you what's working and, more importantly, what isn't.
The secret to great visualization is matching the right type of chart to the question you're trying to answer. If you use the wrong one, you can end up with a visual that's just as confusing as the original spreadsheet.
Here are a few of my go-to options for e-commerce sales analysis:
Visualization turns abstract data into a tangible narrative. It's the bridge between raw numbers and strategic action, allowing you to see the forest for the trees and make quicker, more confident decisions.
A single chart is great, but a full dashboard is where the magic really happens. A well-built dashboard pulls together multiple visualizations to give you a single, at-a-glance view of your business's health.
Imagine opening up one screen that tracks your daily sales against your monthly target, shows you which ad campaigns are killing it, and monitors inventory levels for your top products. That’s the power of a dashboard.
The ability to analyze sales data has been absolutely supercharged by advanced analytics and AI. The global data analytics market, valued at $64.99 billion in 2024, is projected to rocket to $402.70 billion by 2032. This isn't just hype; it's driven by businesses getting real results. Amazon, for example, reported a 35% jump in customer retention, a success largely chalked up to its deep data analysis.
By visualizing your key metrics, you’re not just reporting on what already happened. You're creating a command center to steer your business into the future. For more perspectives on getting meaning from your data, check out the latest insights from other industry experts.
Diving into your sales data for the first time? It's natural to have a few questions. I've been there. You're staring at a spreadsheet, wondering how to turn all those numbers into a real-world strategy. Nailing these fundamentals is how you build the confidence to trust the story your data is telling you.
Let's walk through some of the most common roadblocks I see e-commerce owners and new analysts hit. Consider this your cheat sheet for getting past those initial sticking points.
There’s no magic number here. The right frequency really comes down to the rhythm of your own business. The trick is to find a schedule that helps you spot trends and make smart moves without getting bogged down by every minor daily dip or spike.
If you're running a fast-paced e-commerce store, a daily or weekly check-in on your core metrics—like conversion rates and ad spend—is a must. But for a B2B business with a six-month sales cycle? A monthly or quarterly review of your sales pipeline and deal velocity is way more practical.
The key is to set a consistent schedule that makes sense for your business model. That way, you're acting on insights when they actually matter.
Easy. "Analysis paralysis." It’s a classic trap. You get so lost in the pivot tables and fancy dashboards that you completely forget the whole point: to make a decision and do something. Your goal isn't to create endless, picture-perfect reports that just sit in a folder. It's to find an insight you can act on.
To sidestep this, constantly ask yourself "So what?" every time you uncover something interesting. What specific action does this insight point to? If you don't have an answer, you might be chasing a vanity metric. Action is the only thing that proves your analysis was worthwhile.
The purpose of analyzing sales data isn't just to know more; it's to do more. Every chart and every metric should ultimately guide a decision—whether it’s adjusting your marketing budget, discontinuing a product, or retraining your sales team.
You absolutely can. Don't let anyone tell you that you need some expensive, enterprise-level software to get started. Some of the most powerful tools out there are either free or incredibly affordable, putting real data analysis within anyone's reach.
Here are a couple of my go-to's for anyone on a budget:
Honestly, your understanding of data cleaning and what the key metrics actually mean is far more valuable than the price tag on your software. Focus on building your skills first. You can always upgrade your tools as your business—and your data—gets bigger.
At Million Dollar Sellers, our members move past the basics and into the high-level strategies that scale 7- and 8-figure brands. If you're ready to learn from the best in e-commerce, see if our exclusive community is right for you. Find out more at https://milliondollarsellers.com.
Join the Ecom Entrepreneur Community for Vetted 7-9 Figure Ecommerce Founders
Learn MoreYou may also like:
Learn more about our special events!
Check Events.svg)
.svg)
.svg)

.svg)