Chilat Doina
September 4, 2026
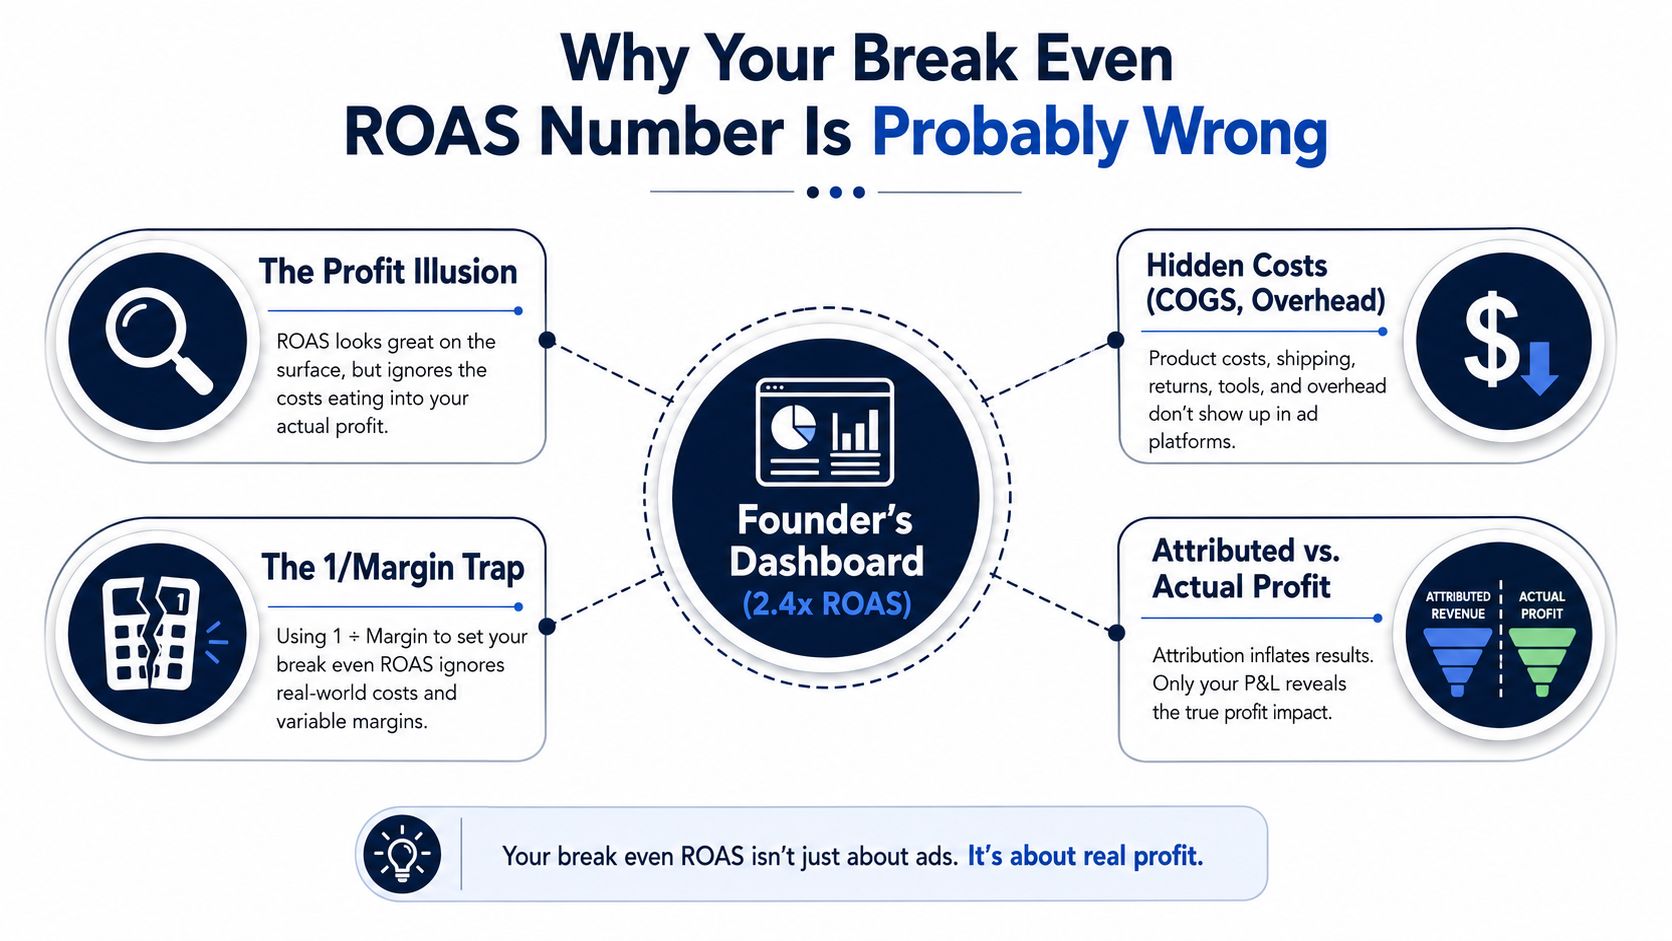
A founder opens Meta Ads Manager and sees 2.4x ROAS. The dashboard says the campaigns are working, but the bank balance tells a less comfortable story. After fulfillment, payment fees, discounts, returns, and the next inventory payment, the question isn't whether the ads generated revenue. It's whether they generated enough contribution profit to justify the spend.
That's where many break-even models fail. The shortcut, break-even ROAS = 1 ÷ margin, is directionally useful, but only when “margin” includes every variable cost attached to the order. A headline gross margin often leaves out the costs that make paid acquisition expensive in practice.
A reliable model starts with contribution margin, separates fixed overhead from per-order economics, and then tests platform-reported performance against blended results and incrementality. The calculation is simple. Building the right denominator is the work.
The founder with the 2.4x Meta ROAS has a familiar problem. The campaign dashboard attributes revenue to the ads, yet the business still feels cash-starved. The operator checks the product margin, divides one by that percentage, and concludes the account is safely profitable.
That conclusion can be wrong because the margin used in the shortcut often reflects only product cost. The break-even point moves when the operator adds payment processing, pick-and-pack, packaging, shipping, returns, discounts, marketplace fees, and other costs that scale with each order. A campaign can look healthy against gross margin while failing to produce enough dollars after the complete variable-cost stack.
Practical rule: If a cost rises when an order is placed, it belongs in the first version of your break-even model.
Fixed costs create a second blind spot. Salaries, software, rent, agency retainers, and other overhead don't belong in the per-order contribution margin formula, because they don't change directly with one sale. But the business still has to cover them before paid acquisition creates owner profit. That means the mathematical break-even point is a floor, not an operating target.
The third issue sits inside the ad platform. Meta, Google, Amazon, and TikTok each apply their own attribution rules, conversion windows, and reporting logic. View-through conversions, delayed conversions, returning customers, and overlapping platform claims can make reported ROAS look stronger than the revenue that paid media caused.
The practical fix is to calculate break-even ROAS from contribution margin after every variable cost, then compare the result with blended performance. Independent analysis from NIQ on incrementality in retail media argues that marketers need to measure additional sales caused by advertising, not only sales credited by an attribution system.
Start with the economics of one order. Let revenue per order be the amount the business keeps as sales revenue after removing discounts, refunds, and charges that don't fund advertising. Then list every cost that increases because that order exists.
The core calculation is:
Contribution margin dollars = revenue per order − total variable costs per order
Total variable costs can include:
Convert the dollar contribution into a percentage:
Contribution margin % = contribution margin dollars ÷ revenue per order
Then calculate:
Break-even ROAS = 1 ÷ contribution margin %
If the full variable-cost load is 46%, the contribution margin is 54%, producing a break-even ROAS of approximately 1.85x. This calculation is more accurate than using gross margin alone because the advertising spend must be covered after the complete variable cost stack, not merely after product cost. The calculation method is also outlined in this break-even ROAS calculator guide.
Contribution margin answers a narrow question: how much of each revenue dollar remains available to pay for advertising and fixed business expenses? Net margin answers a broader question about the entire company after overhead, taxes, interest, and other expenses.
Don't mix the two. Excluding fixed costs from the per-order threshold keeps the unit economics honest, while the operating target can add a buffer for overhead and profit. For a deeper explanation of the underlying metric, see what contribution margin means for ecommerce operators.
| Line Item | Example Cost ($) | Included in CM? | Notes |
|---|---|---|---|
| Product COGS | Product-specific | Yes | Use landed cost where applicable |
| Payment processing | Order-specific | Yes | Include percentage and fixed charges |
| Fulfillment | Order-specific | Yes | Pick, pack, and handling belong here |
| Packaging | Order-specific | Yes | Include boxes, inserts, and labels |
| Returns reserve | Order-specific estimate | Yes | Reflect actual refund exposure |
| Discount | Revenue reduction | Yes | Use realized selling revenue |
| Salaries and rent | Fixed | No | Handle through the target ROAS buffer |
| Ad spend | Campaign cost | No | This is what break-even ROAS measures |
Consider a $45 supplement bottle sold through Shopify. The base case has $9 COGS, $1.40 payment processing, $4.50 pick-and-pack, $0.80 packaging, a $1.13 returns reserve, and an average $2.25 discount. Those costs leave approximately $25.92 in contribution margin, or roughly 57.6%, producing a break-even ROAS near 1.74x.
The useful lesson isn't the product category. It's how quickly the threshold changes when a cost lever moves. A brand that calculates only from the product invoice will understate the revenue required to fund each ad dollar.
| Scenario | Discount | Returns | Contribution Margin ($) | Contribution Margin (%) | Break Even ROAS (1/CM%) |
|---|---|---|---|---|---|
| Base case | $2.25 | $1.13 reserve | $25.92 | 57.6% | 1.74x |
| Lean setup | None | Lower reserve | Not specified | 68% | 1.47x |
| Heavy promotion | 20% | 6% | Not specified | 44% | 2.27x |
The lean setup benefits from removing the discount and reducing return exposure. Its 68% contribution margin lowers the break-even threshold to 1.47x. During the heavy promotion period, a 20% discount and 6% returns reduce the margin to 44%, pushing break-even ROAS to 2.27x.
Don't recalculate only when the quarterly reporting pack is prepared. Rebuild the model whenever pricing, discount cadence, fulfillment rates, shipping terms, or customer return behavior changes.
A campaign at 2.0x can be above break-even in the lean scenario and below it during the heavy-promotion scenario. The ad account didn't suddenly become irrational. The product economics changed.
Break-even ROAS tells you where attributed contribution dollars cover ad spend. It doesn't pay fixed overhead, absorb an unexpected refund spike, or protect the business from shipping and fee changes. Treating it as the final target leaves no room for operating risk.
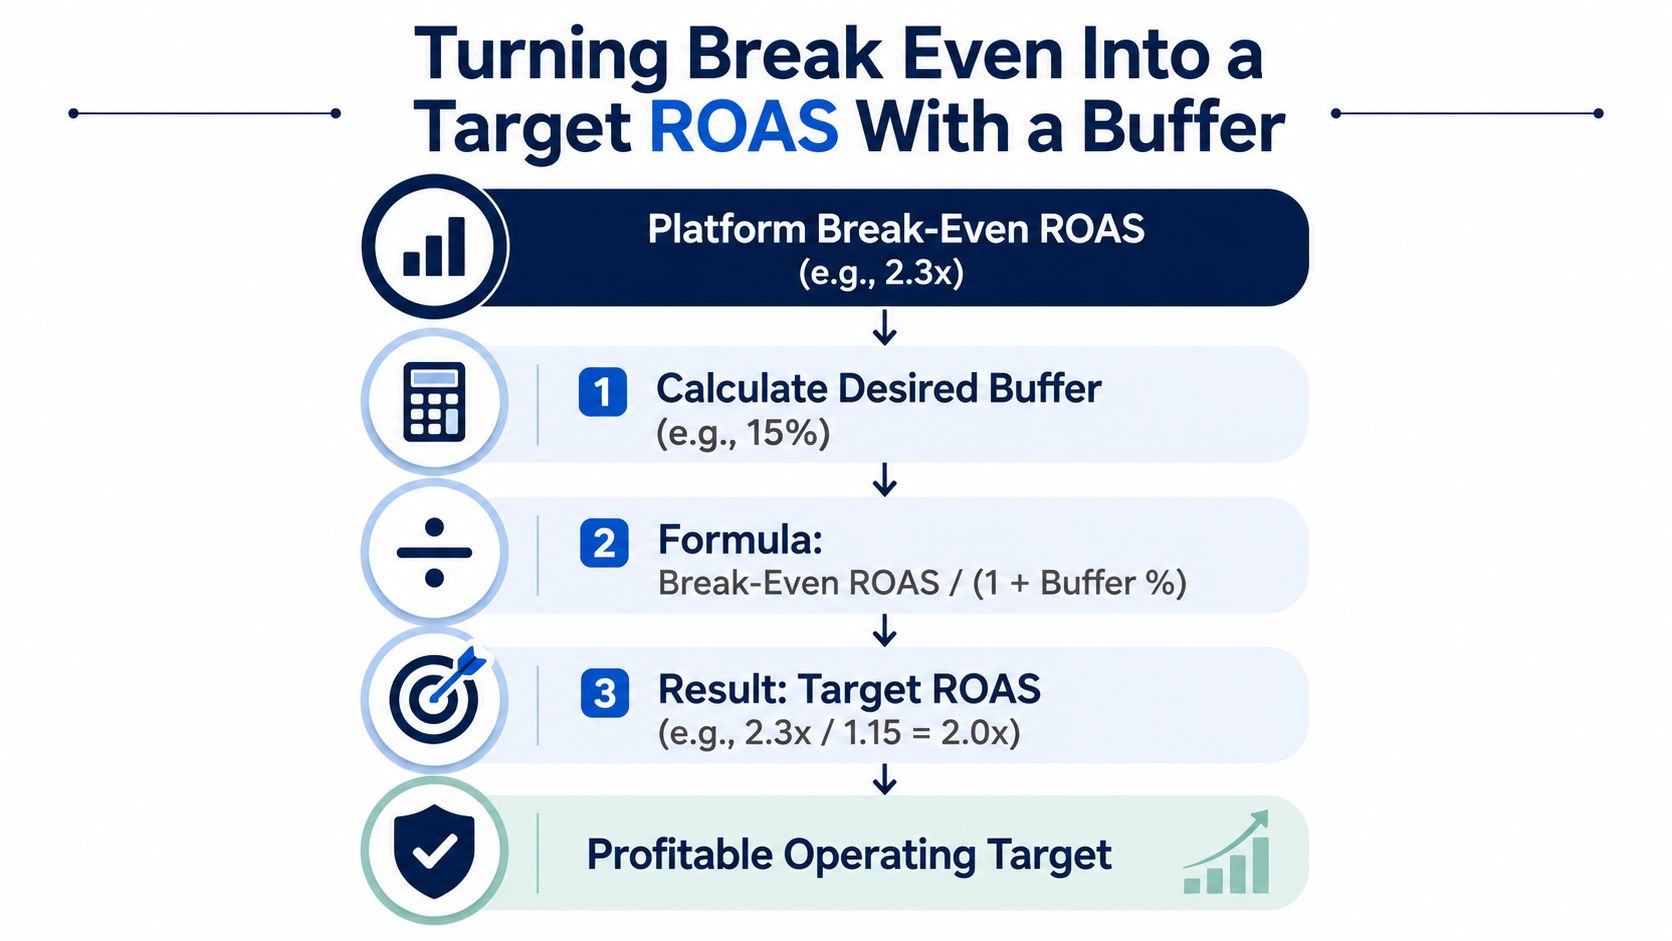
A practical buffer converts the floor into a target. The calculation is:
Target ROAS = break-even ROAS ÷ (1 + buffer)
For a break-even threshold of 2.5x, a 25% buffer produces a target of 2.0x. A 50% buffer produces approximately 1.67x under this buffer convention. The important point is to define the convention clearly and use it consistently in your planning sheet.
Guidance for ecommerce calculators commonly recommends aiming 30% to 50% above break-even once fixed overhead and profit are considered, while using a 30-to-90-day average for AOV and cost inputs to reduce the influence of noisy orders. The same guidance warns that a negative gross profit per order can't be repaired by any ROAS level, and that return reserves matter especially in categories such as apparel and beauty. See this break-even ROAS planning guidance for the underlying approach.
A stable product with clean tracking can operate with a smaller cushion than a seasonal catalog or a product with unpredictable refunds. Volatile supplements, beauty products, gifting, and aggressive scaling deserve more protection because the observed cost stack can move quickly.
Recalculate using actual return rates, realized discounts, and landed costs, not only supplier estimates. Review net revenue after refunds rather than accepting gross platform-reported sales as the final input.
Your target also can't be so high that it suppresses acquisition. The useful operating range sits between the cash-preservation floor and the highest ROAS at which the business can still acquire enough customers to grow. That balance is part of unit economics for ecommerce decision-making.
The product economics don't change by platform, but the reported revenue can. Each ad system applies different attribution rules, conversion windows, and customer classifications, so the same campaign may display different ROAS values across dashboards.
| Platform | Typical reporting issue | Operator check |
|---|---|---|
| Meta | Windowed and view-through conversions can shift reported purchase ROAS | Reconcile attributed orders with blended store revenue |
| Delayed conversions and cross-device behavior can affect campaign values | Compare campaign ROAS with blended CAC and lift results | |
| Amazon | Attribution can interact with organic rank, Subscribe and Save, and shipping effects | Separate ad-attributed sales from the wider marketplace halo |
| TikTok | Purchase tracking and learning behavior may produce a larger gap between attributed and new-customer revenue | Validate new-customer orders and delayed conversions |
Use net revenue, not a platform's gross sales figure. Remove sales tax and shipping charges that don't fund ad spend, then calculate the threshold using the actual average selling price for the product or order type.
Review multiple attribution views, including one-day, seven-day, and the platform-default view where available. Don't select the most flattering window. Compare the result with blended CAC, marginal ROAS, bank deposits, order records, refunds, and contribution dollars.
Paid media strategy also benefits from understanding how channel planning and measurement fit together. Helbling Digital Media's paid media services provides useful context for evaluating channel execution beyond a single dashboard metric.
A platform isn't more profitable because it reports a higher ROAS. It may be claiming more of the same demand, using a different conversion window, or receiving credit for customers who were already close to purchasing. Use platform ROAS as an optimization signal, then let blended business results determine whether the channel deserves more capital.
A campaign can sit above its mathematical break-even ROAS and still lose money. The reason is incrementality. If the ad receives credit for an order that would have happened without the ad, the dashboard reports revenue that the campaign didn't create.
Use a campaign with a 2.3x break-even ROAS and a reported 3.0x ROAS. If the campaign generated $3,000 from 100 orders, but a holdout test shows only 40 orders were incremental, the incremental revenue is $1,200. Against $1,000 in ad spend, the incremental ROAS is 1.2x, below the stated threshold. These figures and the incrementality framing come from the verified scenario in the brief and NIQ's 2025 retail media analysis.
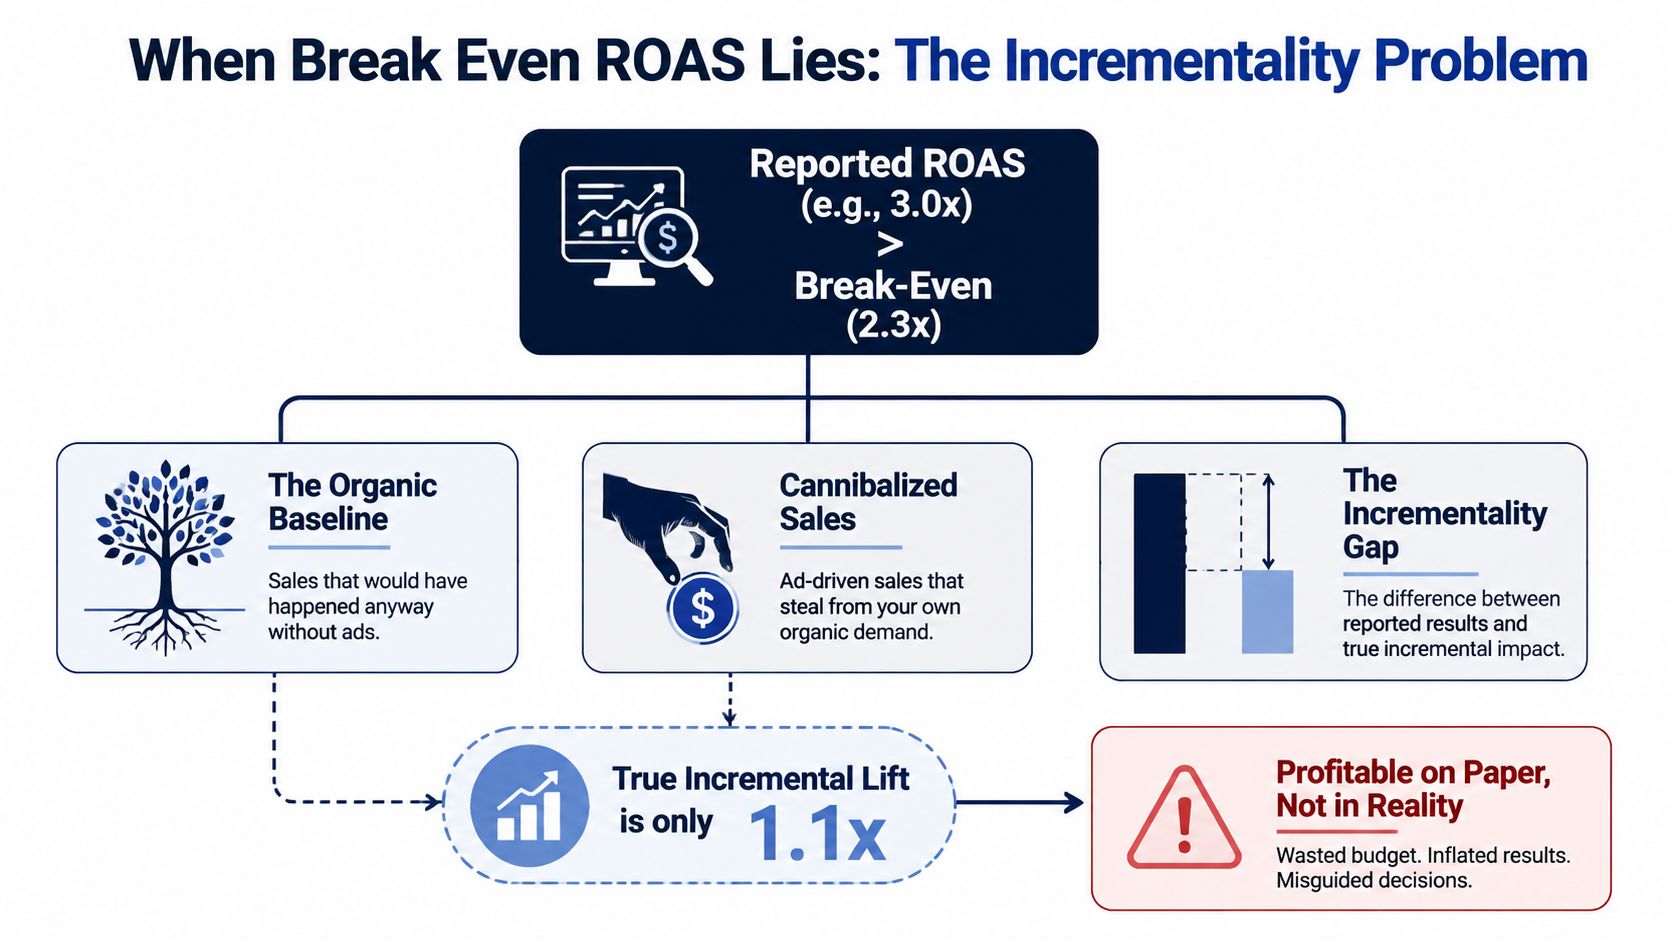
Start with the customer mix. Separate new-customer revenue from returning-customer revenue, because retargeting and branded search often capture demand that already exists. Then examine marginal performance as spend expands. Average ROAS can remain attractive while the next dollar of spend reaches colder, less responsive audiences.
A practical stress test includes:
The decisive metric is incremental contribution after variable costs. A reported ROAS above break-even can still coexist with rising blended CAC, weak marginal returns, and cash strain if the campaign mostly captures organic intent.
For a practical distinction between revenue credited to a channel and revenue caused by it, review the meaning of incremental revenue. Your platform dashboard is useful for buying decisions. It isn't a substitute for a business-level profit test.
A break-even model should be easy to rebuild, easy to audit, and difficult to flatter. Keep the inputs at SKU or product-family level where margins differ materially, and use realized order data rather than optimistic assumptions.
| Input or decision | Entry |
|---|---|
| Realized revenue per order | Enter net revenue after discounts and refunds |
| COGS | Enter landed product cost |
| Payment processing | Enter percentage and fixed order fees |
| Fulfillment and shipping | Enter actual per-order cost |
| Packaging | Enter materials and inserts |
| Returns reserve | Use observed order-level exposure |
| Other variable costs | Add marketplace and service charges |
| Contribution margin dollars | Revenue minus total variable costs |
| Contribution margin percentage | Contribution margin dollars divided by revenue |
| Break-even ROAS | 1 divided by contribution margin percentage |
| Buffer | Select according to category and cost volatility |
| Target ROAS | Apply the chosen buffer convention |
| Platform review | Compare reported, blended, marginal, and incremental results |
Set stress triggers for a pricing change, a new promotion, higher refund behavior, a fulfillment-rate change, or a meaningful shift in product mix. Rebuild the sheet when one of those triggers appears instead of waiting for a routine review.
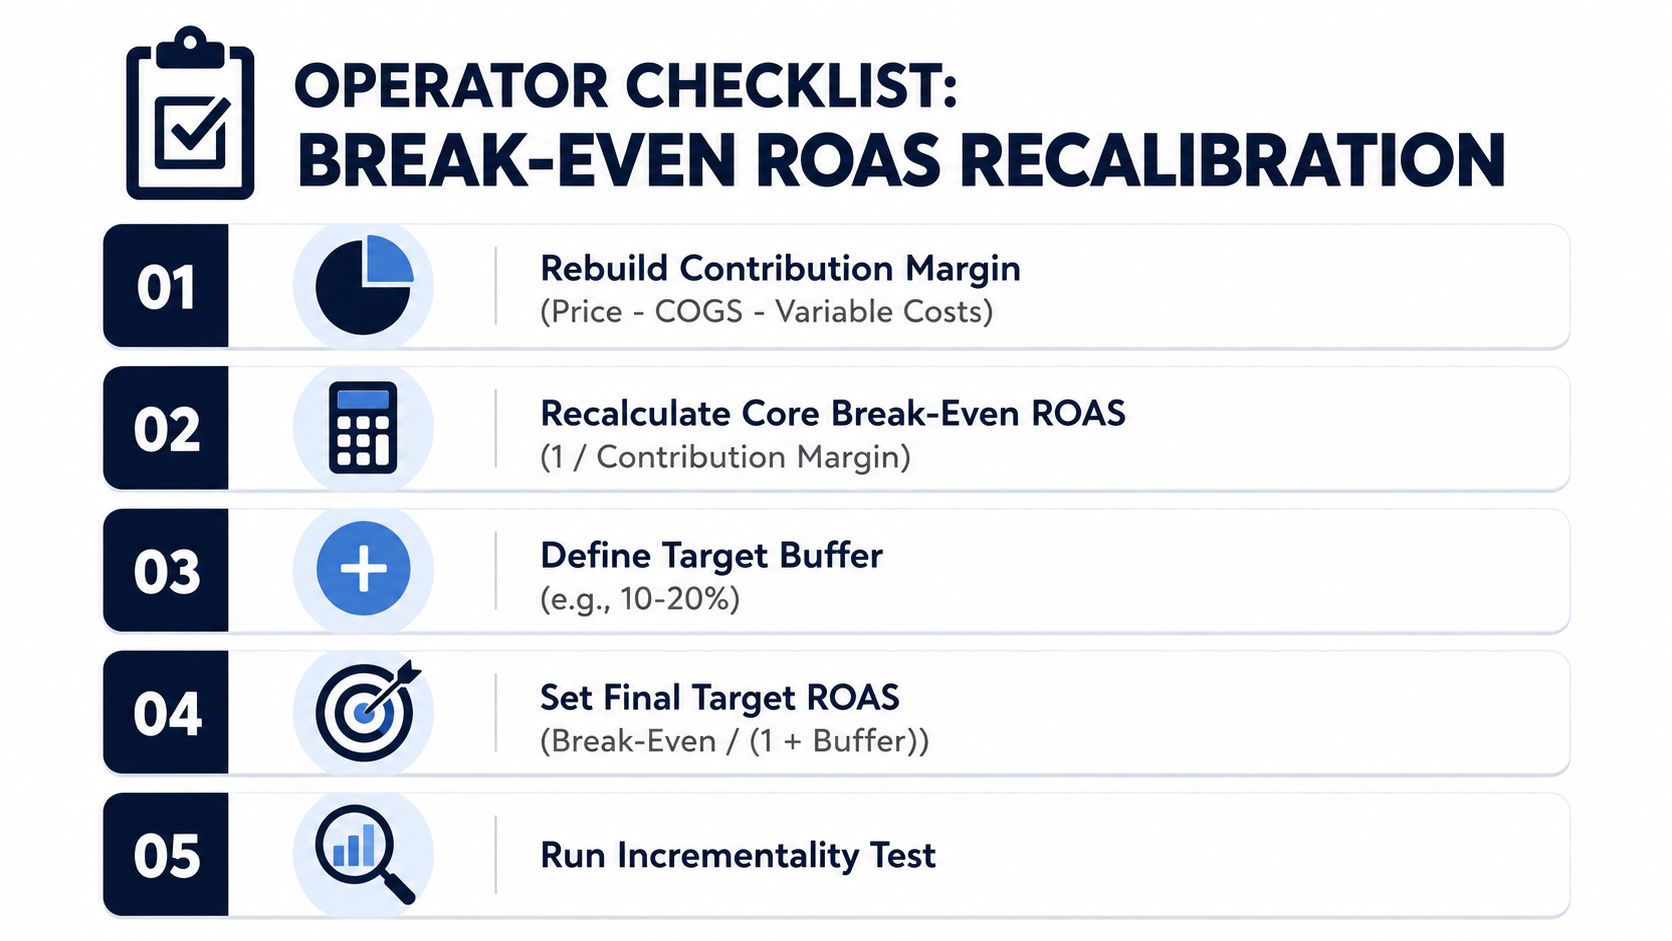
A break-even model is a snapshot, not a strategy. The operators who protect cash don't worship one threshold. They update the cost stack, challenge attribution, and move faster than their economics drift.
Million Dollar Sellers gives serious ecommerce operators access to peer-led strategy sharing, private discussions, and practical insights from experienced Amazon, DTC, and omnichannel founders. Visit Million Dollar Sellers to explore a community built for making sharper decisions about contribution margin, paid acquisition, and profitable growth.
Join the Ecom Entrepreneur Community for Vetted 7-9 Figure Ecommerce Founders
Learn MoreYou may also like:
Learn more about our special events!
Check Events