Chilat Doina
March 8, 2026
Let's be honest, "revenue" can be a vanity metric. What really matters is the new money you generate from a specific, deliberate action—like launching a new ad campaign or a product bundle.
That new money is incremental revenue. It’s the sales you absolutely would not have captured otherwise, and it's the single best way to measure real growth.

Think of your business like a river. It has a natural, baseline current—your everyday sales flow. Incremental revenue is the surge you get when you open a dam upstream. It’s not the river's normal flow; it's the direct, measurable result of that one specific action.
For any 7 or 8-figure seller, this concept is a game-changer. It helps you distinguish between genuine gains and just getting lucky with a market trend. It separates real impact from just shuffling money around.
Incremental revenue answers the most critical question for any business owner: "Did that action actually cause an increase in sales, or would those sales have happened anyway?"
Getting this right stops you from pouring more money into marketing, product launches, or pricing tests that feel good but don't actually work. It’s how you start making smarter, data-driven decisions that fuel real, sustainable scale.
To give you a quick cheat sheet, here’s a simple breakdown of the key ideas. At its heart, measuring incremental revenue is all about proving cause and effect in your business.
This table shows why it's not just about seeing your sales numbers go up; it's about knowing why they went up.
Of course, tracking this effectively means you need a rock-solid handle on your numbers. This is where a strong Financial Planning and Analysis (FP&A) process becomes your best friend, helping you forecast, track, and evaluate every move.
For high-stakes Amazon or DTC brands, this isn't optional. Consider this: in one year, global e-commerce sales jumped past $5 trillion, with a massive $421 billion of that being net new revenue. That’s pure incremental growth, captured by operators who knew exactly which levers to pull and how to measure the results.
Alright, let's get down to the brass tacks. Calculating incremental revenue isn't some high-level financial wizardry. It all comes down to a single, straightforward formula that helps you measure the direct result of any specific action you take in your business.
The core idea is actually pretty simple:
New Total Revenue – Baseline Revenue = Incremental Revenue
This formula cuts through the noise to isolate the "lift"—the extra sales you generated because of a specific move, like a new marketing campaign or a product launch. The real trick, though, isn't the subtraction. It's figuring out your baseline revenue, which is what you would have earned anyway, without doing anything new.
Let’s put this into a real-world context for a direct-to-consumer (DTC) brand.
Say your online store hums along nicely, typically bringing in $200,000 a month. You decide to roll the dice on a new influencer campaign in May, spending $15,000 to push a key product. When the month wraps up, your total revenue is $245,000.
Plugging those numbers into our formula:
That $45,000 is the direct sales lift you got from that influencer campaign. It's the new money you wouldn't have seen otherwise.
The same logic works perfectly for Amazon sellers, too. Imagine you invest in overhauling your A+ Content and main images for a best-selling product. Historically, that ASIN pulls in about $50,000 a month.
After the new, optimized listing goes live, you see the product’s monthly revenue jump to $62,000.
This $12,000 is the cold, hard return on your content investment. It’s proof that the changes worked, moving way beyond vanity metrics like traffic or conversion rates.
Knowing your revenue lift is great, but the sharpest sellers always take it one step further by calculating Incremental Return on Investment (iROI). This metric is way more powerful than a standard Return on Ad Spend (ROAS) because it measures the profitability of just the new money you generated.
The formula for iROI looks like this:
iROI = (Incremental Revenue – Incremental Costs) / Incremental Costs
Let's circle back to our DTC influencer campaign. We know the incremental revenue was $45,000 and the campaign cost (our incremental cost) was $15,000.
Getting a handle on iROI is absolutely critical for making smart budget decisions. While lift gives you the top-line story, iROI tells you if your efforts are actually making you richer. To get an even more granular view of your financial health, you should also understand your contribution margin on our blog, which breaks down the profit from every single sale.
This ruthless focus on true incremental gains is what separates brands that scale from those that stagnate. Just look at the bigger picture: In 2025, global e-commerce shot up to $6.419 trillion from $6.010 trillion the year before—a $409 billion incremental jump. That growth didn't just happen; it was driven by countless sellers who knew exactly how to measure and chase new revenue streams. You can discover more insights about global e-commerce trends at Cross-Border Magazine.
Knowing the formula for incremental revenue is one thing. Actually measuring it is a whole other ballgame—and it’s where the top sellers really pull ahead.
It’s easy to credit a new ad campaign for a sales spike, but how do you know those sales wouldn't have happened anyway? Isolating the real lift from all the background noise of market trends and seasonality requires a disciplined approach. The goal is to prove causation, not just spot a correlation.
Here are three proven methods that successful e-commerce brands use to measure true incremental lift with confidence.
A/B testing (or split testing) is your go-to for measuring the direct impact of small changes on your website or product listings. It’s simple: you show two different versions of one thing to two different groups of shoppers and see which one performs better.
Think of a DTC brand testing two homepage banners. One offers a 20% off discount, while the other promotes a "Buy One, Get One 50% Off" deal. By tracking the revenue from each group, the brand can see which promotion generated a higher incremental lift, not just more clicks.
This works wonders on Amazon, too. You can use Amazon Experiments to test different main images or A+ Content layouts. If Version B pulls in a 5% higher unit session percentage, you can directly attribute that sales bump to the new creative.
Holdout testing is one of the most powerful ways to figure out if an entire marketing channel is worth the money. The idea is to intentionally "hold back" a piece of your audience from seeing a particular campaign and then compare their buying behavior to the group that did see it.
A classic example is a geo-holdout test. Let's say you're launching a new YouTube ad campaign in the U.S. Instead of running it nationwide, you could exclude a couple of states—like Texas and Florida—from your targeting. Those states are now your control group.
After the campaign runs for a while, you compare sales growth in the targeted areas against the growth in your holdout states. The difference between the two is the incremental lift from your YouTube ads. This proves whether your ads are actually creating new customers or just reaching people who were going to buy from you regardless.
A holdout test answers the ultimate marketing question: "What would have happened if I hadn't spent this money?" It is the gold standard for proving that a channel is adding real value to your business.
This is the core logic: separating the new revenue you generated from the baseline you would have hit anyway.
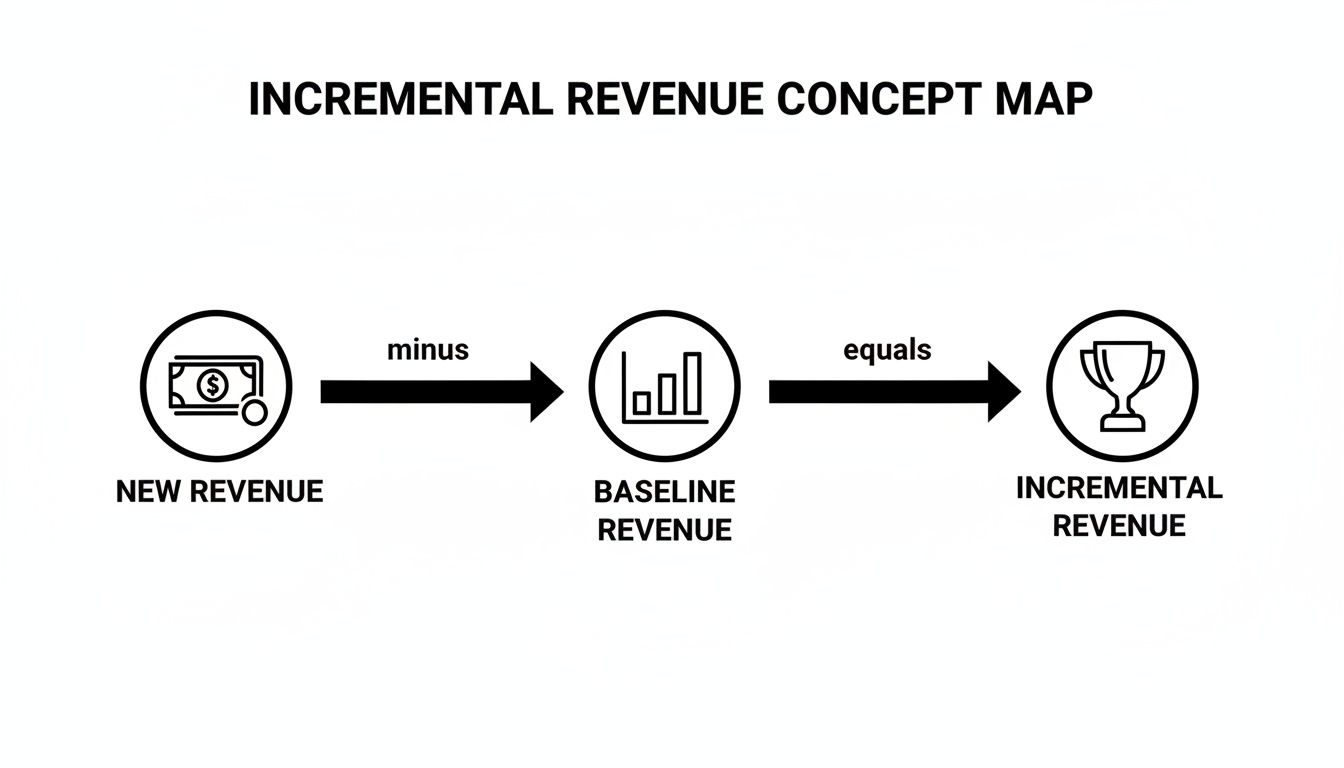
The flow is simple but powerful: take your total revenue, subtract what you would have earned no matter what, and you're left with your true incremental gain.
Big ad platforms like Meta (for Facebook and Instagram) and Google know you need to justify your spend, so they offer their own built-in lift studies. These tools basically automate holdout testing to show you the causal impact of your campaigns.
Here’s the typical process:
For example, a Meta Brand Lift Study might reveal your campaign led to a 15% lift in purchases. That means your ads directly caused a 15% increase in sales above and beyond what would have happened organically. These studies are perfect for defending your ad budget and showing how top-of-funnel campaigns are actually driving the bottom line.
All of these measurement techniques are key parts of a smart growth strategy. The data you get from them feeds directly into a deeper analysis of your business performance. To take your skills to the next level, check out our guide on how to analyze sales data for more advanced techniques.

Knowing your incremental revenue is one thing. But turning that number into actual money in the bank is where top 7- and 8-figure sellers really pull ahead of the pack. It’s all about pulling the right strategic levers—in marketing, pricing, and even product development—to spark real, measurable growth.
This isn’t about just throwing more money at everything and hoping something sticks. It’s about being surgical. The insights you get from incrementality testing should be the blueprint for your next move, telling you exactly where to put your budget, time, and team for the biggest impact.
Let's break down the strategies the pros use to turn data into dollars.
One of the first and most powerful places to apply incrementality is your marketing mix. It helps you get honest answers to the tough questions. You know the ones: "Is our TikTok ad spend actually bringing in new customers, or are we just paying to high-five people who were going to buy from us anyway?"
Holdout tests cut through the noise. Run a test, and you might discover your TikTok ads are, in fact, delivering a huge incremental lift. Great—time to scale that budget. But you might also find that your branded search campaign, despite its amazing ROAS, has almost no incremental lift. You’re likely just over-investing to capture demand you already created elsewhere.
Key Takeaway: Focusing on incrementality shifts your budget from channels that merely harvest existing demand to channels that genuinely create new demand. That’s the real secret to sustainable growth.
This approach gives you the confidence to move money around, knowing your decisions are backed by proof of cause-and-effect, not just flimsy correlations. To get a head start, it's worth exploring how to increase ecommerce sales with tactics that are proven to generate genuine lift.
Discounts are a classic double-edged sword. Sure, they can give your top-line revenue a nice sugar rush, but they can also absolutely demolish your margins and fill your customer list with one-and-done deal hunters. Measuring incremental revenue is how you find the sweet spot between driving sales and protecting your profit.
Stop guessing which offer is best and start testing. Run a few different promotions at the same time through your site or email list to see what really moves the needle.
By tracking the incremental revenue—and more importantly, the incremental margin—from each group, you'll see which promo actually adds the most to your bottom line. You might be surprised to find that the BOGO offer drives a much higher average order value, leading to more incremental profit even if the total revenue looks a bit lower than the sitewide sale. For more ideas on this front, check out our guide on how to increase average order value.
Deciding to launch a new product, create a bundle, or expand to a new marketplace always feels like a gamble. Using incremental revenue data is how you stack the odds in your favor and make those big bets with confidence.
Let's say you're thinking about launching a new color for your bestseller. You could send out a survey, but a small, targeted pre-launch campaign will give you a much better read on actual purchase intent.
Here’s a simple way to do it:
If you see a strong incremental response, you have a clear signal that real demand exists, making that inventory investment a whole lot less scary. The same logic works for product bundles. Use A/B tests to see if a bundle generates more incremental revenue than the items sold separately, even after accounting for any sales it might cannibalize.
To put it all together, think of these strategies as different levers you can pull. Each has a different purpose and impact, and knowing which one to use when is key.
Pulling these levers isn’t a one-time thing. The most successful brands are constantly testing, measuring, and refining their approach.
This disciplined focus on what truly drives new revenue is what separates a good e-commerce business from a great one. You stop reacting to sales data and start actively engineering growth, one test at a time.
Getting a real read on incremental revenue is a game-changer for scaling your brand. But it’s a path loaded with traps that can trick you into burning cash on bad campaigns or cutting the very initiatives that are actually driving growth.
It’s not enough to have good intentions. You need a healthy dose of skepticism and a sharp eye for where the data can lie. Plenty of sellers fall for the same mistakes, and these miscalculations can be seriously expensive.
Let's walk through the most common traps I see brands fall into and, more importantly, how you can sidestep them.
This is the number one, most costly mistake in marketing analytics, hands down. It’s when you see two things happening at the same time—like your ad spend going up and your sales going up—and you assume one caused the other. It's almost never that simple.
Imagine you fire up a big Facebook ads campaign in November. A month later, your sales have shot through the roof. Your first instinct is to high-five the marketing team and double the budget. But you forgot the most obvious factor: it's November.
Your incremental revenue is only as good as your baseline—the forecast of what would have happened anyway, without your new marketing push. If your baseline is off, your entire analysis is worthless.
Let's say a brand wants to test a new pricing strategy in March. For their baseline, they just use their sales numbers from February. The problem? February is their slowest month of the year, and March is always when sales pick up for spring.
The baseline isn't just a number from the past; it's a forecast of the future that would have happened without your intervention. If that forecast is wrong, your entire analysis will be wrong.
This bad comparison makes the new pricing look like a home run. In reality, a big chunk of that "lift" was just the normal seasonal trend they see every year.
Sales cannibalization is what happens when a new product or promotion doesn't actually create new demand—it just steals sales from your other products. You see a nice spike in one SKU, but your total, store-wide revenue has barely moved.
A classic example is launching a cheaper, "lite" version of your flagship product. The new item sells like crazy, but you quickly notice that your flagship sales have dropped by almost the exact same amount.
The incremental revenue from the new product is basically zero. Worse, since it has a lower margin, your overall profit just went down.
Once you get your head around the idea of incremental revenue, the practical questions start flying. This is where the theory hits the pavement of your actual e-commerce business. It's one thing to know what it is, but another thing entirely to use it effectively.
We're going to walk through the most common—and most important—questions that 7- to 9-figure sellers ask when they start digging into incrementality. These are the direct, no-fluff answers you need to start applying these concepts with confidence.
Get this distinction right, and you're ahead of 90% of marketers. Both metrics tie your ad spend to revenue, but they tell you two completely different stories.
Return on Ad Spend (ROAS) is a simple efficiency metric. It measures the total revenue you brought in for every dollar you spent. A 10x ROAS just means for every $1 you put into a campaign, you got $10 back in total sales. Easy enough.
Incremental Revenue, on the other hand, isolates the new sales that were directly caused by that campaign. It asks the much harder, much more valuable question: how many of those sales would have come in anyway, even if the ad never ran?
A branded search campaign might boast a jaw-dropping 20x ROAS. But that’s usually just you paying to catch customers who were already searching for your brand by name. An incrementality test, like a holdout, might reveal that same campaign only has a 2x incremental ROAS (iROAS).
Top sellers obsess over incrementality because it measures true growth, not just recapturing demand you already created. ROAS tells you what happened; incrementality tells you if your money actually made it happen.
Choosing your baseline is everything. Get it wrong, and your entire calculation is useless. Your baseline is your control group—it's your best-guess forecast of what would have happened without your new ad, promotion, or pricing change.
There's no single magic formula, but here are some solid rules of thumb we see working for top sellers:
The goal is to find a control period that is as identical as possible to your test period in every way except for the one thing you're testing.
Absolutely. While there are some seriously expensive marketing mix modeling (MMM) platforms out there, you can run incredibly powerful incrementality tests with basic tools and a bit of discipline.
A geo-holdout test is a perfect example. It's a classic for measuring the true lift from a channel like Facebook, YouTube, or TikTok.
Here’s a simple way to set one up:
This all happens in a spreadsheet. No fancy software needed. For on-site tests, many platforms like Shopify have built-in A/B testing or integrate with affordable apps that do the job. The most important tool isn't software; it's a commitment to thinking like a scientist.
Yes, and finding this out is one of the most valuable—if painful—lessons you can learn. Negative incremental revenue is when an action you took actually caused your sales or profit to drop compared to what you would have otherwise expected.
Here are a few ways this can bite you:
Seeing negative incrementality is a massive red flag. It’s your signal to kill an initiative immediately and figure out what went wrong. It's much better to learn that lesson from a small test than after a disastrous nationwide launch.
Understanding incremental revenue is one thing, but using it to drive real growth is what separates the best from the rest. Million Dollar Sellers is an exclusive community where top e-commerce founders share the exact strategies they use to measure lift, optimize spend, and scale their brands past 8 and 9 figures.
Join the Ecom Entrepreneur Community for Vetted 7-9 Figure Ecommerce Founders
Learn MoreYou may also like:
Learn more about our special events!
Check Events