


Stay Updated with Everything about MDS
Thank you! Your submission has been received!
Oops! Something went wrong while submitting the form.

Chilat Doina
February 4, 2026
Calculating your sell-through percentage is surprisingly straightforward. You just divide the number of units you sold by the number of units you received at the start of a specific period, then multiply that by 100. This simple formula is your key to unlocking some seriously powerful insights into how your inventory is really performing.
For any e-commerce operator who's serious about growth, the sell-through rate isn't just another number—it’s a vital sign for your business's health.
This single metric tells you exactly how efficiently your inventory is turning into cash. It gives you an immediate, actionable signal that broader measures like inventory turnover just can't provide. Getting a handle on this figure is absolutely essential for improving cash flow, boosting profitability, and avoiding those nasty storage fees from partners like Amazon FBA.
Think of it as your playbook for making smarter decisions every week and every month. A strong sell-through rate proves you've got a winning product that customers actually want. On the flip side, a weak rate is an early warning sign, pointing to potential problems with your marketing, your pricing, or even the product itself.

In elite seller networks like Million Dollar Sellers, where top Amazon and DTC operators share what's working, the sell-through rate is treated like an inventory crystal ball. It predicts future success or failure.
Industry benchmarks suggest the retail sweet spot is 40-80% over a two-to-three-month window. Anything over 80% is a clear home run. On a hyper-competitive platform like Amazon, 2024 data showed a 50% sell-through rate in 90 days was the breakeven point for many resellers to even turn a profit.
Before we dive into examples, let's break down the formula's components to make sure we're all on the same page.
ComponentDefinitionExample Data PointUnits SoldThe total number of units sold to customers within your chosen time frame.You sold 75 units in May.Units ReceivedThe total stock you had on hand at the very beginning of that same time frame.You started May with 150 units.Time PeriodThe specific timeframe you're measuring (e.g., weekly, monthly, quarterly).The month of May.
Using the data points above, the calculation is simple: (75 / 150) * 100 = 50%. This quick check gives you a clear, objective measure of that product's performance for the month.
At the end of the day, your goal is to move products efficiently. A healthy sell-through rate directly fuels better financial outcomes. It ensures your capital isn't just sitting on a shelf tied up in slow-moving stock, freeing you up to reinvest in proven winners and scale your business intelligently.
To really connect the dots here, it's crucial to understand how a comprehensive digital marketing for ecommerce growth strategy directly impacts sales velocity and, as a result, this key metric.
By mastering this calculation, you can:
Effectively managing your sell-through rate is one of the most powerful levers you have for financial health. When you know which products are flying off the shelves, you can make strategic adjustments that directly boost your bottom line. For more on that, you might want to check out our guide on how to improve gross margins.
Alright, let's get down to brass tacks. Theory is great, but you need to know how to actually calculate your sell-through percentage (STP). It all starts with one simple formula:
STP (%) = (Number of Units Sold ÷ Number of Units Received) × 100
To make this work, you need solid data. The best place to pull this is straight from the source—your Shopify dashboard, Amazon Seller Central, or whatever inventory management system you're using.
Let's walk through a real-world example. Say your DTC brand just got a shipment of 500 units of a best-selling face serum. Over the first 30 days, you managed to sell 350 of them.
Here’s the math:
(350 ÷ 500) x 100 = 70% sell-through rate
That 70% is a strong signal that the product is a winner. The crucial part here is consistency. Always use the same timeframe—whether it's 30, 60, or 90 days—so you can compare apples to apples and actually spot meaningful trends over time.

You'll hear different terms for the starting inventory figure. While "Units Received" is pretty common, some businesses prefer using "Stock on Hand at Start." Honestly, the principle is the same. The only thing that truly matters is that you stick to one method.
For instance, imagine a luxury watch retailer kicking off December with 200 high-end timepieces. By New Year's Eve, they'd sold 50. Using the "stock on hand" approach, their sell-through rate was 25% (50 ÷ 200 = 0.25 × 100). This isn't a bad number; it just confirms that these big-ticket items aren't impulse buys. That insight allowed them to smartly reorder just 30 more units, keeping their inventory lean and their cash flow healthy. For a deeper dive into inventory math, check out Wall Street Prep's breakdown.
Pro Tip: Don't get bogged down in the terminology. "Units Received" or "Stock on Hand"—just pick one and run with it. As long as you apply it consistently across all your SKUs and reporting periods, your data will be reliable and comparable.
This isn't just a vanity metric; it's directly tied to your cash flow. A high sell-through rate means you're quickly turning inventory back into cash, which you can then reinvest in more stock or other parts of your business. It's a fantastic, no-nonsense measure of how well your buying decisions are matching up with what your customers actually want.
Sell-through rate is a close cousin to another critical metric. If you want a fuller picture of your inventory health, you should also learn how to calculate inventory days on hand. Knowing both gives you a much clearer understanding of what’s really going on in your warehouse.
Any seasoned seller knows that a single, overall sell-through rate only tells you part of the story. The real gold is found when you start digging deeper and slicing up your analysis by channel. Figuring out your sell-through percentage for each sales channel is how you truly start to pull the levers of your business.
This segmented view shows you exactly where your products are flying off the shelves and where they're gathering dust. It’s the difference between guessing and having a clear roadmap for what to do next.
Let's imagine a multi-channel apparel brand selling a popular hoodie. You run the numbers for the month and see a healthy 60% sell-through rate. Not bad, right? But that single number is hiding a much more interesting reality.
When you break it down by channel, you might discover a completely different picture:
This gap is a massive flashing sign. It tells you your Shopify marketing is hitting the mark, but your Amazon strategy needs an immediate tune-up. Maybe your Amazon PPC campaigns are off, or your product listing could use a refresh to boost conversions. Without that channel-specific calculation, you’d completely miss the opportunity to fix the weakest link in your sales chain.
This same logic applies when you compare different types of products. Your inventory isn't all the same, so your analysis shouldn't be either. It's crucial to separate your seasonal items from your evergreen, year-round staples for effective inventory management.
Picture yourself as an outdoor gear retailer. A new, trendy winter parka might have a target sell-through of 85% during the fall and winter. You want to move that inventory fast before the season ends to avoid getting stuck with it and having to run heavy markdowns.
On the other hand, a classic, all-season backpack might have a more modest monthly target of 50%. This is an evergreen product with consistent demand, so the goal is less about rapid liquidation and more about maintaining steady, reliable stock levels.
By calculating sell-through for each product type, you can tailor your reordering strategy. For seasonal items, a high rate means it's time to reorder aggressively. For evergreen products, a steady rate helps you maintain the perfect stock balance.
This level of detail is a core piece of building a resilient e-commerce operation. While sell-through gives you a great snapshot of sales velocity, it's also important to understand the bigger picture. To learn more, check out our guide on what inventory turnover is and how to improve it, which is the perfect complement to this analysis.
Ultimately, segmenting your sell-through analysis transforms a simple metric into a powerful diagnostic tool. It lets you pinpoint problems, double down on what’s working, and make surgical adjustments to your inventory and marketing strategies across your entire business.
So you've run the numbers and have your sell-through percentage. Now what? The big question is always the same: "Is this number any good?"
The honest answer? There's no single magic number. A “good” sell-through rate is entirely dependent on your industry, your specific product, and what you’re trying to achieve. Context is everything.
A fast-fashion brand, for example, might need to see a 70-80% monthly sell-through to call a new t-shirt a success. On the flip side, a high-end furniture retailer could be perfectly happy with a 30% rate on a handcrafted dining table that has a much longer sales cycle. The key is to figure out what makes sense for your business and your products.
A high sell-through percentage feels like a win, and it usually is. It’s a great signal of strong product demand and means your inventory management is on point.
But be careful. An extremely high rate—say, 95% in the first two weeks—could actually be a red flag. It might mean you under-ordered and are now missing out on sales because you’re stocked out. You've left money on the table.
A consistently low rate, however, is a clear warning sign. It often points to a few common culprits: overstocking, a miss in your marketing, or a product that just isn't hitting the mark with your audience. This is where sell-through becomes a powerful diagnostic tool, forcing you to dig into the "why" behind the number.
This decision tree gives you a simple framework for what to do next based on your sell-through analysis.
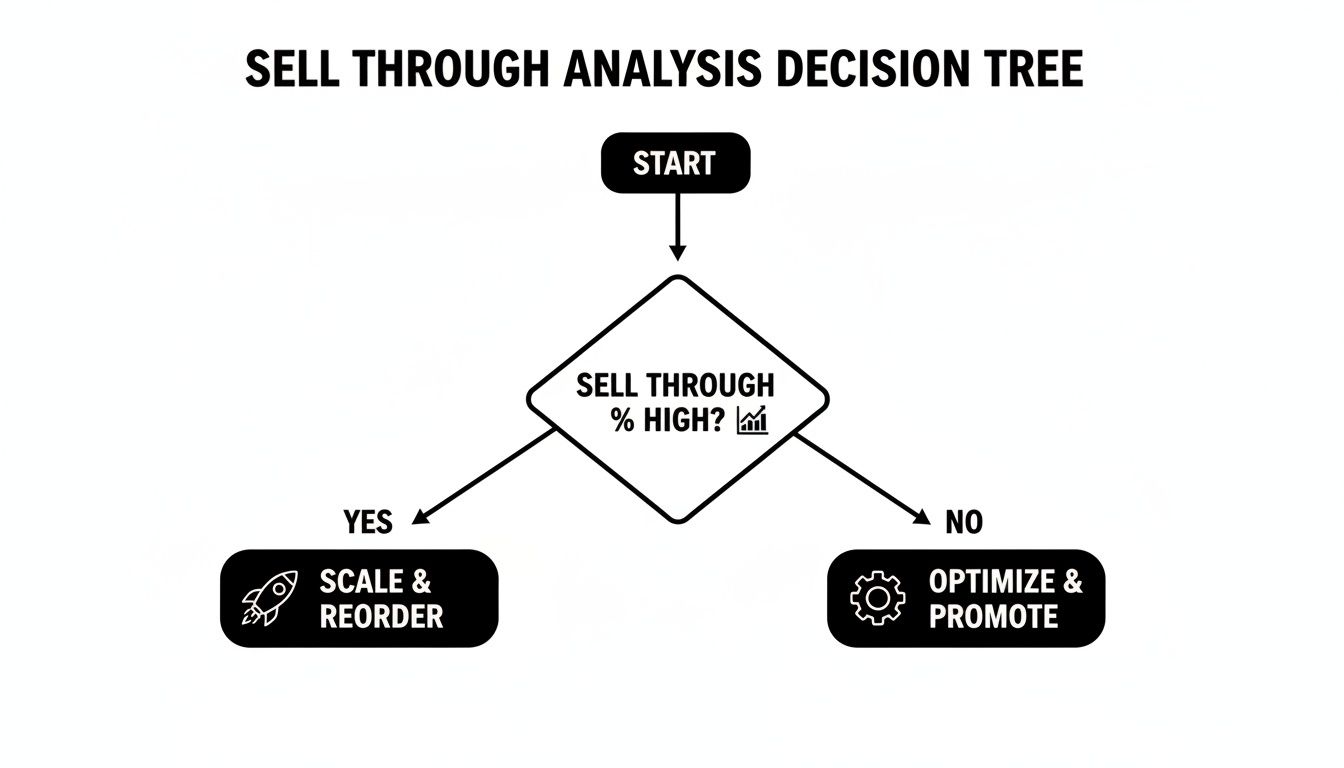
Use it as a quick guide to decide whether it's time to ramp up inventory or rethink your sales and marketing strategy.
To give you a clearer picture, let's look at some common benchmarks. Keep in mind these are just starting points—your own numbers are what matter most.
The best e-commerce brands I've worked with live and die by their sell-through rates. They use it to nail down demand and slash dead stock. Recent data shows that top-tier direct-to-consumer (DTC) brands often hit a 70-90% sell-through rate for seasonal products. In contrast, broader retail channels might hover closer to 50-60%.
Here’s a rough breakdown of what different e-commerce categories might aim for.
Product CategoryLow STP (Underperforming)Healthy STP (Target Range)High STP (Risk of Stockout)Fast Fashion/ApparelBelow 40%60-80%Above 90%Consumer ElectronicsBelow 20%40-60%Above 75%Home Goods & FurnitureBelow 15%25-50%Above 65%Beauty & CosmeticsBelow 30%50-70%Above 85%Seasonal/Holiday ItemsBelow 50%70-90%Above 95%
This table helps illustrate just how much the "ideal" number can vary. A 45% rate would be a disaster for a seasonal item but could be fantastic for a piece of furniture.
Think about a boutique that brings in 250 summer dresses for the season. If they sell 175 of them, that's a 70% sell-through rate—a fantastic result that aligns perfectly with seasonal demand. They've successfully avoided the deep markdowns that plague stores with piles of unsold stock.
Brands that master this have seen incredible results. In 2023, some retailers managed to cut their overstock by 25%, which unlocked billions in cash flow. For a deeper dive into how top brands do it, check out these insights on using sell-through rates effectively.
A low sell-through rate isn't a failure—it's a data point. Treat it as a trigger. It’s your cue to launch a flash sale, bundle a product, or pivot your marketing to liquidate that inventory before it becomes a real financial drag.
Ultimately, your goal is to find that sweet spot for every product you carry. The perfect sell-through percentage is the one that maximizes sales at full price while minimizing the risk of both stockouts and costly overstock. It's a balancing act, but once you get it right, it becomes one of the most powerful levers for boosting your profitability.

Even seasoned pros can stumble when calculating sell-through, leading to bad data that completely misguides their inventory strategy. These aren't just tiny rounding errors, either. They're fundamental slip-ups that can paint a totally false picture of how a product is really performing.
Getting this right is non-negotiable. It’s the foundation you build your entire ordering and marketing strategy on.
A classic mistake I see all the time is using inconsistent time periods. Pitting this week’s sell-through against last month's is a pointless, apples-to-oranges comparison. If you want to spot actual trends, your measurement windows have to be identical. Stick to weekly, monthly, or quarterly—just be consistent.
This one is a huge pitfall. If you sold 100 units but 15 of them boomerang back as returns, you didn't really sell 100 units. Your net units sold is 85.
If you forget to subtract those returns, you'll artificially inflate your sell-through percentage. This makes a product look like a bestseller when it might actually have a serious problem. That's how you end up reordering a ton of inventory that customers don't truly want. Always, always use your net sales figures to get the real story.
Just don't do it. Lumping all your products into one giant sell-through calculation is a recipe for disaster. This "blended" number completely buries the details you actually need to make smart calls. It's so easy for one hero product to mask a dozen duds, making your overall inventory health seem way better than it is.
Your goal here is clarity, not a feel-good average. A 70% overall rate might look solid, but what if it's hiding a hero product at 95% and five others collecting dust below 20%? You have to calculate sell-through at the individual SKU level. No exceptions.
Drilling down to the SKU or variant level lets you make targeted, profitable decisions, like:
The number on the bottom of the fraction—your starting inventory—is just as crucial as the number on top. A shockingly common mistake is plugging in the stock you have at the end of the period instead of the beginning. The formula absolutely requires the stock on hand at the start of the period you're measuring.
Let's say you kicked off May with 500 units and sold 300. Your sell-through is a clean 60% (300 / 500).
But if you accidentally use your ending inventory of 200 units as the denominator (300 / 200), you get a wild, impossible 150% sell-through rate. That single, simple error makes your data completely useless.
The fix is easy: establish a firm cutoff date for your starting inventory count each period and stick to it. By dodging these common mistakes, you’ll know the data you're working with is clean, reliable, and powerful enough to drive your business forward.
Digging into a new metric like sell-through rate always brings up a few questions. As you start working this into your regular operations, you'll probably run into some of the same ones we hear all the time from other e-commerce operators.
Here are some quick, straight-to-the-point answers to help you get moving.
The right answer here really depends on how fast your products fly off the shelves. There's no one-size-fits-all schedule.
For your best-sellers or anything you’re pushing on a competitive marketplace like Amazon, you should be looking at this weekly. This pace lets you jump on sudden changes in demand, whether it's a spike you need to feed with more inventory or a dip that signals a problem. It keeps you agile.
For your slower, more consistent evergreen products, a monthly check-in is usually plenty. You'll get enough data to make smart reordering decisions without getting bogged down by tiny, insignificant blips. The key is just to be consistent—pick a schedule for each product type and stick to it so you can actually spot meaningful trends.
The Bottom Line: Match your reporting cadence to the sales cycle of the product. Fast movers need weekly attention; slower ones are fine with a monthly look.
It’s easy to mix these two up, but they tell you very different things about the financial health of your business. Getting the distinction is key.
Think of it like this: Sell-through helps you decide whether to reorder a specific t-shirt today. Inventory turnover tells you if your overall apparel business model is working.
This is where things get really powerful. Your sell-through rate is a direct, no-nonsense feedback loop on your marketing. It cuts through the vanity metrics and shows you what’s actually moving the needle.
Let's say you launch a new ad campaign on Meta. If that product's weekly sell-through jumps from 10% to 40%, you’ve got cold, hard proof that your campaign is working. On the flip side, if a product has amazing reviews but a pitifully low sell-through, that's a huge red flag for your marketing. Maybe the ad creative is off, or you're targeting the wrong audience.
By tracking sell-through by channel, you can stop guessing and start putting your ad dollars behind the campaigns that are actually getting products out the door.
While you can definitely start with a good old-fashioned spreadsheet, calculating this manually gets old fast, especially as your business grows. It also opens the door to human error.
Most modern inventory management systems (IMS) like Skubana or Cin7 have this baked right into their reporting dashboards. They’ll track sell-through for you automatically.
If you’re an Amazon seller, specialized platforms like Helium 10 or Jungle Scout are lifesavers. They offer tools to monitor your sales velocity and inventory levels, which makes calculating sell-through a breeze. Automating this frees you up to spend your time on what really matters: analyzing the data and making smart decisions, not just crunching numbers.
At Million Dollar Sellers, top e-commerce founders don't just track metrics—they use them to build 8- and 9-figure brands. Our exclusive community is where serious operators share the exact strategies that drive profitable growth. Apply to join MDS today.
Join the Ecom Entrepreneur Community for Vetted 7-9 Figure Ecommerce Founders
Learn MoreYou may also like:
Learn more about our special events!
Check Events.svg)
.svg)
.svg)

.svg)