Chilat Doina
August 30, 2026
You're staring at a revenue plan that says the next quarter will be your biggest yet. The number looks reasonable because last year's sales grew, paid media appears scalable, and your team has already started talking about inventory commitments. Then a channel slows, a promotion pulls demand forward, or a stockout removes your best seller from the site. The forecast misses, but the purchase orders, ad budget, hiring plans, and cash decisions have already moved.
How to forecast revenue for an ecommerce brand isn't a finance exercise that ends with one top-line number. It's an operating discipline. You need a channel-by-channel view of demand, conversion, average order value, returns, marketing efficiency, product availability, and the assumptions behind every major change. Historical data gives you a baseline, but your operating decisions determine whether that baseline remains useful.
A dependable forecast tells the team what must be true for the plan to work, what could break it, and what action to take when actual performance moves away from the model.
Most ecommerce forecasts fail before anyone opens the spreadsheet. The founder starts with blended revenue, adds a growth rate, and treats the result as a plan. That approach feels efficient, but it hides the levers that create revenue and the constraints that prevent it.
Historical forecasting is a useful baseline when the underlying history is clean. A common practice is to review 12 to 24 months of history so the team can see trend and seasonality, then adjust for known changes such as pricing, new markets, or major renewals, as described in this guide to historical forecasting. The problem is that last year's blended revenue also contains last year's channel mix, promotion schedule, stockouts, customer behavior, and product availability. If those conditions have changed, extending the old line forward creates false confidence.
Operating rule: A forecast is only useful when every major revenue assumption connects to a decision someone can make.
A usable ecommerce forecast starts with channels and drivers. For DTC, that means sessions, source mix, conversion rate, average order value, discounts, and returns. For Amazon, it means traffic, conversion, selling price, Buy Box conditions, and inventory availability. Wholesale requires doors, sell-through, reorder timing, and payment terms. Each channel has a different revenue mechanism, so each one deserves its own logic.
Separate the forecast by channel, product family, and major SKU groups. Then reconcile the result to the operating plan:
The Forrester study published with Clari found that 55% of respondents missed quarterly forecasts by more than 10%, while only 18% had quarterly forecasts within 5% of actual revenue. For monthly forecasts, 51% missed by more than 10%, and only 15% landed within 5%. Those results are documented in the Forrester and Clari revenue operations study.
The answer isn't to add complexity for its own sake. Build the forecast from channel-level inputs, document the assumptions, connect the output to inventory and ad spend, and compare forecast with actual performance every cycle. The model should correct itself before a miss becomes an operating crisis.
No single forecasting model fits every ecommerce business. Your best starting point depends on the amount and cleanliness of your history, the stability of your channel mix, and whether repeat purchase drives the economics.
Top-down historical extrapolation extends past revenue using observed growth and seasonality. It's a reasonable starting benchmark for a young brand with limited history, but it becomes unreliable when acquisition channels, product mix, or promotions are changing quickly.
Bottom-up driver-based forecasting builds revenue from sessions, conversion, average order value, units, or orders by channel. This should be the default for most omnichannel brands because it translates directly into media budgets, inventory requirements, and commercial decisions.
Cohort and retention forecasting separates new customers from returning customers and models future orders by acquisition period. It's especially useful for subscriptions, replenishment products, and DTC brands where repeat behavior matters more than the first order.
Statistical and machine-learning forecasting can identify patterns across a large, consistent dataset. Mature Amazon operators or established omnichannel brands may benefit from regression, time-series models, or tools focused on predictive analytics with AI. These methods won't repair inconsistent SKU definitions, missing channel data, or unreliable promotion history.
| Model | Data Required | Best For | Limitation |
|---|---|---|---|
| Historical extrapolation | Clean revenue history and seasonality | Young brands needing a baseline | Assumes past conditions remain relevant |
| Driver-based | Traffic, conversion, AOV, units, spend, and inventory | Omnichannel ecommerce operators | Requires disciplined channel data |
| Cohort and retention | Customer cohorts, repeat orders, and retention behavior | Subscription and repeat-purchase brands | Less useful when repeat behavior is limited |
| Statistical or machine learning | Long, clean, granular datasets | Mature, data-rich businesses | Complexity can hide weak inputs |
The model should match the decision. Inventory planning needs more detail than a broad growth discussion. A new product launch needs scenario logic because historical sales can't fully describe demand that doesn't exist yet. Channel-level driver forecasting handles these situations better than a single growth percentage.
For a broader overview of model selection, compare these sales forecasting methods, then keep the implementation proportional to your data maturity. Start with driver-based forecasting for an omnichannel brand, add cohort logic when repeat purchase materially affects revenue, and consider statistical tools only after the underlying data is clean and stable.
A driver-based forecast is only as good as the inputs feeding it. Gather the data by channel first, then add the cross-channel assumptions that affect net revenue and capacity.
For Shopify or another owned storefront, track sessions by acquisition source, add-to-cart behavior, checkout conversion, average order value, discount mix, and return rate. Don't use one blended conversion rate if paid social, branded search, email, and organic traffic behave differently.
A simple example shows the mechanics. 180,000 monthly sessions at a 2.4% conversion rate and an $84 average order value produce $362,880 before returns. The calculation is 180,000 × 2.4% × $84. Net revenue must then reflect returns, refunds, cancellations, discounts, and other deductions.
Use the same structure for each meaningful traffic source. Paid traffic needs spend and efficiency assumptions. Email needs send volume, engagement, and attributed orders. Organic traffic needs a defensible view of demand rather than an automatic compounding rate.
Amazon forecasting starts with impressions, click-through rate, unit session percentage, average selling price, fulfillment economics, and the split between FBA and FBM. Buy Box loss and inventory gaps can change marketplace output rapidly, so the model should treat availability as a constraint, not an afterthought.
Wholesale and retail require different drivers. Capture door count, sell-through, reorder cadence, case-pack requirements, purchase order timing, payment terms, and expected cancellations. A shipment can create booked revenue while cash arrives later, so the forecast must distinguish demand, recognized revenue, and cash collection.
A complete input set also includes:
Use demand forecasting for ecommerce to frame the demand side, but keep the operating model grounded in what the business can stock and sell. The most damaging input mistake is blending paid and organic conversion into one average. That average can hide which channels have room to scale and which ones are already near their practical ceiling.
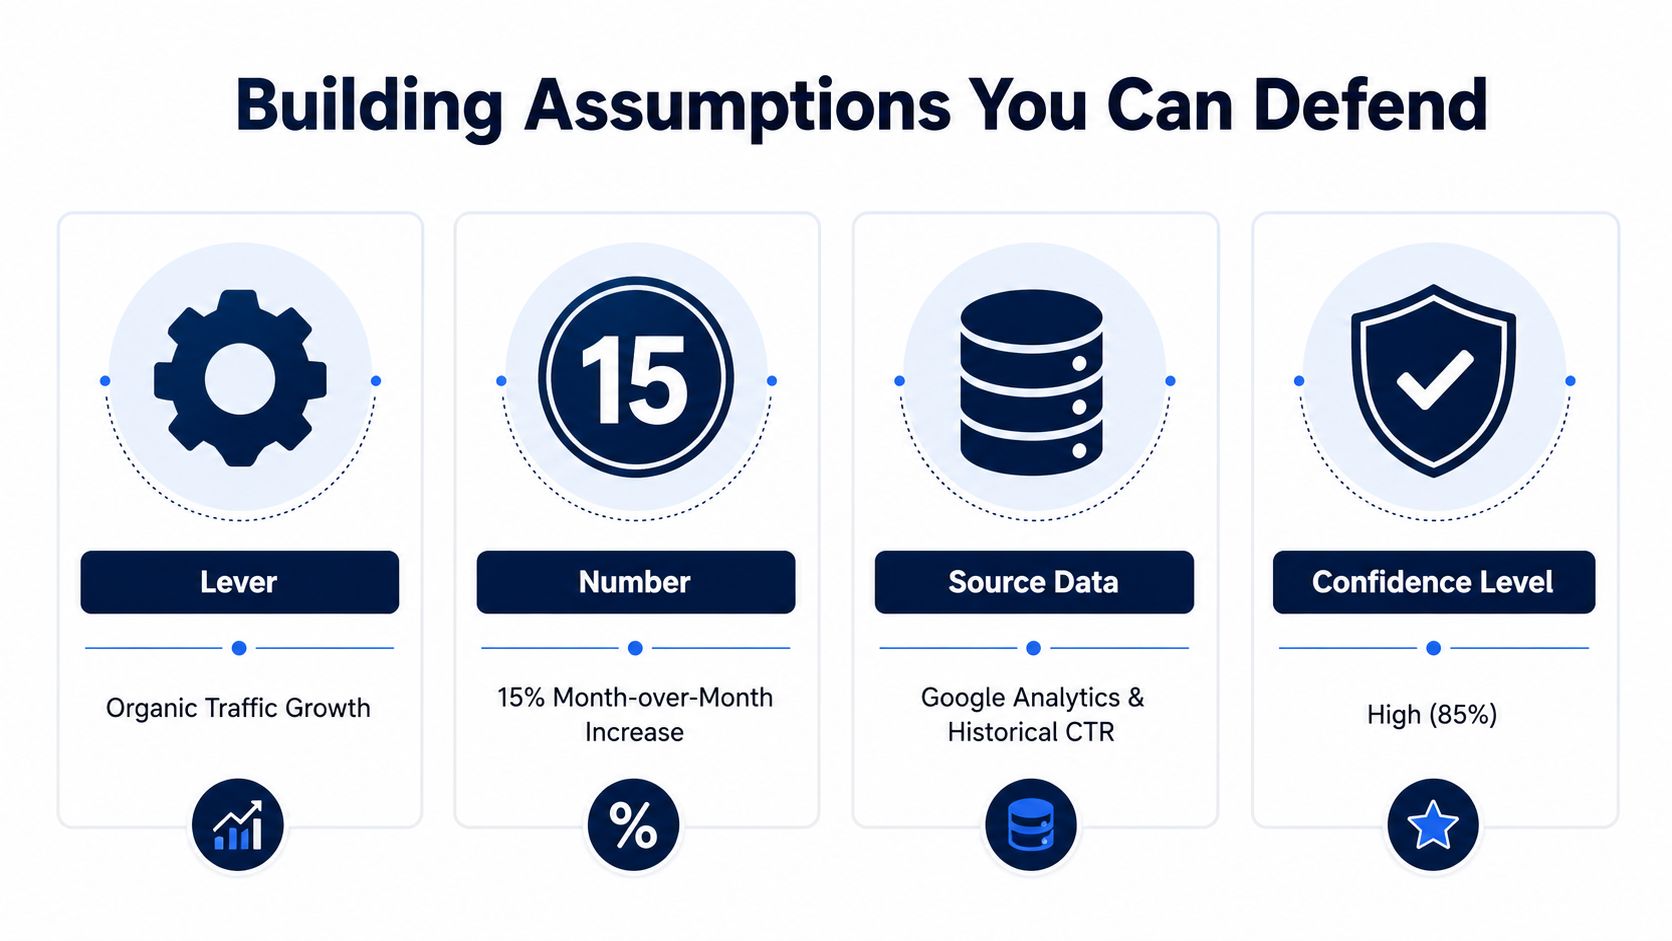
A forecast assumption needs four parts: the lever, the number, the source data, and a confidence level. If an assumption doesn't identify who owns it or what evidence supports it, it's a hope disguised as planning.
Write assumptions in operational language. “Site conversion rate will be 1.8% because the trailing period shows stable performance” is auditable. “Conversion should improve with better creative” is not. The first statement tells the ecommerce manager what to monitor and gives finance a basis for revising the model.
Document assumptions such as:
These examples are planning inputs, not universal benchmarks. Treat them as hypotheses until your own data supports them.
Founders most often overstate paid social scale, assume organic traffic will compound smoothly, assign too much revenue to a new product, and treat a launch-day hero SKU as if its peak demand will persist. Stress-test each assumption against trailing performance ranges, customer cohorts, prior-year seasonality, and relevant category benchmarks.
Use this template in the forecast:
Assumption: [lever] will reach [number] because [source data], owned by [person], with [confidence level].
Confidence labels force a useful conversation. A high-confidence price change differs from a low-confidence launch forecast. Keep both in the model, but don't give them equal weight when making purchase orders or committing ad spend.
A single base case is not a forecast. It's an exposure. Build base, upside, and downside scenarios, and connect each one to a decision trigger.
The base case should represent the most likely path using documented assumptions. The upside case should require specific conditions, such as paid acquisition holding, inventory arriving on schedule, or a campaign producing the expected demand. The downside case should show what happens when two important levers fail together, not just when one input moves slightly.
For most DTC brands, conversion rate, average order value, and paid traffic volume deserve the first sensitivity tests. Use the following example to see how small operating changes affect monthly revenue.
A DTC brand has 180,000 monthly sessions, a 1.9% conversion rate, and a $68 AOV. The base revenue is $232,560, calculated as 180,000 × 1.9% × $68. The table changes one primary assumption at a time, so leaders can see the impact before layering more complex interactions.
| Scenario | Sessions | Conversion Rate | AOV | Monthly Revenue | Δ vs Base |
|---|---|---|---|---|---|
| Downside, conversion pressure | 180,000 | 1.6% | $68 | $195,840 | -$36,720 |
| Base | 180,000 | 1.9% | $68 | $232,560 | $0 |
| Upside, higher basket value | 180,000 | 1.9% | $72 | $246,240 | +$13,680 |
The conversion change is 0.3 percentage points, not a 0.3% relative movement. That distinction matters in the model. A modest conversion-rate miss can create a larger revenue gap than a meaningful AOV improvement, which tells the team where to focus its testing and risk controls.
Tie the outputs to actions:
Scenarios aren't competing predictions. They're decision triggers. The forecast earns its place in the operating rhythm when everyone knows which metric activates a budget change, a purchase order revision, or a hiring pause.
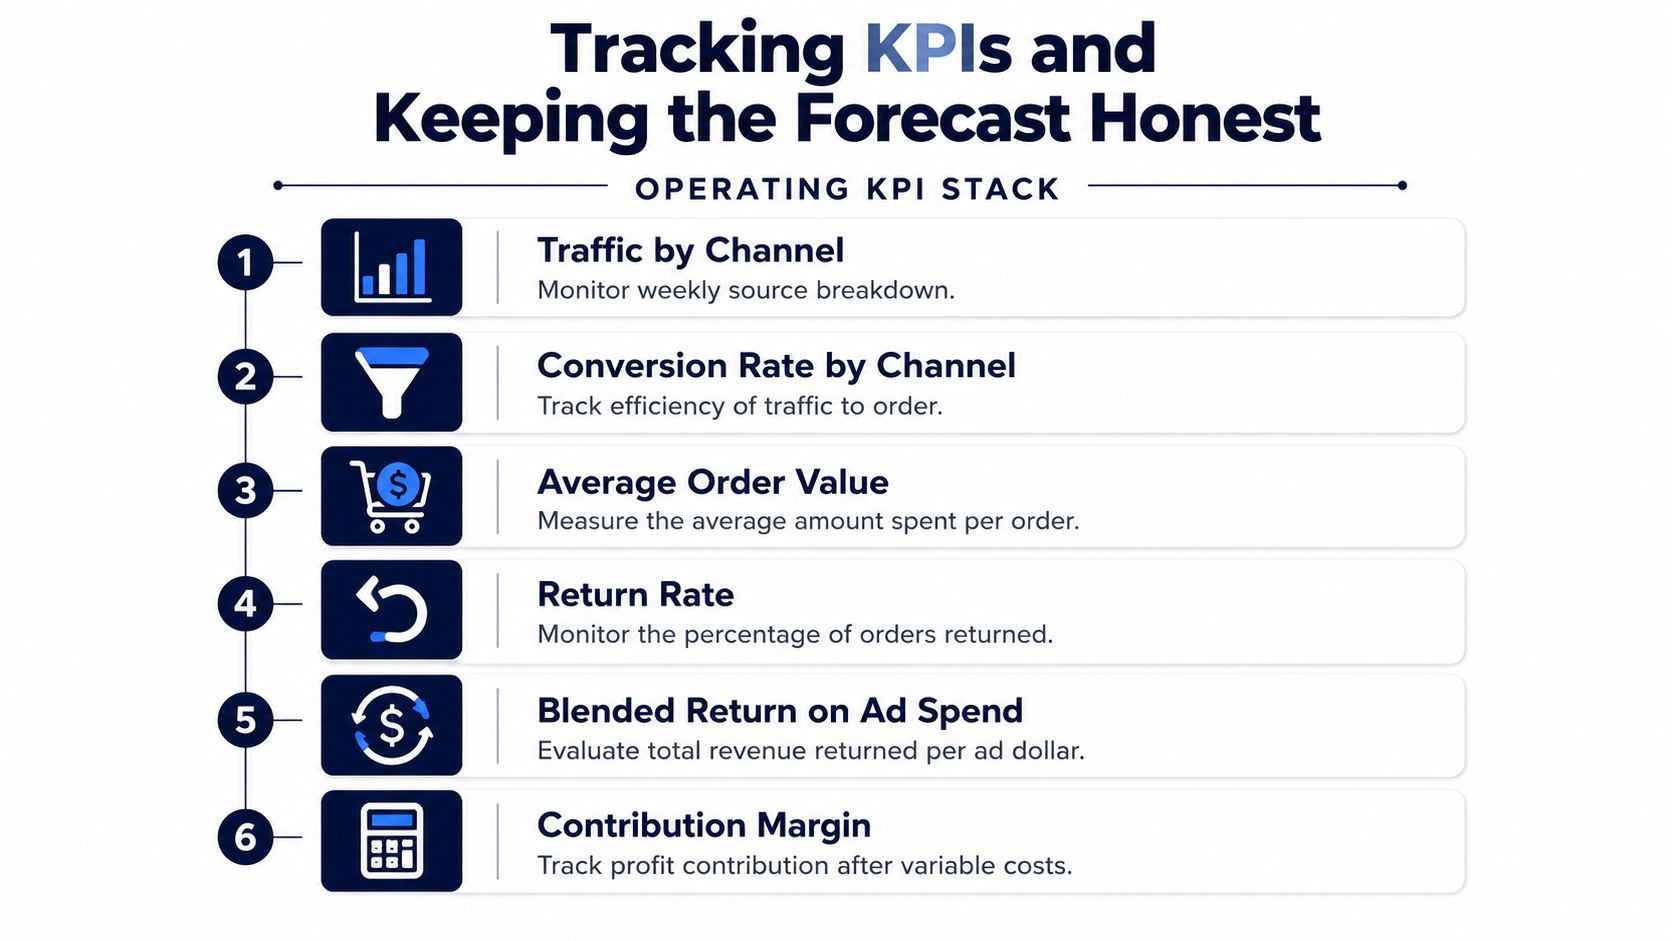
A forecast becomes useful only when operators can challenge it weekly. Put it beside the operating dashboard and compare actuals with plan by channel. A blended total can look healthy while Amazon misses target, DTC carries the month, and inventory or ad spend moves off plan.
Use a KPI stack that connects demand, cash generation, profitability, and supply:
Use this ecommerce KPI framework to structure the dashboard, then adapt the fields to each channel and product category.
Payment behavior also deserves a place in the review. The distinction between revenue, retention, and collection behavior in key payment metrics for SaaS applies to ecommerce operators as well. Separate the metric that signals demand from the metric that determines cash and economic value.
Run a weekly KPI snapshot and variance review. Reforecast the full model monthly, then reset major assumptions quarterly or whenever the business changes materially. Measure error by horizon, such as in-quarter, next-quarter, and full-year, instead of hiding every miss inside one blended score.
Use MAPE for an intuitive percentage error measure. Use WAPE when actuals are small or volatile. Track bias separately, because repeated over-forecasting can disappear inside an absolute-error metric. The benchmark ranges in forecast accuracy guidance place mature in-quarter MAPE around 3% to 7% and next-quarter MAPE around 5% to 10%. Cyclical or launch-heavy businesses can run wider.
Set a clear escalation rule. A forecast that misses plan by more than 10% for two consecutive months requires an assumption review. Do not edit actuals to protect the model. Revisit traffic, conversion, AOV, promotion timing, returns, inventory, and channel mix. Record the cause, the owner, and the assumption changed.
Use variance reporting to control decisions, not to explain misses after the fact. Channel-level gaps should feed the next inventory and media review before they become a cash problem.
Before you lock the next forecast, confirm that the model can survive an operating review. It should explain where revenue comes from, what must happen for the plan to work, and which decisions change when performance moves.
Use this checklist:
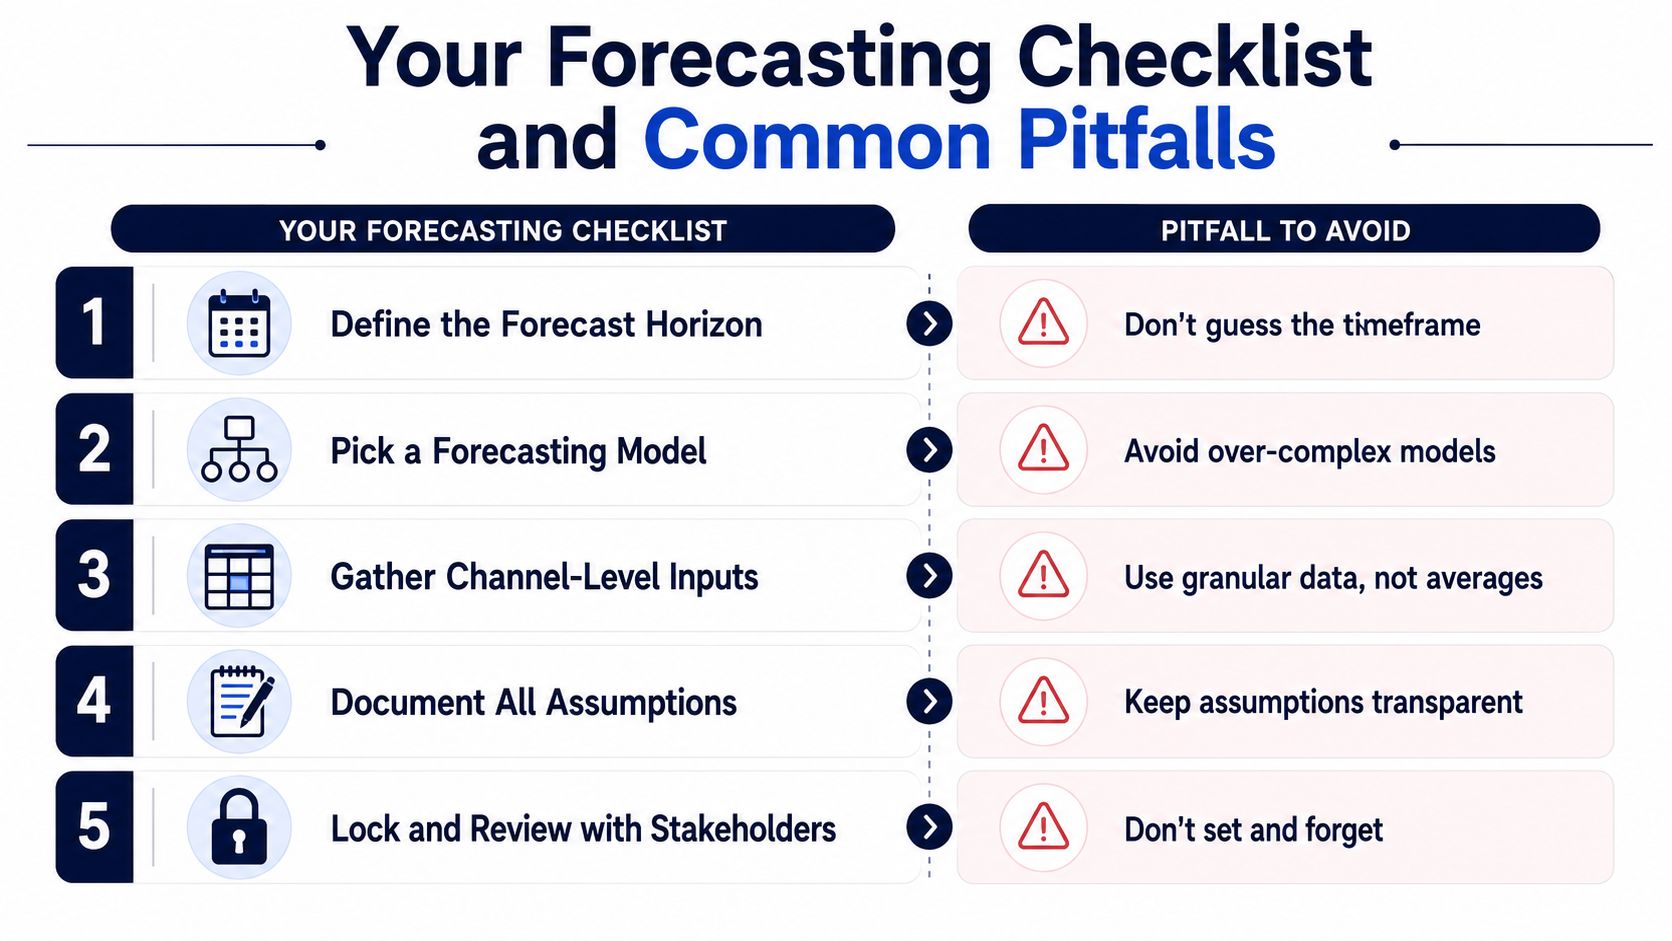
The common mistakes become more expensive as a brand scales:
The best next-week action is concrete. Build a 12-week rolling forecast with base, upside, and downside cases, assign an owner to each key assumption, and schedule a channel-level variance review on day five of every month.
Million Dollar Sellers gives serious ecommerce operators access to a private peer network, strategy sharing, and practical insights from founders running large Amazon, DTC, and omnichannel brands. Visit Million Dollar Sellers to connect with experienced operators who can pressure-test your forecasting discipline, inventory decisions, and growth plans.
Join the Ecom Entrepreneur Community for Vetted 7-9 Figure Ecommerce Founders
Learn MoreYou may also like:
Learn more about our special events!
Check Events